Student. Data Science. Machine Learning. Social. Always up for work and fun. Feel free to hmu. Cheers.
Don't wanna be here? Send us removal request.
Text
Research Progression 3: Asymptotic Extrapolation(2)
....continuing from the last post, we have imagined the idea based on a limitation of Neural Networks, based on that idea, we have even come up with a hypothesis, now let’s continue with some logic and plots.
Background/ Supporting Logic:
Since the model weights are theoretically supposed to slow their rate of change (let’s call it “Delta”) as the model gets trained
i.e. ”Delta” should slow down the closer you are to the ideal value
This curve would appear to be similar to the curve of an “Asymptote”
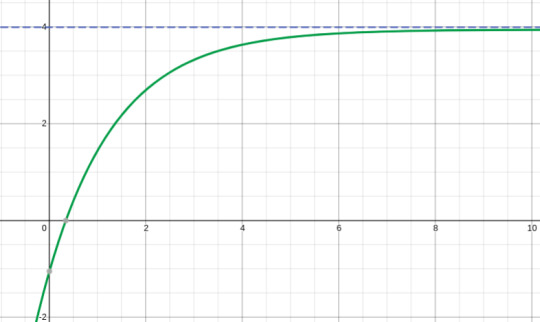
(Example of a horizontal asymptote, the curve (green) has a horizontal asymptote represented by the line y = 4 (Blue))
Furthermore, logically speaking, “Delta” of the value of curve would not just suddenly, jerkily decrease as it nears its ideal value, “Delta” would keep on decreasing with it’s own pattern. Like we observe in the above graph, the slope of the graph (Delta is the slope) does not suddenly change, it’s value keeps on decreasing with an increasing rate (slow - exponential in this case).
What we are trying to do is make a prediction model which is able to study the patterns of Delta and approximate the value of the curve at which Delta becomes zero (or close to zero), That will be the point where we reach the end of our training period
Supporting logic verification:
Everything mentioned up to this point is completely theoretical.
Is that bad? Not at all, everything starts with an idea, and discussing the idea is one of the most important things. However, ideas without evidence, are just thoughts.
So, how do we get supporting evidence of our claim that model weight training patterns are similar to Asymptote graphs which we have often observed in mathematics?
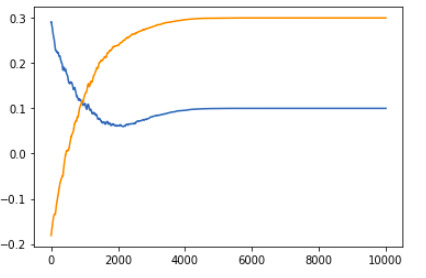
It’s simple, let’s train a simple Neural network and save the values of all the layers during the training period.
Now, we have all the values of training weights, let’s split them into individual sequences based for each trainable variable.
Finally, we can plot the function weights,
These are the ones I got,
1 Layer deep Vanilla Neural Network:
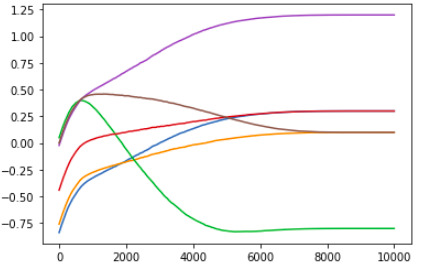
2 Layer deep Vanilla Neural Network:

(you can try it out by checking out this GitHub repository)
So, we have established a similarity between the training pattern of model weights and curves with “Asymptomatic tendencies”
What other inferences can we draw?
One other thing we can notice is that as the depth of the model increases, we get more complex training value curves, however, one fact that remains is that almost all values begin to head towards the “correct direction” after a very brief confusion period.
What I mean by this is if we take a complex model, which is estimated to be trained in around 4000 steps, if we train it for the 200 epochs to avoid the majority of the confusion period, then repeat a cycle of training for 200 steps and predicting value after 400 steps,
i.e.
0 - 200 steps: Training (initial confusion period)
200 - 400 steps: Training
400 - 800 steps: skipped by predicting future value
800 - 1000 steps: Training
1000 - 1400 steps: skipped by predicting future value
... and so on, we can train the model in 1600 Training steps and 2400 predicted steps instead of 4000 training steps.
Keep in mind the 2400 predicted steps are not actually steps, they’re more like a jump, and if we exclude the time and computation for prediction model (I will explain why we can skip that from the calculations), we can get an approximate efficiency of 60%
Furthermore, this efficiency is based off of a very conservative optimisation (i.e. jump window is only of 400 steps per 200 steps)
.... let that sink in...
Reason to skip prediction jump computation time from calculation:
For all of you hopeless critics (JK, always ask questions, as much as you can), the reason we can skip prediction computation cost from the calculations has 2 parts:
a) The computation required for predicting through a Neural Network is much much more negligible compared to the training phase (since training requires both forward and backward passes, that too for every single step while predicting requires a single forward pass)
b) The other reason is that time series forecasting type models work on a sequence of inputs (in our case a sequence of values of weights after every step of the training procedure). Since the 2 models (the original model being trained and the asymptote predicting model) are separate, during actual deployment, we can give the sequence of values (200 values in the above example) to the asymptote predicting model simultaneously while the original model is being trained, thus ignoring the time required to process the asymptote predicting model (let’s say it takes 1 second for every step of the original model to train, then as soon as each step finishes, we can send the new value to the asymptote predicting model, thereby letting it do it’s computation for 199 steps before the 200 step training sequence for the original model is even finished)
That was it for the idea,
Feel free to ask any questions in the comments, code explanation for the repository coming soon, stay tuned...
Thanks for following along,
One enigma decoded, on to the next one....
0 notes
Text
Research Progression 2: Asymptotic Extrapolation(1)
So the first topic in our series of posts based on research projects will be something I like to call: Asymptotic Extrapolation.
The main Idea:
Can we use training history of machine learning model weights in order to predict their final values. By using a time series forecast type model, we might be able to study the values of weights (and their changes) during a small training period to be able to predict the future value (the values which might be reached after much longer training periods).
Inspiration:
One major role of data science (and machine learning in particular) is to be able to predict values of variables by looking at subliminal patterns within data. So why not use Data Analytics on Machine Learning itself!
During the training of a machine learning model, the trainable variables (also called weights of the model) change their values slowly in order to make the model more accurate.
If we record the slow changes that said model weights undergo (and plot this curve), we can “Extrapolate” the graph to predict what the value of the weights would be after an indefinite amount of time.
Motivation:
Neural Nets (NN) are wonder tools, everyone who has even remotely studied Machine Learning would know that. At the same time, NN are basically a black box which we cannot understand very clearly (i.e. there is no simple way to convert what a Neural Net has learned into a human understandable language).
Since we cannot clearly understand the inner workings, we don’t have a way to mathematically streamline the inner structure of a Neural Net. Due to this gaping limitation in coding and mathematical capabilities, in order for a Neural Net to be effective, we need to give it “Space” (yeah, this isn’t a joke on all of you single coders); that is to say, give it storage and computational space, massive amounts of it.
The level of this demand is so large that many Neural Nets have millions of trainable parameters (variables or weights) and they require such a huge amount of compute power, that sometimes, even the ability of a Neural Net i.e. being able to “Predict”, is not enough of an advantage to compensate it’s costs and the biggest part of this computation is utilised during the “Training period” of the Neural Network.
All of the above story is to say 2 things:
a) inner workings of Neural Nets are really difficult to understand and improve
b) Neural Nets require insane amounts of computation to train
Can we solve even one of these problems? Well the simple answer is “Yes”, we can in fact solve both of them in a single shot with the help of something we like to call “Asymptotic Extrapolation”
More stuff coming up on the next post, stay tuned.
Thanks for following along,
One enigma decoded, on to the next one....
0 notes
Text
Research Progression 1: How to do it?
Hi there! Welcome to the first post in the series of research projects.
Before we Jump into any actual ideas related to research and the like, I would like to briefly explain the “How to do it” portion of the problem.
Research is generally of 2 types:
1. New approach
2. Improvement approaches
Practically speaking, if your aim is to get a research paper published in order to improve your resume (Whoo Hoo a research paper!!), I completely understand, and the best way to go about doing that will be by going for an improvement approach or a combination approach; since the foundation is already built, you can get your ideas by critiquing their approach and/or going through their future research sections of the paper, etc. and submitting your improvement/ combination paper in the special issues of various journals.
However, the approach we will be following in this series will be New approaches(and this is not just to be a party pooper). There are a couple of reasons for that:
1. New research approaches are generally very open ended and thus can be better discussed by a wider variety of people and as we all know, discussions are the best way to improve your horizons and clarify your thoughts, specially for anyone new to the field.
2. Most new approaches can head into multiple directions without interfering with each others’ chances of developing an actual research paper. For example, a new framework approach can have one paper based on it’s basic implementation, another as an improvement focusing on a different metric (like security or penetration testing), or an adaptation into an application based subfield (such as transforming the framework to better work with smart homes/ IoMT, etc.) and so many more.
3. New approaches do not have a finite discussion time period, even if a paper is published relating to it, the research on said approach does not stop and in fact can get even more interesting/ informative.
Having cleared that, now we more on to,
How to do it:
Depending on the technology being researched, there are different procedures to pursuing different research ideas.
1. Machine Learning based:
ML based approaches are generally focused on improving the accuracy or performance of a class of models (eg. CNNs) or a prediction sector (eg. time series forecasting)
Steps to be followed include:
1.1. Identify Dataset: this can be done by searching on Kaggle or simply on google. Even if a complete dataset is not yet identified, estimating the structure and characteristics of the dataset is important in order to dentify the model type and structure. Further, depending on the specific idea, identifying data analysis tools is also a very good idea.
1.2. Create the machine learning model: use libraries like TensorFlow or Keras to initialise your model on a sample data. A sample data can be in the form of a synthetic dataset following an ideal function (I made a repository to help you guys with making synthetic datasets to test out machine learning models: https://github.com/ANSH-RIYAL/syntheticDataset). If you had been able to identify a solid real database, you can take a small subpart of it as a sample data.
1.3. Run your model/approach on the dataset, use time and storage performance comparison libraries to derive the numerical figures for comparison. use libraries like matplotlib to further plot other comparative graphs.
1.4. You have the figures, codebase and comparison metrics you need to compose your research paper, pair up with someone with experience of writing publications and start looking for “calls for papers” and “special issues” on the websites of Machine Learning based journals belonging to big publications (eg. Springer, Elsevier, IEEE, Taylor & Francis, etc.)
2. Blockchain based:
Blockchain based approaches have a set of defined metrics when it comes to evaluating any new approach. These include Transaction throughput, network storage, data transfer, read latency, etc. The funny part is that although these sound complex, their actual meaning can be very easily understood by reading any book chapter/ research paper belonging to the field.
Steps:
2.1. The biggest task to be done when pursuing research in a blockchain related framework is building the base network which is responsible for blockchain communication. This can be done in one of two ways:
a) Blockchain simulation softwares
b) Node to Node communication through lightweight backend development
I will explain the specifics for both of these implementations in their respective posts (coming really soon)
2.2. The next task is to set up the base code for either of the two approaches, simulation software have their “How to use” tutorials and I will soon upload the codebase for a generic blockchain developed on the flask backend along with a How to use documentation for customisation of the codebase. You can simply clone the repository and start exploring and experimenting with the setup to transform it towards your approach.
2.3. The simulation tools have their own pre built performance measuring functions which help with getting figures and plots required for comparative analysis. In the case of backend development, you get a much deeper knowledge of your own codebase and a lot more customisation capabilities but the performance comparison needs to be done separately by yourself.
2.4. After either of these routes, you again end up with figures, comparison metrics and codebase and you have to again compose your research paper in the same way as mentioned in (1.4.).
3. IoT and Distributed Computing based:
This method is quite similar to the Blockchain based method, personally I would recommend doing lightweight backend development for any approach/idea which is complex enough to the point of either building a new framework or combining multiple technologies. However, simulation software exist for both IoT as well as Distributed Computing (Fog, Edge, Cloud) based approaches
Apart from the textbook protocol to be followed while pursuing research, many people feel a slight inferiority when entering the field of research for the first time. To get over this feeling and allow your mind to really become creative, there are two things to do:
1. Read up a lot of published research papers centred on your preferred field fo research. This is very straightforward and you can search for topic specific journals or just do a normal search on https://scholar.google.com. Reading up the work of others is the first step to being able to write your own work.
The next step in this is to try to implement the approaches that the papers have explained (in their “researcher readable” format). Understanding other peoples’ work and being able to implement it is the second step to being able to turn your work into research readable format.
The final step in this is to try making some logical modifications to the codebase (regardless of whether or not they are optimisations) and visualise how your changes should be explained in the language of existing research papers.
2. The other approach is to start with a research project instead of a research paper. Research projects are somewhat similar to local codes that majority of us are familiar with. Furthermore, research projects are generally based on a completely original idea, so they are built from scratch and by the time you finish with building everything required for the codebase, you are already familiar with every step of the working and “know” that writing the research paper is just a means of turning the language of your project from C++/ Python/ java/etc. to “Fancy” English.
3. Pairing up with someone with experience of writing publications is a very good method as well, this lifts a lot of formatting burden off of you and everyone is able to focus on the actual work.
That was the end of this post, subsequent posts will be split into sub posts for convenience of reading, commenting and discussion.
“How to do it” was supposed to be an introductory compilation of the basics that anybody new to research might need, hence had to be longer than the standard post length.
Thanks for following along,
One enigma decoded, on to the next one....
0 notes
Text
Research Progression
Hi there!
I am starting a series of posts centred around research projects, how to develop ideas, start researching, improve and incorporate new ideas and finally use the project as the basis of writing a research paper, etc.
The topics I will be covering will include:
1. Machine Learning
2. Block-chain
3. Internet of Things
4. Edge, Fog and Cloud computing
This series however, will not be limited to the aforementioned topics. They are simply the topics I am most interested in (or have the most research prospects) currently and aim to serve as the starting point for the series.
What this series will contain:
The contents will include ideas, follow-ups, semi coded projects, fully coded projects (both successful and unsuccessful) as well as discussions and question-answers centred in and around the world of research.
I would like to mention that even though I have come up with the ideas coming up in this series, there are no restrictions on who can use them or what team they have to form up while pursuing them.
Some of these approaches are merely initial ideas, some are slightly more developed, while others might be quite worked upon (even up to the point of having their own coding implementations available with me) regardless, if anyone wishes to, they are free to pursue them.
Having said that, for anyone who might be interested in pursuing any of the ideas, I would really appreciate starting a discussion in the comment sections and create teams or recruit members of the team from others involved/ interested in the discussions. However, if you wish to keep your pursuing an idea a discrete fact (Although I don’t recommend being this secretive) I would like to request that you, at the very least, inform me so that I may pass on the information about weather an idea is being pursued and by how many teams.
The aim:
By means of this series, I aim to create a forum for an introduction into the field of computer science related research for people with varying degrees of expertise. The ultimate goal is to create an ecosystem for people to connect with each other in order to discuss ideas, approaches, suggestions and coding methodologies in order for researchers to group together to share ideas and pursue new and interesting applications.
Motivation:
The main reason I decided to start with this series was my own experience with research projects and research papers and the difficulty in navigating through the field, especially for anyone who might consider themselves as an outsider into the field and has little to no connections with other more experienced researchers to guide them.
This fact is often highlighted when I encounter friends who are interested in doing research but are missing the “How to do it” part and/or a team. I have decided to demystify the air surrounding research
Feel free to message me personally if you need any help/ guidance and I will try to help out to the best of my capabilities.
Thanks for following along,
One enigma decoded, on to the next one....
0 notes
Text
Peer Graded assignment week 2
Program:
LIBNAME MYData "/courses/d1406ae5ba27fe300 " access=readonly; data newData; set MYData.nesarc_pds; if AGE LE 50; proc sort; by IDNUM; proc freq; tables S9Q6A S9Q44 S9Q1A S2DQ4C2 S2DQ3C2 S2DQ2 S2DQ1 AGE; run;
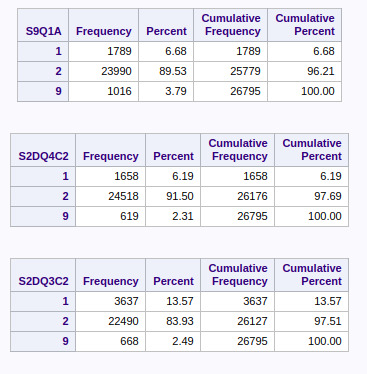
In the above tables, the categorical variables record “unknown” or missing values with an entry 9.
By the frequency distribution, around 2.3% to 3.8% of values (with age less than 50) are missing, the rest are known and their respective distributions are as mentioned.
The meaning of values from each category (1 or 2 or 9) can be seen from the codebook (mentioned in week 1 peer graded assignment)
0 notes
Text
Codebook and Frequency Distribution
Update 1:
The Codebook:
Family History Variables:
Categorical Variable: Blood/Natural Father ever an alcoholic or problem drinker; (S2DQ1)
Categorical Variable: Blood/Natural Mother ever an alcoholic or problem drinker; (S2DQ2)
Categorical Variable: Any Full Brothers ever an alcoholic or problem drinker; (S2DQ3C2)
Categorical Variable: Any Full Sisters ever an alcoholic or problem drinker; (S2DQ4C2)


General Anxiety Variables:
Categorical Variable: Ever had 6+ month period felt tense/nervous/worries most of the time; (S9Q1A)
Categorical Variable: In worst period, often became so restless you fidgeted, often paced, or couldn't sit still; (S9Q44)
Quantitative Variable: Age at onset of first episode; (S9Q6A)


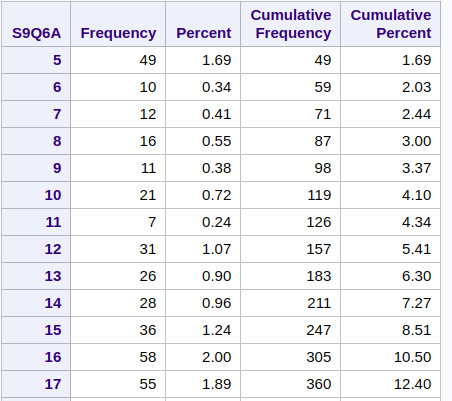
The Frequency Distribution of the above variables:
Age at onset of first episode:
and so on.... upto....

Categorical Variable: In worst period, often became so restless you fidgeted, often paced, or couldn't sit still; (S9Q44)

Categorical Variable: Ever had 6+ month period felt tense/nervous/worries most of the time; (S9Q1A)

Categorical Variable: Any Full Sisters ever an alcoholic or problem drinker; (S2DQ4C2)

Categorical Variable: Any Full Brothers ever an alcoholic or problem drinker; (S2DQ3C2)

Categorical Variable: Blood/Natural Mother ever an alcoholic or problem drinker; (S2DQ2)

Categorical Variable: Blood/Natural Father ever an alcoholic or problem drinker; (S2DQ1)

The point of this series of posts is to enable people to go along with the data visualisation course without actually involving in finding unique problem statements and submitting assignments.
More updates coming as I go along...
I will also be writing a post to include a self made collection of pointers to using SAS that I learned throughout the course.
(Stay tuned for more...??)
0 notes
Text
Data Management and Visualisation - Week 1 Assignment
I have selected the data of NESARC Wave 1 data. I have chosen to study the relationship between Family history of Alcohol consumption and Generalized Anxiety.
To be more specific, I wish to observe the effects of a family history of alcohol consumption on the mind of an adult i.e. the psychological side of upbringing exemplified by Generalized Anxiety.
In the NESARC dataset, I have chosen:
Categorical Variable: Blood/Natural Father ever an alcoholic or problem drinker; (S2DQ1)
Categorical Variable: Blood/Natural Mother ever an alcoholic or problem drinker; (S2DQ2)
Categorical Variable: Any Full Brothers ever an alcoholic or problem drinker; (S2DQ3C2)
Categorical Variable: Any Full Sisters ever an alcoholic or problem drinker; (S2DQ4C2)
Categorical Variable: Ever had 6+ month period felt tense/nervous/worries most of the time; (S9Q1A)
Categorical Variable: In worst period, often became so restless you fidgeted, often paced, or couldn't sit still; (S9Q44)
Quantitative Variable: Age at onset of first episode; (S9Q6A)
The variables I have chosen are selected to focus on the relationship between long term anxiety starting from young age resulting from family history of alcohol consumption.
Research Question: Does a relationship exist between Family history of Alcohol consumption and general anxiety disorders?
Hypothesis: Family history of alcohol consumption affects the psychological upbringing in a way as to induce psychological strain based disorders like general anxiety.
To the best of my knowledge, no earlier study exists on this.
The closest one found was a study by Meghan E. Morean et. al. on the effects of family history of alcohol consumption and anxiety disorders as a trigger/ factor in inducing alcohol related problems in young adults.
1 note
·
View note