#tcp headers
Explore tagged Tumblr posts
Visit Tumblr Blog
Explore Tumblr blogs with no restrictions, modern design and the best experience.
Last Seen Tumblr Blogs


Fun Fact
Mobile US users spent an average of 115.8 minutes on Tumblr app monthly.
Text


the tortured poets department (couple’s version). like/reblog if you save or use. 🪿
arts credits: @cesea.art (xadenviolet), @hachandrws (ruhnlidia), @nairafeather (herongraystairs), @manaarts_ (percabeth), @artoffrostandflame (jurdan), @mahpiyaluta_ (elucien)
#xadenviolet#xadenviolet headers#ruhnlidia#ruhnlidia headers#herongraystairs#herongraystairs headers#percabeth#percabeth headers#jurdan#jurdan headers#elucien#elucien headers#fourth wing header#crescent city#percy jackon and the olympians header#percy jackson headers#the cruel prince headers#the cruel prince header#the infernal devices#a court of thorns and roses#acotar headers#tcp headers#booktwt#bookstan#booktwitter#book headers#book quotes#the tortured poets department headers#the tortured poets department#ttpd header
427 notes
·
View notes
Text


the cruel prince headers.
like or reblog if you save/use.
credit to jude's fanart to frostbite.studios on instagram.
credit do jurdan's fanart to baaozher on tumblr. (xx)
fanarts are not mine, but if you want me to delete any of these edits, just send me a message.
#headers#books headers#headers books#the cruel prince#headers the cruel prince#the cruel prince headers#jude duarte#headers jude duarte#jude duarte headers#cardan greenbriar#cardan greenbriar headers#headers cardan greenbriar#tcp headers#headers tcp
123 notes
·
View notes
Note
back in the day networking software was what is defined as monolithic: it was all one big blanket of code that handled everything from the data to send to what headers and information add to it before sending it to the Cables(tm)
problem is, get one problem somewhere, you have to unravel all of it to find where the problem is, and the network stops netting and/or working
enter, drumroll please,
iso/osi stacks
the guys over at iso (the organization) came up with this nifty little trick to slice up the Big into many Smalls: 7 layers (or abstraction layers if you are a big nerd)
application: here are the high-end protocols! like http, ftp (file transfer protocol, what were you thinking?) and the dreaded simple mail transfer protocol which i can say after studying it, it is not simple
presentation: applications dont speak internet, so presentation handles (de)codification, (de)encryption and (de)compression however the Protocols see fit
session: most protocols don't have functions or buffers to remember who sent what so session handles keeping connections alive with sessions: little tin cans with a string so the two members of the communication remember each other
transport: this guy is responsible for whether you want to use tcp or udp as a transport protocol (tcp is slower and has data validation for the recipient, udp is faster but fails more often) and chopping up data in tidbits to actually be able to wring them around the net
network: handles ip addresses, routing and telling the other guy everything is okay because that fuckass udp lost me two whole packet fragments
data-link: the oddball of the bunch because it has a dash in its name. and also because it's two sublayers under a trenchcoat
physical: takes whatever the upper layers gobbled up and zip-zaps the cable to send electricity
basically what happens is application concocts the data, hands it to presentatiom and one it is done, it hands it down to session, so on and so forth until physical sends it to the recipient who is going to do the opposite! physical takes the data, gives it to data-link, d-l chews it up a bit, gives it to network until application gets the oh-so-coveted picture of a cat the sender was sending
it's not over yet as those cheeky bastards managed to wedge the stack open with a lego brick remover and stick a little guy called secure sockets layer in to secure the sockets (woah.). he's dead and now we have transport layer security which is that, but better
whevernevr you see an s at the end of a protocol's name, it means one of these two motherfuckers meddled with your data to make it secure and unreadable to the big mean hackers typing dir /s in green letters in the command prompt
Huh
5 notes
·
View notes
Note
hiiii <33 just went through your blog and carrd and i think you're a really cool and interesting person! id love to get to know you more 💓 you've got immaculate taste btw also i could find some of my fav artists and media listed there too so <33
sending love hope you're doing well 💌
HIIII ur blog is p immaculate too hehe gorgeous vibes all around !!!! i’d love to talk about our shared interests sometime; ur tcp and pjo tags are immaculate + ur theme is so banger as well where did u get ur header quote from :0
3 notes
·
View notes
Text
WebSocket Vulnerabilities in Symfony: A Secure Guide
WebSockets are widely used in Symfony applications to enable real-time communication, but they also open up new attack surfaces if not implemented securely. This post explores common WebSocket vulnerabilities in Symfony, shows how to test for them, and gives secure coding practices with examples.
If you maintain a Symfony web application, make sure you scan your website with our Website Vulnerability Scanner online free.
Why WebSocket Security Matters in Symfony
Symfony developers often use WebSocket libraries such as Ratchet, Mercure, or custom WS servers. Unlike HTTP, WebSockets establish a long-lived TCP connection, bypassing some of the typical HTTP request-response protections.
Attackers can exploit vulnerabilities such as:
Cross-Site WebSocket Hijacking (CSWSH)
Insecure Origin validation
Message tampering & injection
Lack of authentication on WebSocket channels
Information disclosure over unencrypted WS (ws://)
Example scenario: If you forget to validate the Origin header, a malicious site can connect to your WebSocket endpoint from a victim’s browser and hijack their session.
Testing WebSocket Security in Symfony
You can test your Symfony app’s WebSocket endpoints with tools like:
wscat
Burp Suite
OWASP ZAP
Our Free Website Vulnerability Scanner
📷 Screenshot of our Website Vulnerability Scanner tool interface:
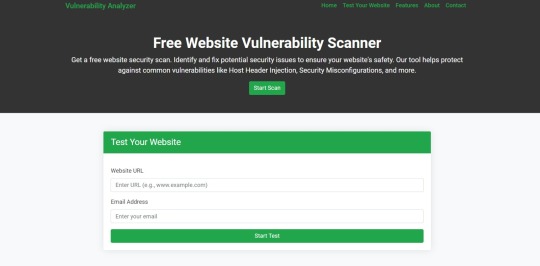
Screenshot of the free tools webpage where you can access security assessment tools.
Run a scan, and you’ll get a detailed vulnerability report highlighting weaknesses.
📷 Sample assessment report generated by our free tool to check Website Vulnerability:
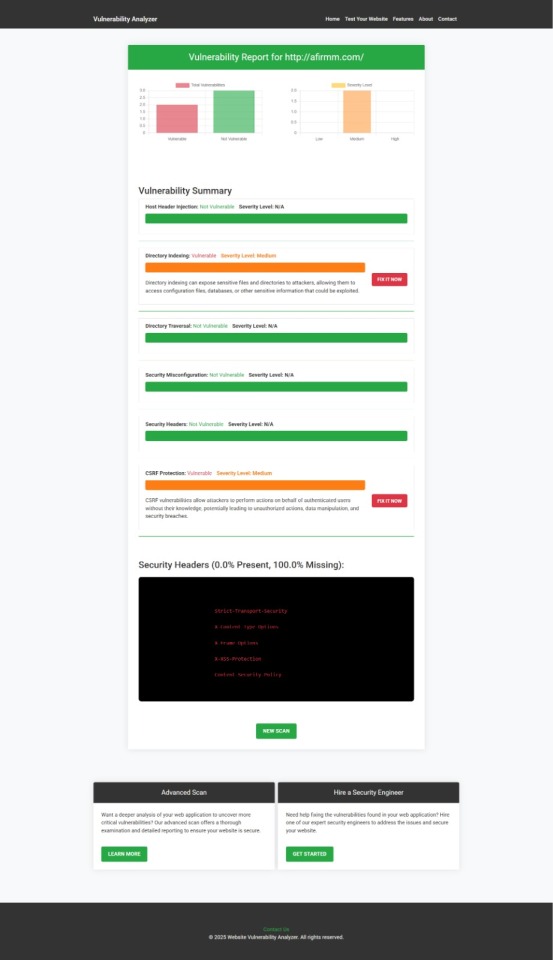
An Example of a vulnerability assessment report generated with our free tool, providing insights into possible vulnerabilities.
Coding Example: Protecting WebSocket in Symfony with Ratchet
Here’s how you can securely validate WebSocket connections in Symfony using Ratchet:
1️⃣ Validate the Origin
use Ratchet\MessageComponentInterface; use Ratchet\ConnectionInterface; class SecureChat implements MessageComponentInterface { public function onOpen(ConnectionInterface $conn) { $origin = $conn->httpRequest->getHeader('Origin'); if (!in_array($origin[0], ['https://yourdomain.com'])) { $conn->close(); return; } echo "Connection from {$conn->remoteAddress}\n"; } public function onMessage(ConnectionInterface $from, $msg) { // Sanitize & handle messages } public function onClose(ConnectionInterface $conn) {} public function onError(ConnectionInterface $conn, \Exception $e) {} }
✅ This ensures only trusted origins can establish a connection.
2️⃣ Enforce TLS (WSS)
Always configure your WebSocket server to run behind HTTPS and accept only wss:// connections.
In your Symfony Nginx config:
location /ws { proxy_pass http://127.0.0.1:8080; proxy_http_version 1.1; proxy_set_header Upgrade $http_upgrade; proxy_set_header Connection "upgrade"; proxy_set_header Host $host; }
And make sure your TLS certificates are properly configured.
3️⃣ Authenticate WebSocket Clients
You can use Symfony’s session or JWT tokens during the handshake:
use Firebase\JWT\JWT; public function onOpen(ConnectionInterface $conn) { $queryParams = $conn->httpRequest->getUri()->getQuery(); parse_str($queryParams, $params); $jwt = $params['token'] ?? ''; try { $payload = JWT::decode($jwt, $yourSecretKey, ['HS256']); } catch (\Exception $e) { $conn->close(); return; } }
Learn More: Symfony Web Security Services
We offer advanced Web Application Penetration Testing Services tailored for Symfony and other PHP frameworks. If you’d like a professional team to test and secure your app, visit: 🔗 Web App Penetration Testing Services
Agencies: Offer Cybersecurity to Your Clients
Are you an agency or freelancer serving clients? You can resell our penetration testing services to your clients and earn more while protecting their web assets. Learn more: 🔗 Offer Cybersecurity Service to Your Client
📚 Stay Updated with the Latest Security Tips
We regularly publish detailed blog posts, guides, and examples on our blog: 🔗 Pentest Testing Blog
And don’t forget to subscribe to our LinkedIn newsletter to stay ahead: 🔗 Subscribe on LinkedIn
✅ Final Tip:
Run your Symfony app through our free tool for a Web App Security test and share the results with your dev team. Fixing these issues proactively saves time, money, and reputation.
Try it here: 🔗 https://free.pentesttesting.com/
1 note
·
View note
Text
Understanding Linux Packet Analyzers: A
Linux packet analyzers are vital tools for network monitoring and analysis. They capture and examine data packets traveling over a network. This helps in identifying network issues and security threats.
Understanding how these tools work is crucial for IT professionals. They provide insights into network performance and help optimize it. Packet analyzers are used in various scenarios, from troubleshooting to security assessments.
Popular tools like Wireshark and tcpdump are widely used. They offer different features and interfaces to suit various needs. Choosing the right tool depends on your specific requirements and expertise.
Packet analyzers can operate in promiscuous mode. This allows them to capture all packets on a network segment. They are essential for maintaining network health and security.
Ethical considerations are important when using these tools. Ensuring privacy and compliance is crucial. This guide will help you understand and choose the best Linux packet analyzer for your needs.
What Is a Linux Packet Analyzer?
A Linux packet analyzer is a tool that intercepts and logs traffic over a network. It monitors data packets, which are units of data transmitted over networks. These tools provide insights into network health and security.
Packet analyzers help dissect each packet, revealing detailed information. This includes headers and payloads, crucial for understanding network dynamics. They allow users to see what data travels between devices.
Packet analyzers can detect unauthorized access and troubleshoot issues. They provide a window into network performance and potential bottlenecks. This makes them indispensable for network administrators.
Common features of packet analyzers include:
Capturing and decoding network packets
Filtering traffic based on protocols
Providing detailed analyses and reports
These tools are central to network diagnostics and security enhancements. They also aid in capacity planning and compliance verification. Linux packet analyzers are versatile and vital for robust network management.
Why Use a Packet Analyzer on Linux?
Using a packet analyzer on Linux is key for many IT tasks. It’s essential for diagnosing network issues and enhancing security. These tools provide visibility into your network’s operations.
Packet analyzers pinpoint network inefficiencies and vulnerabilities. They can identify unwanted or malicious traffic. This assists in preemptively managing network threats.
A Linux packet analyzer’s versatility extends beyond troubleshooting. It’s also valuable for optimizing network performance. By tracking bandwidth usage, you can allocate resources more effectively.
Key benefits of using a Linux packet analyzer include:
Detecting unauthorized access
Analyzing bandwidth and resource usage
Improving network configuration
Enhancing security measures
Beyond technical benefits, these tools are open-source and customizable. They integrate seamlessly with other Linux network utilities. This makes them a robust addition to any network administrator's toolkit.
How Packet Analyzers Work: The Basics
Packet analyzers, also known as sniffers, capture network data packets. These packets contain crucial information about network traffic. By examining them, you gain insight into network operations.
When a packet analyzer is activated, it enters promiscuous mode. This allows it to intercept all packets on a network. You can then filter and analyze these packets to extract specific data.
Analyzing packet headers and payloads is central to the process. Headers contain source and destination details. Payloads hold the actual data transmitted over the network.
Packet analyzers can evaluate numerous protocols, such as TCP/IP and HTTP. This makes them versatile tools for varied network environments.
Key steps in packet analysis include:
Capturing network packets
Filtering data for analysis
Analyzing packet headers
Examining packet payloads
Here's a simple illustration of a packet analyzer in action:

Understanding how these tools work is essential for effective network management. They transform raw data into meaningful insights, ensuring network efficiency and security.
Key Features of Linux Packet Analyzers
Linux packet analyzers come packed with a variety of features. These features are designed to cater to both beginners and experts alike. Key among them is the ability to capture all packets on a network segment.
Advanced filtering options allow users to focus on specific types of traffic. This aids in analyzing only relevant data, thus saving time and resources. It also enhances the precision of troubleshooting efforts.
Real-time analysis and reporting are other crucial features. These functions provide immediate insights into network status, helping in quick decision-making. They are especially useful in dynamic environments.
Packet analyzers are known for supporting multiple network protocols and interfaces. This versatility makes them suitable for various network setups. Essential features include:
Packet capture and filtering
Protocol analysis
Real-time reporting
Multi-interface support
These features make Linux packet analyzers indispensable in network management and security.
Popular Linux Packet Analyzers: Overview and Comparison
The world of Linux network packet sniffers is rich with powerful tools. Each tool offers unique features designed for specific needs. Selecting the right one is crucial for effective network management.
Wireshark stands out for its user-friendly interface and comprehensive protocol support. It’s often preferred by those who enjoy visual insights. Meanwhile, Tcpdump offers a command-line alternative suited for speed and efficiency.
Tshark acts as the command-line counterpart to Wireshark. It combines command-line flexibility with Wireshark's robust functionalities. This makes it popular among professionals who favor the terminal.
Other tools like netsniff-ng and Arkime add diversity to the selection. These tools cater to advanced users needing specialized features. They offer additional flexibility and customization options.
Here's a brief comparison of popular options:
Wireshark: GUI-oriented with broad protocol support.
Tcpdump: Command-line simplicity, ideal for quick checks.
Tshark: Command-line version of Wireshark.
Netsniff-ng: High-performance, minimal footprint.
Arkime: Focused on large-scale packet analysis.
Understanding the unique strengths of each tool is vital. This knowledge guides the choice of software based on specific requirements. It ensures optimal performance and ease of use.

Wireshark
Wireshark is celebrated for its intuitive graphical user interface. This feature makes it accessible even to beginners. Its ability to dissect and analyze hundreds of protocols is unparalleled.
The software is open-source, ensuring regular updates and improvements. This community support is crucial for staying current with network trends. Wireshark can also provide detailed statistics about network usage.
Key features of Wireshark include:
User-friendly GUI
Extensive protocol support
Open-source community support
Overall, Wireshark is a versatile choice suitable for diverse use cases.

Tcpdump
Tcpdump is a preferred option for those who favor the command line. It excels in simplicity and efficiency. The tool is robust, offering high performance even in busy networks.
Network professionals appreciate tcpdump for its precision and speed. Its power lies in its ability to filter and display packets in a concise format. Tcpdump is available across different Unix-like operating systems.
Prominent features of Tcpdump include:
Command-line interface
High-speed packet capturing
Support for multiple Unix OS
Tcpdump is ideal for users familiar with command-line operations.

Tshark
Tshark offers the functionalities of Wireshark without a GUI. It operates entirely within the command-line environment. This makes it suitable for users comfortable with terminal operations.
Tshark supports extensive protocol analysis. Its detailed command-line output is appreciated by many professionals. It's also portable and easy to integrate into scripts or automation processes.
Notable features of Tshark include:
Comprehensive protocol analysis
Command-line operation
Compatibility with scripts
This tool is perfect for automated tasks and remote analysis.
Other Notable Tools (netsniff-ng, Arkime, etc.)
Netsniff-ng is renowned for its high-performance capabilities. It is optimal for users requiring lightweight network analysis. Designed to be efficient, it captures packets with minimal resource usage.
Arkime is another tool known for large-scale packet analysis. It provides a scalable infrastructure ideal for extensive networks. Arkime also offers packet indexing, which aids in faster retrieval.
List of key features for netsniff-ng and Arkime:
Netsniff-ng: Efficient packet capture, minimal system overhead.
Arkime: Large-scale analysis, packet indexing.
These tools serve niche requirements, emphasizing efficiency and scalability. Choosing the appropriate tool depends on the network's size and specific user needs.
How to Use a Linux Packet Sniffer: Step-by-Step Guide
Using a Linux packet sniffer involves several key steps. The process is simple yet requires attention to detail. First, ensure you have the necessary permissions to capture network traffic.
Understanding the commands and their syntax is crucial. You must decide on the tool based on your preferences. Let’s break down the process into manageable steps.
Begin with capturing packets on your network interface. This involves choosing the appropriate network card for monitoring. Once packets are captured, focus shifts to filtering.
Traffic filtering is essential for efficient analysis. It allows focus on relevant data amidst a sea of packets. Filter rules help isolate useful information quickly.
Capturing Packets
Start by capturing packets using your chosen sniffer. Identify the network interface that sees the traffic you need. Use a command to set this interface to promiscuous mode.
Setting your interface to promiscuous mode captures all packet data. This step is pivotal to ensure thorough data analysis. Once the interface is prepared, initiate packet capture.
Here's a basic example command for capturing packets:
tcpdump -i eth0 : Captures on interface eth0
wireshark : Launches the GUI for detailed analysis
Ensure capturing is active and monitor the initial results.

Filtering and Analyzing Traffic
Once packets are captured, filtering refines your analysis. Narrow down to specific protocols or addresses of interest. This step streamlines the inspection process significantly.
Implement filters through the sniffer’s interface or command line. Filtering reduces irrelevant data, making analysis efficient. Recognize essential filter commands and apply them judiciously.
Common filtering commands include:
tcpdump port 80 : Filters HTTP traffic
wireshark ip.src == 192.168.1.1 : Filters traffic by source IP
Effective filtering sharpens focus and saves time.

Saving and Exporting Data
Export data to preserve insights from your session. Choose a format that’s compatible and easy to access later. This step consolidates findings and is critical for reporting.
Tools typically offer options to save captured data. Formats like pcap are standard in the industry. Choose to export selected packets based on filtered insights.
Options for saving data include:
tcpdump -w capture.pcap : Saves as a pcap file
Export through Wireshark's 'File' menu
Secure your data for future reference and sharing.
Advanced Usage: Real-World Scenarios
Linux packet analyzers are versatile in real-world applications. They play a vital role in network security and performance evaluation. Professionals use them to address diverse networking challenges.
In cybersecurity, packet analyzers detect unauthorized access. They identify traffic anomalies that suggest possible intrusions. This detection aids in rapid incident response.
Network administrators use these tools to troubleshoot connectivity issues. Analyzers help pinpoint sources of latency and packet loss. This ensures networks run smoothly and efficiently.
The tools are also crucial in forensic investigations. Detailed packet logs reveal the sequence of events during breaches. This helps in tracing back to root causes.
Typical advanced use cases include:
Detecting Distributed Denial of Service (DDoS) attacks
Monitoring compliance with network policies
Investigating data breaches and violations
With real-time insights, packet analyzers address critical network concerns effectively.

Choosing the Best Packet Analyzer for Your Needs
Selecting the right packet analyzer depends on your specific requirements. Consider what features matter most for your tasks. Understanding your needs is the first step.
Evaluate whether you prefer a command-line interface or a graphical user interface. Some users find GUIs more intuitive. Others prefer the simplicity of command lines.
Assess the protocol support necessary for your environment. Comprehensive protocol compatibility broadens your analysis capabilities. Check if the analyzer supports your key protocols.
Also, consider the level of support and community behind the software. Open-source tools often have active communities for assistance and updates.
Points to consider when choosing:
User interface preference
Protocol support
Community and update frequency
By addressing these factors, you can ensure you pick the best tool for your network analysis needs.

Security, Ethics, and Legal Considerations
Using packet analyzers responsibly is crucial. They can intercept sensitive data. Ensure you have permission before monitoring any network.
Ethical use involves understanding the privacy implications. Legitimate purposes include network troubleshooting and security assessments. Avoid using sniffers for malicious intentions.
Legal aspects also play a role. Different regions have varying laws on network monitoring. Know the legal framework to stay compliant.
Key points to keep in mind:
Always obtain necessary permissions
Understand privacy concerns
Adhere to local laws and regulations
By following these guidelines, you'll respect privacy while leveraging powerful analysis tools effectively.
Tips for Effective Packet Analysis
Effective packet analysis requires a structured approach. Start by defining clear objectives. Know what you seek before diving into data.
Familiarize yourself with network protocols. This knowledge helps interpret packet data accurately. Be prepared to delve into packet headers and payloads.
Utilize available features of your chosen packet analyzer. Filter traffic to focus on relevant data. Regular practice enhances your skills over time.
Key tips to remember:
Establish clear analysis goals
Understand network protocols
Utilize filters effectively
By following these tips, you can conduct thorough and insightful packet analysis, improving network management and security.
Conclusion
Linux packet analyzers are indispensable tools for network professionals. They offer deep insights into network behavior and security.
Choosing the right tool and using it effectively enhances network health. Always remember to consider ethical and legal implications during analysis.
This guide equips you with the foundation to explore packet analyzers further.
0 notes
Text
#include <stdio.h>
#include <stdlib.h>
#include <pcap.h>
#include <string.h>
#include <netinet/ip.h>
#include <netinet/tcp.h>
#include <netinet/udp.h>
#define MAX_PAYLOAD_LEN 2048
// Dummy AI model (replace this with actual ML logic)
int is_abnormal_payload(const unsigned char *payload, int length) {
// Example heuristic: if the payload has too many repeated bytes, flag it
int score = 0;
for (int i = 1; i < length; i++) {
if (payload[i] == payload[i - 1]) score++;
}
return (score > 100) ? 1 : 0;
}
void process_packet(u_char *args, const struct pcap_pkthdr *header, const u_char *packet) {
struct ip *iph = (struct ip *)(packet + 14); // Ethernet header is 14 bytes
int iphdrlen = iph->ip_hl * 4;
if (iph->ip_p == IPPROTO_TCP) {
struct tcphdr *tcph = (struct tcphdr *)(packet + 14 + iphdrlen);
int tcphdrlen = tcph->th_off * 4;
const unsigned char *payload = packet + 14 + iphdrlen + tcphdrlen;
int payload_len = ntohs(iph->ip_len) - iphdrlen - tcphdrlen;
if (payload_len > 0 && payload_len < MAX_PAYLOAD_LEN) {
printf("TCP Packet from %s\n", inet_ntoa(iph->ip_src));
// Call AI model
int alert = is_abnormal_payload(payload, payload_len);
if (alert) {
printf("[alert] Abnormal activity detected!\n");
FILE *log = fopen("ai_firewall_alerts.log", "a");
if (log) {
fprintf(log, "Suspicious packet from %s:%d\n",
inet_ntoa(iph->ip_src), ntohs(tcph->th_sport));
fclose(log);
}
}
}
}
}
int main() {
char errbuf[PCAP_ERRBUF_SIZE];
pcap_t *handle = pcap_open_live("eth0", 65535, 1, 1000, errbuf);
if (!handle) {
fprintf(stderr, "Could not open device: %s\n", errbuf);
return 1;
}
printf("AI-enhanced pkt firewall running...\n");
pcap_loop(handle, -1, process_packet, NULL);
pcap_close(handle);
return 0;
}
0 notes
Text
Monitoring and Logging Tips for Your Application Load Balancer
Monitoring and logging are crucial for maintaining the performance, availability, and security of your Application Load Balancer (ALB). By implementing effective monitoring and logging strategies, you can gain real-time insights into traffic patterns, detect anomalies, troubleshoot issues faster, and ensure compliance. With tools like HPE’s ALB monitoring capabilities, logs provide visibility into request behavior, latency, and error rates. These insights help DevOps teams make data-driven decisions and proactively address potential problems. In this post, we’ll share essential tips for optimizing your monitoring and logging setup to improve the reliability and efficiency of your application load balancing infrastructure.
Layer of Operation OSI Model Differences Application Load Balancers
The fundamental difference between NLB and ALB lies in the OSI model layer at which they operate.Application Load Balancers function at,handling TCP, UDP, and TLS traffic with high speed and low latency. In contrast, Application Load operate at,allowing for more intelligent routing decisions based on content such as headers, paths, and cookies. This key distinction determines how traffic is analyzed and distributed, with NLB being ideal for performance-critical tasks and ALB being better suited for content-based routing and web application delivery.
Routing Capabilities and Flexibility Application Load Balancers
Application Load Balancers provide advanced routing capabilities, making them ideal for microservices and containerized applications. They can inspect the content of incoming traffic and route it based on rules involving hostnames, URL paths, and request methods. This enables developers to direct specific requests to designated backend services easily. On the other hand,Network Load Balancers offer basic routing by distributing traffic purely based on IP protocol data and port numbers, which limits their flexibility. If your environment requires sophisticated routing logic, such as directing mobile traffic differently from desktop, ALB offers the granularity and control needed.
Performance and Latency Application Load Balancers
When it comes to raw performance and handling high volumes of traffic with minimal latency, Network Load Balancers have a clear advantage. Since they operate at a lower network layer, they process packets faster and can scale to handle millions of requests per second, making them suitable for latency-sensitive and high-throughput applications like real-time gaming or financial trading platforms. Application Load Balancers, while still capable, introduce slightly more latency due to deeper traffic inspection and rule evaluation at the application layer. Therefore, if speed is your top priority, especially at scale, NLB is often the preferred choice.
Health Checks and Monitoring Application Load Balancers
Both NLB and ALB support health checks, but their implementations differ significantly. Application Load Balancers offer more advanced health checks that evaluate or responses, such as checking specific status codes or content within responses. This enables ALBs to make intelligent decisions about backend availability. Network Load Balancers, by contrast, use TCP-level health checks that verify only if a connection can be established, without assessing service responsiveness. If your application needs granular monitoring of backend health and service-level behavior, ALB provides more detailed insights, making it better suited for modern web services with dynamic content.
SSL/TLS Termination and Security Application Load Balancers
Application Load Balancers natively support SSL/TLS termination, allowing them to decrypt encrypted traffic and apply routing rules based on application content before re-encrypting it for backend delivery. This is ideal for applications requiring deep inspection of secure traffic or integration with WAF (Web Application Firewall) solutions. Network Load Balancers can also handle TLS termination but often rely on external mechanisms or use passthrough mode for performance, where encrypted traffic is forwarded directly to targets. While both can support secure communication, ALBs offer more control over certificate management, security policies, and compliance with application-layer encryption needs.
Cost Considerations and Resource Usage Application Load Balancers
Cost is a crucial factor when selecting a load balancer. Network Load Balancers typically incur lower compute overhead and are more cost-efficient for high-performance use cases, especially when SSL termination and advanced routing are not required. Application Load Balancers, while offering richer features, generally cost more due to their higher-level processing capabilities and resource consumption. Organizations should weigh the trade-off between feature richness and operational cost. For simple traffic distribution with minimal logic, NLB offers a budget-friendly option, while ALB is ideal for applications that demand intelligent routing, content inspection, and fine-grained access controls.
Use Cases and Deployment Scenarios Application Load Balancers
Choosing between NLB and ALB often comes down to specific application requirements. Network Load Balancers excel in scenarios requiring extreme speed and resilience such as IoT, gaming servers, and legacy applications using non-HTTP protocols. They are ideal for situations where low latency and raw power are critical. On the other hand, Application Load Balancers are tailored for modern web apps, REST APIs, and microservices where HTTP/S routing and request-level logic are essential. They shine in environments needing flexibility, such as dynamic web hosting, multi-tenant SaaS apps, or container orchestration platforms like Kubernetes and ECS with path-based routing.
Conclusion
Understanding the key differences between a Network Load Balancer and an Application Load Balancer is essential for selecting the right solution for your infrastructure. NLBs operate at the transport layer and are designed for high-performance, low-latency routing of TCP/UDP traffic, making them ideal for handling large volumes of network traffic. In contrast, ALBs function at the application layer,providing advanced routing based on content, URL, and headers perfect for web applications and microservices. Choosing between them depends on your specific use case, performance needs, and the level of routing control required.
0 notes
Text
How an Application Load Balancer Enhances Web Performance?
An application load balancer is essential for optimizing web performance by intelligently distributing traffic across multiple servers, ensuring no single server becomes overwhelmed. This distribution enhances response times and minimizes latency, providing users with a seamless experience. Edgenexus Limited specializes in advanced load balancing solutions that incorporate features like SSL offloading and content-based routing, which not only improve speed but also bolster security. By offloading tasks such as SSL decryption, the load balancer reduces the processing burden on backend servers, allowing them to handle application logic more efficiently. Additionally, continuous health monitoring ensures that traffic is directed only to healthy servers, maintaining high availability and reliability. Implementing an application load balancer is a strategic move to enhance scalability, performance, and user satisfaction.
Distributing Traffic Efficiently to Prevent Server Overload
An application load balancer excels at distributing incoming HTTP and HTTPS requests across multiple targets in one or more Availability Zones, ensuring no single server is overwhelmed. By using algorithms such as round robin, least connections, and IP hash, it intelligently routes sessions to the best available instance, balancing load and maximizing throughput. This even distribution minimizes response time variance and prevents performance degradation during peak periods. In turn, backend servers maintain optimal CPU and memory utilization, reducing the risk of slowdowns or crashes under heavy traffic. Incorporating an application load balancer into your architecture is a proactive step toward consistent, high-performing web experiences.
Offloading SSL/TLS Processing to Improve Server Efficiency
Offloading SSL/TLS encryption and decryption to an application load balancer removes a significant processing burden from your web servers, accelerating request handling and reducing CPU usage. Dedicated hardware or optimized software on the load balancer handles cipher negotiation and session management, allowing backend servers to allocate resources to application logic rather than cryptographic operations. This setup not only improves response times but also simplifies SSL certificate management by centralizing termination points. With modern ciphers and protocols updated at the load balancer, security remains robust without compromising performance.
Leveraging Path-Based Routing for Targeted Request Handling
Path-based routing is a key feature of an application load balancer, directing traffic based on URL patterns to specific microservices or application tiers. For example, image requests can route to a dedicated media server, while API calls go to compute-optimized instances. This separation optimizes resource usage and enhances scalability by tailoring infrastructure to distinct workloads. As traffic grows or shifts, the application load balancer dynamically adjusts routing rules, ensuring each service receives only its intended share of requests. The result is a more responsive and resilient application architecture.
Reducing Latency with HTTP/2 and Connection Multiplexing
HTTP/2 support in an application load balancer reduces latency by enabling multiplexed streams over a single TCP connection, cutting down on handshake overhead and packet count. Header compression minimizes data transfer, while server push capabilities preemptively send resources, speeding up page loads. By transitioning user sessions seamlessly to HTTP/2, the load balancer leverages modern web standards to deliver faster, smoother experiences, especially over high-latency networks. This significant performance improvement is crucial for global applications where milliseconds can make or break user engagement.
Ensuring High Availability with Continuous Health Checks
Continuous, application-layer health checks are integral to an application load balancer’s ability to maintain high availability. By regularly probing endpoints for responsiveness and correctness, the load balancer automatically reroutes traffic away from unhealthy or overloaded targets, preventing downtime. Health checks can be customized for URL paths, response codes, or TCP connections, allowing precise control over what constitutes a healthy instance. This dynamic rerouting fosters a self-healing environment, where only fit servers serve production traffic, bolstering reliability under all conditions.
Integrating Auto-Scaling for Dynamic Capacity Management
Pairing an application load balancer with auto-scaling mechanisms enables seamless scaling of backend resources based on real-time metrics such as CPU load, memory usage, or request count. When demand surges, new instances register automatically with the load balancer, distributing traffic evenly and preventing bottlenecks. Conversely, during off-peak hours, unneeded servers are gracefully drained and removed, optimizing cost efficiency without sacrificing performance. This elastic capacity management ensures that your application remains responsive and cost-effective, adapting to traffic fluctuations with minimal manual intervention.
Strengthening Security While Maintaining Performance
An application load balancer enhances security by centralizing SSL/TLS termination, enforcing strict cipher policies, and supporting features like AWS Web Application Firewall (WAF) integration to filter malicious traffic. DDoS mitigation techniques such as SYN cookies and rate limiting can be applied at the edge, protecting backend servers from volumetric attacks. At the same time, performance features like HTTP compression and TCP buffering reduce data transfer and optimize throughput. By combining robust security controls with advanced load-balancing capabilities, businesses achieve both resilience and speed.
Conclusion
An application load balancer is a pivotal component in modern IT architectures, delivering optimized traffic distribution, reduced latency, and high availability. By leveraging SSL offloading, path-based routing, HTTP/2 support, and continuous health checks, organizations can ensure that web applications perform reliably under varied loads. Integration with auto-scaling and security tools further enhances resilience and cost efficiency. With Edgenexus Limited’s expertise in IT services and consulting, businesses can deploy tailored application load balancer solutions that meet both performance and security objectives. Investing in this technology is a strategic move to elevate user experience, maintain operational continuity, and support sustainable growth.
0 notes
Text


the cruel prince (jurdan) headers. like/reblog if you save or use. 👑
art by @illustratinghan
#jurdan#jurdan header#jurdan headers#the cruel prince#the cruel prince header#the cruel prince headers#the queen of nothing#tcp headers#tcp header#tcp#booktwt#bookstan#booktwitter#book headers#book quotes#jude duarte header#jude duarte headers#jude duarte#cardan greenbriar header#cardan header#cardan headers#cardan greenbriar#jude x cardan#prince cardan
177 notes
·
View notes
Text
Boost Website Speed with Next-Gen Protocols: A Guide to HTTP/2 and HTTP/3
In today’s digital world, speed is more than just a luxury—it’s a necessity. A website that loads slowly can lose visitors in seconds. That’s why modern protocols like HTTP/2 and HTTP/3 have become essential for businesses aiming to deliver a faster, smoother online experience. These protocols are built to enhance how browsers and servers communicate, making websites load quicker and perform better, especially on mobile networks.
Understanding HTTP/2 and HTTP/3
HTTP/2 was introduced to solve the limitations of the traditional HTTP/1.1. It allows multiplexing, which means multiple resources can load at once over a single connection. This reduces the delay of loading one file after another. HTTP/3 goes even further by using a protocol called QUIC, which is designed to minimize delays, even on unstable networks.
By switching to these modern protocols, your site can load images, CSS files, and JavaScript much faster. This improves user experience, especially for mobile users and global audiences who expect speed and stability.
Why Speed is a Game-Changer
Fast-loading websites keep users engaged and reduce bounce rates. A delay of just a few seconds can result in lost traffic and lower conversions. For businesses, especially eCommerce platforms, poor loading speed can directly affect revenue. Mobile users, who often operate on slower connections, are less likely to stay on sluggish websites.
Many companies now choose to work with the best web development agencies in India to ensure their websites are not only beautifully designed but also optimized for performance. These agencies offer the right mix of design, development, and technical know-how to implement protocols like HTTP/2 and HTTP/3 effectively.
Key Benefits of HTTP/2
Here’s how HTTP/2 helps improve performance:
Multiplexing: Multiple files are downloaded simultaneously, avoiding the delay of sequential loading.
Server Push: Resources can be sent to the browser before it even requests them, speeding up the process.
Header Compression: HTTP headers are compressed to reduce the amount of data sent, resulting in faster transmission.
Together, these features enhance website responsiveness and provide a noticeable performance boost.
What Makes HTTP/3 More Advanced
HTTP/3 builds upon HTTP/2 by replacing the traditional TCP protocol with QUIC, which uses UDP. This upgrade offers even better performance, particularly in handling poor network conditions.
Key features include:
Lower Latency: Reduced lag during data transfer, especially beneficial for mobile users.
Improved Data Recovery: QUIC can quickly retransmit lost data without slowing down the entire connection.
Stream Prioritization: Essential files can be prioritized so that they load first, improving usability.
HTTP/3 is ideal for content-heavy websites and applications that require fast loading regardless of location or device.
How to Get Started
You don’t need to rebuild your website to take advantage of these protocols. Most modern web servers, like Apache and Nginx, already support HTTP/2. HTTP/3 may require server updates or support from your hosting provider. Using a Content Delivery Network (CDN) can also help deliver your content faster worldwide.
To measure the impact, tools like Google PageSpeed Insights or WebPageTest can evaluate your current performance and show whether these protocols are active.
Not comfortable making these changes on your own? That’s where the best web development agencies in India come in. These experts can analyze your website, recommend suitable enhancements, and implement the right technologies to keep your website running fast and efficiently.
Final Thoughts
Adopting HTTP/2 and HTTP/3 is more than just a technical improvement—it’s a smart move for anyone serious about website performance. Faster load times lead to better user experiences, stronger SEO rankings, and increased business success.
For businesses looking to stay ahead in the competitive online space, working with professionals to implement these protocols is a smart step forward. In the end, it’s all about making your website faster, smarter, and more future-ready.
#best web development agencies india#website design and development company in india#website development company in india#web design company india#website designing company in india#digital marketing agency india
0 notes
Text
Understanding Protocol Data Units (PDUs): The Building Blocks of Network Communication

In the realm of computer networking, the term Protocol Data Unit (PDU) is fundamental. PDUs are the structured units of data transmitted across networks, encapsulating both control information and user data. Grasping the concept of PDUs is essential for anyone involved in network design, analysis, or troubleshooting.
What is a Protocol Data Unit (PDU)?
A Protocol Data Unit (PDU) is the smallest unit of data exchanged between entities in a network, defined by the specific protocol governing the communication. Each layer of the OSI (Open Systems Interconnection) model utilizes PDUs to encapsulate data appropriately for its function.
For instance:
Layer 4 (Transport Layer): The PDU is called a segment (TCP) or datagram (UDP).
Layer 3 (Network Layer): The PDU is a packet.
Layer 2 (Data Link Layer): The PDU is a frame.
Layer 1 (Physical Layer): The PDU is a bit or symbol.
This hierarchical structuring ensures that data is transmitted efficiently and accurately across diverse network architectures.
Structure of a PDU
A typical PDU comprises two main components:
Header: Contains control information such as source and destination addresses, error-checking codes, and sequencing details.
Payload: The actual data being transmitted, which could be a message, file, or any other form of user data.
This structure allows each network layer to add its specific control information, facilitating proper data handling and routing.
PDUs in the OSI Model
Understanding how PDUs function within the OSI model provides clarity on data transmission processes:
Application Layer (Layer 7): Data
Presentation Layer (Layer 6): Data
Session Layer (Layer 5): Data
Transport Layer (Layer 4): Segment
Network Layer (Layer 3): Packet
Data Link Layer (Layer 2): Frame
Physical Layer (Layer 1): Bit
Each layer encapsulates the PDU from the layer above, adding its header (and sometimes trailer) to manage its specific responsibilities, such as routing, error detection, or flow control.
Importance of PDUs in Network Communication
PDUs play a critical role in ensuring reliable and organized data transmission:
Encapsulation: Each layer's PDU encapsulates the data from the upper layer, adding necessary control information.
Modularity: This layered approach allows for modular network design, where each layer operates independently.
Interoperability: Standardized PDU structures enable devices from different manufacturers to communicate effectively.
Protocol Parsing and PDUs
Parsing PDUs is essential for network analysis and troubleshooting. Tools like Wireshark dissect PDUs to reveal their headers and payloads, allowing network professionals to:
Diagnose Issues: Identify where communication failures occur.
Optimize Performance: Analyze traffic patterns and optimize data flow.
Ensure Security: Detect anomalies or malicious activities within network traffic.
For a comprehensive guide on protocol parsing, refer to Keploy's Protocol Parsing Guide, which delves into techniques for transforming raw packets into structured, analyzable data.
Leveraging Keploy for Protocol Analysis
Keploy offers advanced tools for developers and testers to simulate and analyze network interactions. By capturing and replaying PDUs, Keploy enables:
Automated Testing: Validate application behavior under various network conditions.
Mocking Services: Simulate external services for isolated testing environments.
Enhanced Debugging: Reproduce and analyze specific network scenarios to identify issues.
Integrating Keploy into your development workflow can streamline testing processes and improve application reliability.
Conclusion
Protocol Data Units are the fundamental elements of network communication, providing structure and organization to data transmission. Understanding PDUs and their role within the OSI model is crucial for network professionals. Tools like Keploy enhance this understanding by offering practical solutions for protocol parsing and analysis, ultimately contributing to more robust and efficient networked applications. For further reading and resources, explore Keploy's official documentation and community blog.
0 notes
Text
How to Improve Website Speed with HTTP/2 and HTTP/3
Modern websites require speed and stability. HTTP/2 and HTTP/3 are protocols designed to improve communication between your browser and the server. They work better than the older HTTP/1.1 protocol by allowing more efficient data transfer, which means pages load faster and users spend less time waiting for content to appear.
What Are HTTP/2 and HTTP/3?
HTTP/2 was introduced to address the limitations of the older HTTP/1.1. It enables multiplexing, which means multiple files can be transferred simultaneously instead of sequentially. This reduces the waiting time because you do not have to load each file one after the other. HTTP/3 builds on this by using a protocol called QUIC. QUIC is designed to minimize latency further and improve reliability, even when network conditions are not ideal.
The switch to these protocols helps reduce delays that frustrate users and can hurt business. For example, with HTTP/2 and HTTP/3, images, scripts, and stylesheets can be loaded concurrently. This improves the overall user experience on both desktop and mobile devices.
Why Website Speed Matters
A faster website holds visitor attention and keeps them engaged with your content. Slow load times can lead to high bounce rates and lower search engine rankings. Visitors may leave if pages take too long to load. Today, more people are accessing websites on mobile devices. Mobile users, in particular, expect a smooth experience. Slow performance also affects conversion rates for eCommerce sites and impacts overall revenue.
Improving speed is a major factor for competitive online presence. This is why many businesses seek professional help. Many firms turn to a best web development agencies in India because they understand both design and performance, which is crucial in today’s market.
Key Improvements in HTTP/2
HTTP/2 offers several enhancements:
Multiplexing
Multiple streams are allowed over a single connection. Instead of waiting for one resource to load before starting the next, all resources are loaded simultaneously. This parallel loading reduces delay.
Server Push
HTTP/2 permits the server to send resources it knows the client will need without waiting for a request. This proactive approach speeds up the overall process.
Header Compression
The protocol compresses HTTP headers, which are transmitted with every request. Smaller header sizes mean less data is sent between the client and the server, reducing the load time.
All of these factors contribute to a more efficient transfer of resources. This means pages appear faster, which can help increase user satisfaction and improve search rankings.
What Makes HTTP/3 Different
HTTP/3 takes the improvements from HTTP/2 and pushes them further. It uses the QUIC protocol instead of TCP. QUIC is designed for faster recovery from lost data packets. The switch to UDP-based QUIC means that even under poor network conditions, HTTP/3 maintains high performance.
Reduced Latency
The QUIC protocol reduces the delay experienced during data transmission, especially on mobile networks. This is vital for websites that serve a global audience.
Improved Reliability
HTTP/3 handles packet loss better. When packets are lost, QUIC can retransmit data quickly without significantly delaying the whole connection.
Stream Prioritization
Like HTTP/2, HTTP/3 allows you to prioritize certain resources. This means that the most important content can be loaded first, making the site usable more quickly.
Together, these features make HTTP/3 suitable for content-heavy websites and applications that require robust performance no matter where the user is located.
How to Implement These Protocols
Implementing HTTP/2 and HTTP/3 usually does not require a complete overhaul of your website. Most modern web servers, such as Apache and Nginx, support HTTP/2 out of the box. For HTTP/3, you may need to update your server or work with your hosting provider to ensure compatibility. Content delivery networks (CDNs) also support these protocols, and using a CDN can help speed up content delivery across different regions.
It is wise to test your website’s performance using tools like Google PageSpeed Insights or WebPageTest. These tools can tell you whether the protocol is working correctly and suggest further optimizations if necessary.
If you find the technical side challenging, partnering with a trusted best web development agencies in India can help. Their expertise ensures that your website is not only visually appealing but also performs well by utilizing the latest protocols and techniques. They can conduct a thorough analysis and implement changes that suit your site’s specific needs.
Conclusion
Switching to HTTP/2 and HTTP/3 can lead to a significant improvement in website speed. These protocols reduce load times and create smoother experiences for users by allowing multiple resources to load simultaneously, pushing necessary files proactively, and compressing data effectively. Faster pages contribute to increased visitor engagement, higher search engine rankings, and improved business outcomes.
For developers and website owners, embracing these protocols is essential. It is one of the many ways to keep your website competitive in a crowded online space. Whether you are handling high traffic or require robust performance for mobile users, HTTP/2 and HTTP/3 are important tools.
Taking these steps ensures that your website remains fast and efficient. As more users expect speedy experiences, making the switch is not just a technical upgrade; it is a crucial part of staying relevant in today’s digital market.
#website development company in india#web design company india#website designing company in india#best web development agencies india#digital marketing agency india#online reputation management companies in india
0 notes
Text
How Alltick’s WebSocket API Crushes REST for High-Frequency Crypto Trading
How Alltick’s WebSocket API Crushes REST for High-Frequency Crypto Trading
The $4,300 Latency Tax
On May 12, 2024, Bitcoin surged 9% in 37 seconds following a false ETF approval rumor. Traders using REST APIs saw prices update 3.2 seconds late—enough time for the market to move 4,300perBTC∗∗beforetheirordersexecuted.Meanwhile,∗∗AlltickWebSocketusers∗∗capturedtherallyfromthefirsttick,banking∗∗4,300perBTC∗∗beforetheirordersexecuted**.Meanwhile,∗∗AlltickWebSocketusers∗∗capturedtherallyfromthefirsttick,banking∗∗1.2M in under a minute**.
This isn’t luck—it’s physics. REST APIs are obsolete for real-time trading, and in this guide, we’ll dissect:
Why REST fails (with packet-level analysis)
How WebSockets dominate (benchmark data)
Step-by-step migration (REST → WebSocket in <50 lines of code)
REST vs. WebSocket – A Network-Level Showdown
Problem 1: Polling Delays (The "Refresh Button" Dilemma)
How REST Works: Your bot sends HTTP requests every 1-5 seconds, begging exchanges for updates.
Coinbase rate limits: 10 requests/second (bursts get banned).
Binance polling lag: 800ms median delay during volatility.
Real-World Impact:
May 2024 BTC Flash Pump: REST traders missed the first 4,200 orders because their last poll was 2.9 seconds old.
Problem 2: Data Inefficiency (90% Useless Traffic)
REST Responses Include:json复制{ "timestamp": "2024-05-20T12:00:00.000Z", "bids": [[ "30000.00", "1.2" ]], // Only this changes "asks": [[ "30001.00", "0.8" ]], "status": "ok", // Repeated every request "exchange": "binance" // Wasted bytes }
Result: 92% of REST payloads are redundant headers and metadata.
WebSocket Fix:json复制{ "b": [["30000.00", "1.2"]], "a": [["30001.00", "0.8"]] } // 12 bytes vs. 300+
Problem 3: Connection Overhead (TCP Handshake Hell)
REST Penalty: Each request requires:
TCP handshake (1 roundtrip)
TLS negotiation (2 roundtrips)
HTTP request/response (1 roundtrip)
Total latency: 200-400ms per poll even on fiber.
WebSocket Advantage:
Single connection stays open.
Zero handshakes after initial setup.
Persistent compression (e.g., permessage-deflate). Get started today: [alltick.co]
0 notes
Text
Application Load Balancer vs Network Load Balancer: Key Differences Explained
Application Load Balancers (ALBs) and Network Load Balancers (NLBs) serve distinct purposes in traffic management. ALBs operate at Layer 7 (Application Layer), making routing decisions based on content such as HTTP headers, methods, paths, and query parameters. This allows for advanced routing strategies, SSL termination, and sticky sessions, making them ideal for modern web applications and microservices architectures. In contrast, NLBs function at Layer 4 (Transport Layer), handling TCP, UDP, and TLS traffic. They excel in managing high-throughput, low-latency traffic and are suitable for applications requiring extreme performance, such as gaming or real-time data processing. Edgenexus Limited provides comprehensive insights into these differences, aiding businesses in selecting the appropriate load balancing solution based on their specific application requirements.
Enhancing Application Performance with Advanced Load Balancing Solutions
In today's digital landscape, ensuring optimal application performance is crucial for business success. Edgenexus Limited offers advanced load balancing solutions that intelligently distribute traffic across servers, preventing overload and minimizing latency. This approach enhances user experience by ensuring fast and reliable access to applications, even during peak traffic periods. By implementing Edgenexus Limited's application load balancer, businesses can achieve seamless scalability and maintain high availability, which are essential for meeting the demands of modern users.
Strengthening Security Posture with Integrated Web Application Firewalls
Protecting applications from evolving cyber threats is a top priority for organizations. Edgenexus Limited addresses this need by integrating robust Web Application Firewalls (WAF) into their load balancing solutions. These WAFs provide comprehensive protection against common vulnerabilities and attacks, ensuring that only legitimate traffic reaches your applications. By incorporating Edgenexus Limited's application load balancer with integrated WAF, businesses can safeguard sensitive data and maintain compliance with industry security standards.
Achieving Global Scalability with Geo-Location Based Load Distribution
As businesses expand globally, delivering consistent application performance across different regions becomes challenging. Edgenexus Limited's application load balancer offers geo-location-based load distribution, directing users to the nearest or best-performing data center. This feature reduces latency and enhances user satisfaction by providing faster access to applications, regardless of geographic location. Implementing this solution enables businesses to offer a consistent and responsive experience to their global user base.
Simplifying IT Infrastructure Management with Unified Application Delivery Controllers
Managing complex IT infrastructures requires efficient tools that streamline operations. Edgenexus Limited's Application Delivery Controllers (ADC) consolidate multiple functions, including load balancing, security, and traffic management, into a single platform. This unification simplifies deployment and reduces the operational overhead associated with managing separate solutions. By utilizing Edgenexus Limited's ADCs, businesses can achieve greater control over their application delivery processes, leading to improved efficiency and reduced costs.
Accelerating Application Delivery with SSL Offload and Content Optimization
Secure Sockets Layer (SSL) encryption is essential for protecting data in transit but can introduce performance overhead. Edgenexus Limited's application load balancer addresses this by offloading SSL processing from application servers, freeing them to handle business logic more efficiently. Additionally, features like content caching and compression optimize data delivery, further enhancing application speed. By leveraging these capabilities, businesses can provide secure and fast application experiences to their users.
Ensuring High Availability and Disaster Recovery with Global Server Load Balancing
Maintaining application availability during server failures or site outages is critical for business continuity. Edgenexus Limited's Global Server Load Balancing (GSLB) solution distributes traffic across multiple data centers, providing failover capabilities and disaster recovery. In the event of a site failure, GSLB automatically redirects traffic to healthy sites, minimizing downtime and ensuring uninterrupted access to applications. This feature is vital for businesses that require constant application availability and resilience.
Facilitating Seamless Cloud Integration with Multi-Cloud Load Balancing Support
As organizations adopt multi-cloud strategies, managing application delivery across different cloud environments becomes complex. Edgenexus Limited's application load balancer supports multi-cloud load balancing, enabling seamless distribution of traffic across various cloud platforms. This capability allows businesses to optimize resource utilization, enhance performance, and avoid vendor lock-in. By integrating Edgenexus Limited's load balancing solutions, organizations can achieve flexibility and efficiency in their cloud deployments.
Conclusion
Edgenexus Limited's application load balancer offers a comprehensive suite of features designed to enhance application performance, security, and availability. By integrating advanced load balancing, security measures, global scalability, and cloud support, businesses can deliver superior application experiences to their users. Embracing these solutions enables organizations to navigate the complexities of modern IT environments, ensuring that applications are fast, secure, and always available. Partnering with Edgenexus Limited equips businesses with the tools needed to thrive in a competitive digital landscape.
0 notes