
Don't wanna be here? Send us removal request.
Statistics
We looked inside some of the posts by sasexplorerwu and here's what we found interesting.
Average Info
Notes Per Post
128
Likes Per Post
113
Reblog Per Post
13
Reply Per Post
2
Time Between Posts
15 days
Number of Posts By Type
Photo
17
Last Seen Tumblr Blogs


Fun Fact
69% of Tumblr users are millennials.
Photo

Me mat madhin nven… (ved Ela As) https://www.instagram.com/p/CgphYrrIAnd/?igshid=NGJjMDIxMWI=
9 notes
·
View notes
Photo

I have experienced both, what about you?! (ved Oslo, Norway) https://www.instagram.com/p/Cdvs8NNoTi1/?igshid=NGJjMDIxMWI=
11 notes
·
View notes
Photo

“I strongly believe that all managers in a technical area must be technically excellent. Managers in software must write great software or it’s like being a cavalry captain who can’t ride a horse!” - Elon Musk (ved Ela As) https://www.instagram.com/p/CdbnK7doeg5/?igshid=NGJjMDIxMWI=
3 notes
·
View notes
Photo

💡SQL is a must-know for anyone working in the data industry. Here’s how you can learn it from scratch: https://hubs.la/Q018-bgG0 Source: @data_science_dojo Follow for more: @elaanalytics #DataScience #SQL #Guide #analytics #data (ved Ela As) https://www.instagram.com/p/Cc6r6KEoy0o/?igshid=NGJjMDIxMWI=
37 notes
·
View notes
Photo

Twitter's board has accepted Elon Musk's offer to buy the social media platform for $44 billion and take it private, in what could be one of the biggest-ever leveraged buyouts of a publicly-listed company. It’s a dramatic turn of events: When the Tesla CEO unveiled his unsolicited bid 11 days ago, the social media platform appeared certain to reject it, even adopting a "poison pill" defense to ward off a hostile takeover. But Twitter started to warm up to the offer after the billionaire disclosed that he’d secured $46.5 billion in financing. #twitter #elonmusk #acquisition #tesla (ved Oslo, Norway) https://www.instagram.com/p/CcyY9CYoMLH/?igshid=NGJjMDIxMWI=
8 notes
·
View notes
Photo

Business Intelligence Solutions Decision Tree Get Full Information Here@ https://lnkd.in/dZDPy9E5 Visualization and collaboration-> Power BI is a set of tools for self-service and traditional business intelligence, which uses tabular analytical models, allows to build interactive reports and dashboards, and features mobile reports, collaboration and application embedding. Power BI Mobile is a set of free Windows, iOS, and Android applications allowing to view and explore personalized dashboards and reports created in Power BI Service. Also it allows users to be up-to-date with data-driven alerts. Power BI Desktop is a visual data exploration tool for data analysis and reports creation. It allows to load multiple data sources, establish data structure, transform, create analytical tabular model, visualize and explore data in interactive way, and also publish to Power BI Service. #analytics #datamining #dataanalysis #visualization #businessintelligence #powerbi #data Follow @elaanalytics for more… https://www.instagram.com/p/CcwEHycISiR/?igshid=NGJjMDIxMWI=
6 notes
·
View notes
Photo
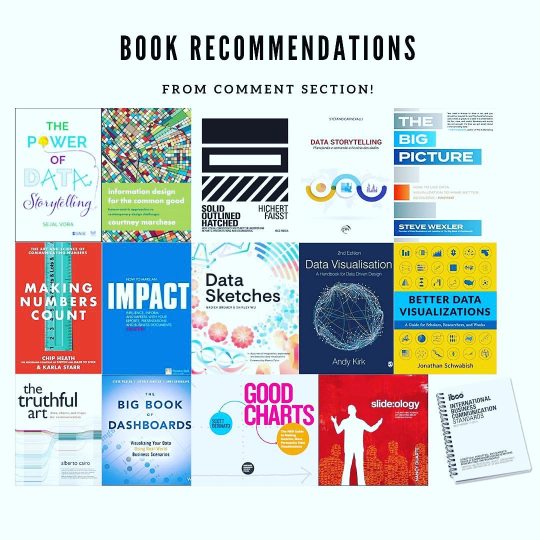
Consolidated all book recommendations from the comment section of my previous post! 😊 I’ve not read all of these BUT some of them are already on it’s way to me! For my personal recommendation, you can refer to my previous post below. https://lnkd.in/gAwVWtkR Book List: The Power of Data Story Telling by Sejal Vora Information Design for the Common Good by Courtney Marchese Solid Outlined Hatched by Rolf Hichert and Jürgen Faisst Data Storytelling, planejando e contando a história de dados by Stéfano Carnevalli The Big Picture" by Steve Wexler The Big Book of Dashboards by Steve Wexler Making Numbers Count: The Art and Science of Communicating Numbers by Chip Heath and Karla Starr Impact by Jon Moon Data Sketches byNadieh Bremer, Shirley Wu Data Visualisation by Andy Kirk Better Data Visualizations by Jonathan Schwabish The Truthful Art by Alberto Cairo Good Charts: The HBR Guide to Making Smarter, More Persuasive Data Visualizations by Scott Berinato slide.ology by Nancy Duarte IBCS – International Business Communication Standards #storytellingwithdata #storytelling #dataanalytics #dataanalyst #businessintelligence #datastorytelling #bookrecommendations https://www.instagram.com/p/CZhHQmaIvmw/?utm_medium=tumblr
#storytellingwithdata#storytelling#dataanalytics#dataanalyst#businessintelligence#datastorytelling#bookrecommendations
11 notes
·
View notes
Photo

When designing great #PowerBI reports, it is vital to gather good requirements. One thing we need to identify is the correct audience. In addition to this, however, is the need to understand how they will use them. This addresses both the who and the how of the reports. We need to know how reports are intended to be used to design the correct report to suit this need. While there are many use cases, here are some of the most common report types This helps us show the #data in a helpful way. ⚡Structured Top-Down A Structured Top-Down report is one of the most common report types. This is a "drill-down" style report. To create a Structured Top-Down, follow the pattern: -Start with high level KPIs to show if they're on or off target. -Next show the trends - are the KPIs improving or getting worse over time. -Finally, show the breakdowns. Which areas are on or off target? ⚡Goal Based KPIs Goal Based KPI reports are designed to track against specific objectives. These could be company or department targets. A good example would be a goal of reducing customer churn by 5% in the next quarter. Goal Based KPI reports should show all information needed to diagnose if this goal is on target - and if not how to correct it. These need to be focused - information not related to the goal should not be included. ⚡Analyst Exploratory While the first two report types are specific and focused, sometimes we want to explore data to find new insights. Analyst Exploratory reports are designed to do just this. KPIs need to be sliced and decided in a whole array of different ways. Customisable visuals, QnA, or allowing a range of drill down will help in this report type. ELA Analytics AS #analytics #powerbi #dataanalytics https://www.instagram.com/p/CZKul1boEnT/?utm_medium=tumblr
0 notes
Photo

Interesting perspective on data relevance and the importance of missing data. For more, follow me and my company: @elaanalytics #data #datascience #dataengineering #insights (ved Oslo, Norway) https://www.instagram.com/p/CZFRpDqoH52/?utm_medium=tumblr
17 notes
·
View notes
Photo

Mission @elaanalytics @numus_as @elabedrift https://www.instagram.com/besiminst/p/CYmtfv_IZ7F/?utm_medium=tumblr
7 notes
·
View notes
Photo

Great visualization of passing by reference vs. passing by value. Pass by value: Passing by value means that the value of the function parameter is copied into another location of your memory, and when accessing or modifying the variable within your function, only the copy is accessed/modified and the original value is left untouched. Passing by value is how your values are passed on most of the time. Pass by reference: Passing by reference means that the memory address of the variable (a pointer to the memory location) is passed to the function. Thanks for the original creator : https://lnkd.in/dSwZxMGh #visualization https://www.instagram.com/besiminst/p/CYd6aERIC3I/?utm_medium=tumblr
0 notes
Photo

Global GDP 2021 map. US & China account for 42%. I wonder what this map looks like in 20, 50, 100 years. No matter what, we are one humanity. Life on Earth is not a zero-sum game. We can win together through innovation & compassion, but a little friendly competition is good too. https://www.instagram.com/p/CYcWtdFod68/?utm_medium=tumblr
3 notes
·
View notes
Photo

Advanced Secrets Of Quantitative Funds (Hedge Funds) — Utilizing Back Tests: bit.ly/3wTZIzP ———— #abdsc #quant #fintech #BigData #DataScience #MachineLearning #AlgorithmicTrading #trading (ved Oslo, Norway) https://www.instagram.com/p/CWy86UioO__/?utm_medium=tumblr
0 notes
Photo

I have never seen better example… Do you agree? #softwaredevelopment #frontend #backend #api #fullstack #programming #coding @elaanalytics @elabedrift @numus_as (ved Oslo, Norway) https://www.instagram.com/p/CWiX9ciInmD/?utm_medium=tumblr
11 notes
·
View notes
Photo

𝐌𝐚𝐜𝐡𝐢𝐧𝐞 𝐋𝐞𝐚𝐫𝐧𝐢𝐧𝐠 🆚 𝐃𝐨𝐦𝐚𝐢𝐧 𝐄𝐱𝐩𝐞𝐫𝐭𝐢𝐬𝐞: 𝐞𝐱𝐩𝐥𝐨𝐢𝐭𝐢𝐧𝐠 𝐭𝐡𝐞 𝐛𝐞𝐬𝐭 𝐨𝐟 𝐭𝐡𝐞 𝐭𝐰𝐨 𝐰𝐨𝐫𝐥𝐝𝐬 𝐰𝐢𝐭𝐡 𝐏𝐡𝐲𝐬𝐢𝐜𝐬-𝐢𝐧𝐟𝐨𝐫𝐦𝐞𝐝 𝐍𝐞𝐮𝐫𝐚𝐥 𝐍𝐞𝐭𝐰𝐨𝐫𝐤𝐬 🔧 I recently launched a survey on the relative importance of machine learning and domain expertise. Today I want to show how they can work together, using physics-informed neural networks. 📝Although the topic is quite complex, the blog (from which I took the image) https://lnkd.in/gSSE3SPj is very clear and provides an overview with the example of a harmonic oscillator. As mentioned at the end of the blog, by incorporating existing physics principles into machine learning we are able to create more powerful models that learn from data and build on scientific knowledge. Are you already familiar with these types of neural networks? In which domains do you think they can be used? #machinelearning #domainexpertise #ai #deeplearning #neuralnetworks #datascience #engineering #data (ved Ela As) https://www.instagram.com/p/CWhBeIbII5f/?utm_medium=tumblr
2 notes
·
View notes
Photo

💢A list of essential machine learning algorithms. 1) linear regression 2) logistic regression 3) decision tree 4)svm 5)KNN 6) dimensionally reduction 7) Random forest 8) K-means 9) naive Bayes For more information about Business Intelligence, Data science and Machine Learning follow me and @elaanalytics #datascience #machinelearning #algorithms #AI #DeepLearning #analytics #data #businessintelligence #dataviz (ved Ela As) https://www.instagram.com/p/CWgPEe5owjz/?utm_medium=tumblr
3 notes
·
View notes
Photo

ELA Analytics products VeA Monthly Subscription: https://bit.ly/3o42ApX VeA Yearly Subscription: https://bit.ly/3kbgTHQ VeA PowerBI Dashboard: https://bit.ly/3EQievw Fiken Monthly Subscription: https://bit.ly/2YhtrWs Fiken Yearly Subscription: https://bit.ly/2ZVDjWW PO Monthly Subscription: https://bit.ly/3ESWgbD PO Yearly Subscription: https://bit.ly/2ZTQCXW #regnskap #rapport #powerbi #fiken #poweroffice #visma #vismaeaccounting (ved Ela As) https://www.instagram.com/p/CWWNBMFIAM8/?utm_medium=tumblr
0 notes