#Best bullish reversal patterns
Explore tagged Tumblr posts
Visit Tumblr Blog
Explore Tumblr blogs with no restrictions, modern design and the best experience.
Last Seen Tumblr Blogs


Fun Fact
Tumblr was the first site to host the blog for President Barack Obama in 2011.
Text
How to Trade the Harami Cross (Bullish) Pattern: A Complete Guide
The Harami Cross (Bullish) pattern is a powerful and reliable candlestick formation in technical analysis that signals a potential reversal from a downtrend to an uptrend. Understanding how to identify and trade this pattern can give traders an edge in timing entry points and managing risk effectively. In this post, we’ll break down the Harami Cross (Bullish) pattern, explain its significance,…
#Best bullish reversal patterns#Best strategy for trading bullish Harami Cross in stock market#Bullish candlestick pattern strategy#Bullish Harami Cross strategy#Bullish Harami trading strategy#bullish momentum shift#Bullish reversal candlestick patterns#candlestick chart reversal signals#Candlestick patterns for beginners#Doji candlestick meaning#Harami Cross Bullish Pattern#Harami Cross candlestick pattern#Harami Cross chart example#Harami Cross confirmation signal#Harami Cross pattern entry and exit points#Harami Cross strategy for beginners in technical analysis#Harami Cross technical analysis#Harami Cross trading setup with confirmation#Harami Cross vs Bullish Harami#Harami Cross with volume confirmation strategy#How to identify and trade the Harami Cross candlestick pattern#How to identify Harami Cross#How to trade Harami Cross#How to use RSI with bullish Harami Cross#Japanese candlestick patterns#learn technical analysis#Price action trading strategy#Profitable candlestick patterns for swing traders#reliable candlestick signals#Step-by-step guide to bullish Harami Cross pattern
0 notes
Text
Are We Due For A Little Mean Reversion?

I remain bullish on 2024. My 2024 Annual Forecast released on December 21, 2023 is on track, yet the market has already achieved (and slightly surpassed) my Base Case Scenario of average election year gains of 8-15%. While my Best Case Scenario of 15-25% is likely now in play with the market running well above any of the historical seasonal patterns I can concoct, the market may be due for a little reversion to the mean.
The charts here illustrate the three most relevant seasonal patterns: All Election Years, election years with a Sitting President Running for reelection and my STA Aggregate Cycle, which is a combo of all years, election years and the 4th year of the decade (years ending in 4). The Midyear Rally I discussed early this week is still in play. But after that around mid-July, I would not be surprised if the market were to pull back toward the mean a bit, maybe 5-8%.
There’s plenty on the near-term horizon to spook traders from election campaign and political missteps, to Fedspeak, economic data disappointments and just plain old Summer Doldrums (2024 STA page 50). After going long last October, we have been advising newsletter subscribers over the past few months to take some profits, tighten up stops, generate some cash and hold some short-term bonds paying 5%+ while we wait for the fatter pitch.

16 notes
·
View notes
Text
Mastering Indian Stock Market Trading & Investing: Technical Analysis for Smart Decisions

If you've ever found yourself staring at stock charts, wondering what those zigzag lines really mean or how seasoned traders predict market moves so accurately—it’s time to dive deep into the fascinating world of technical analysis.
Whether you're a beginner aiming to make your first trade or a budding investor who wants to understand market trends better, technical analysis is your gateway to reading the stock market like a pro. It’s not magic. It’s strategy—and with the right mindset, tools, and a bit of practice, anyone can learn it.
In this guide, we’ll explore what technical analysis is, how it's used in Indian stock market trading, and why mastering it can be a game-changer for your financial future.
What is Technical Analysis, Really?
At its core, technical analysis is about analyzing price movements and patterns. Instead of focusing on a company’s balance sheet or profits (which is fundamental analysis), technical analysis zooms in on stock charts, volume trends, support/resistance levels, and indicators like RSI, MACD, and moving averages.
Here’s the idea: history often repeats itself in the markets. Traders believe that past price movements can provide clues about future behavior.
But don’t worry—it’s not about memorizing hundreds of formulas. It’s about recognizing patterns, understanding market psychology, and using tools that are available to everyone.
Why is Technical Analysis Crucial in Indian Stock Market Trading?
India’s stock market, with major exchanges like NSE and BSE, is vibrant, fast-moving, and full of opportunities. With retail participation increasing and more young investors entering the scene, understanding technical analysis is not just a skill—it’s a competitive edge.
Here's why it matters:
📈 Volatility is Opportunity: Indian stocks often experience sharp movements. Technical analysis helps you time entries and exits better.
🔍 Helps Filter the Noise: News, opinions, and rumors? Technical charts let the price action speak for itself.
🕒 Perfect for Short-term & Swing Trading: Want to catch trends that last a few days or weeks? TA is your best friend.
💼 Complements Long-Term Investing: Even if you’re a long-term investor, knowing when to buy a fundamentally strong stock can greatly enhance returns.
Core Principles of Technical Analysis
To make smart decisions, you need a few essentials in your toolkit. Let’s break them down.
1. Price Discounts Everything
This is the first rule of technical analysis. Every known factor—earnings, news, expectations—is already reflected in the price.
2. Trends are Key
Markets move in trends: upward (bullish), downward (bearish), or sideways. Identifying the trend early can give you a head start.
3. History Tends to Repeat Itself
Humans drive the markets. Emotions like fear and greed lead to recurring price patterns.
Must-Know Tools and Indicators for Beginners
Learning technical analysis doesn’t mean staring blankly at complex graphs. Start with these basic tools:
🟢 Moving Averages (MA)
They smoothen price data to help you identify the trend. A simple 50-day and 200-day MA combo can reveal bullish or bearish signals.
🟣 Relative Strength Index (RSI)
A momentum indicator that tells you if a stock is overbought or oversold. It works on a scale of 0-100. Typically, above 70 means overbought; below 30 means oversold.
🔵 MACD (Moving Average Convergence Divergence)
Used to catch trend reversals. It gives crossover signals that many day traders live by.
🟡 Support and Resistance
Support is a level where buyers enter; resistance is where sellers dominate. Price tends to bounce between these zones.
🔴 Candlestick Patterns
Japanese candlesticks offer visual insights into market psychology. Patterns like Doji, Hammer, and Engulfing tell a story of potential reversals.
A Real-World Example: Let’s Analyze a Stock
Let’s say you’re looking at Infosys. You open the daily chart and notice:
The RSI is around 80 ➜ The stock might be overbought.
It’s near a resistance level it couldn’t cross twice before.
A bearish engulfing candle forms.
This is a potential short signal.
On the flip side, if the stock is near its 200-day MA, RSI is around 35, and a hammer pattern appears near support—you might consider buying.
The beauty of technical analysis? These setups repeat over time.
Day Trading vs Swing Trading vs Investing: How Does TA Fit?
✅ Day Trading
Entry and exit in the same day.
Requires strict discipline and quick decision-making.
TA is essential—especially 5-min, 15-min, hourly charts.
✅ Swing Trading
Positions held for days or weeks.
Based on short-to-medium-term trends.
Ideal for working professionals.
✅ Investing
Long-term horizon, but TA helps in timing your entry.
For example: Buying at a support level during a correction can improve returns significantly.
How to Start Learning Technical Analysis the Smart Way?
The internet is full of content, but not all of it is structured or beginner-friendly. If you’re serious about mastering it, choose a comprehensive, beginner-to-advanced course that focuses on the Indian stock market context.
We highly recommend starting with this Indian Stock Market Trading | Investing: Technical Analysis!! course. It’s perfect for beginners, filled with practical charting tips, live examples, and Indian stock-specific case studies.
Not only will it teach you chart reading, but you’ll also learn how to:
Use charting platforms effectively
Apply 20+ indicators in real-world scenarios
Build your trading strategy
Avoid beginner mistakes
Read volume like a pro
Whether you want to trade Bank Nifty, mid-cap stocks, or explore intraday and positional strategies, this course brings clarity and depth in a step-by-step format.
Common Mistakes New Traders Make (and How to Avoid Them)
Many new traders jump in with high hopes and little prep. Here’s how not to fall into the same traps:
❌ Trading Without a Plan: Always have entry, stop-loss, and target.
❌ Overusing Indicators: More isn’t better. Stick to 2–3 that suit your style.
❌ Ignoring Risk Management: Never risk more than 1–2% of your capital on a single trade.
❌ Letting Emotions Rule: Fear and greed are your biggest enemies.
Consistency comes from mindset, not just methods.
Building Your Trading System with Technical Analysis
Once you get the basics, build your own trading system—a repeatable strategy that aligns with your risk appetite.
Ask yourself:
What’s my trading style? (Scalping, Intraday, Positional)
What’s my entry signal? (Crossover, pattern, breakout)
What’s my stop-loss logic? (Fixed %, below support)
What are my exit rules? (Trailing stop, fixed reward ratio)
Test your system. Backtest it. Paper trade. And once it works—scale it.
Is Technical Analysis Foolproof?
No system is perfect. Technical analysis gives probabilities, not certainties. But when used correctly, it dramatically tilts the odds in your favor.
It's not about predicting the future. It's about reading the present clearly enough to make informed decisions.
That’s the edge that sets apart successful traders from the rest.
Final Thoughts: Why Now is the Best Time to Learn Technical Analysis
With rising retail participation in India’s stock market and easy access to free and paid charting tools, this is the perfect time to learn technical analysis.
Whether you're doing it to:
Create a side income,
Manage your investments better,
Or someday trade full-time,
Mastering technical analysis opens a whole new dimension in your financial journey.
And the best part? You don’t need a finance degree or fancy tools—just curiosity, a good course, and a willingness to learn.
Start your journey with confidence. Explore the Indian Stock Market Trading | Investing: Technical Analysis!! course today and take your first step toward smarter investing.
0 notes
Text
PCR Ratio vs Other Indicators: Why It Matters in Options Trading
In the world of trading and investing, understanding market sentiment can be just as important as analyzing technical charts or financial statements. One powerful tool traders use for this is the Put Call Ratio, often abbreviated as the PCR Ratio. This indicator plays a crucial role in options trading and can provide insights into potential market direction.
Understanding the Basics of PCR Ratio
The Put Call Ratio is a simple yet effective tool that compares the trading volume of put options to call options. The formula is:
PCR Ratio = Volume of Put Options / Volume of Call Options
This ratio is used to gauge the mood of the market participants—whether they are leaning bearish (put-heavy) or bullish (call-heavy).
A PCR Ratio greater than 1 implies that more puts are being traded than calls, often signaling bearish sentiment.
A PCR Ratio less than 1 indicates that more calls are being bought, typically suggesting bullish sentiment.
A PCR Ratio close to 1 signals a balanced market.
Why the Put Call Ratio Matters

The Put Call Ratio is not just a number. It reflects investor psychology. Many professional traders consider it a contrarian indicator, meaning if the PCR is too high, it might actually signal a potential bullish reversal, as the market may be oversold. On the flip side, a very low PCR could hint that investors are overly optimistic, which could lead to a correction.
How to Interpret PCR Ratio in Real-Time
Let’s say the PCR Ratio is 1.3. This means the number of put options traded is 30% higher than call options. At first glance, it might look like investors are pessimistic. However, if this high ratio is unusual compared to historical averages, traders may interpret this as an opportunity to go long, expecting a rebound.
Conversely, a PCR Ratio of 0.6 might indicate overconfidence in the market. Too many calls could signal a saturated bullish sentiment, suggesting a possible market top.
Use Cases of PCR Ratio in Options Trading
Swing Trading: Traders use changes in the PCR Ratio to identify short-term reversals.
Trend Confirmation: A rising market with a falling PCR could confirm a strong bullish trend.
Risk Management: PCR helps in gauging market mood and planning entry/exit points more precisely.
Nifty or Index Tracking: The Nifty PCR Ratio is often used by institutional traders to forecast index movements.
Limitations of PCR Ratio
While the Put Call Ratio is a powerful tool, it should not be used in isolation. It's best combined with other indicators like RSI, MACD, or candlestick patterns. Additionally, PCR can vary across different sectors and timeframes, so it's important to contextualize its values.
Also, a spike in the PCR Ratio doesn’t always mean the market will move up. If the increase in puts is due to hedging by institutions, it might not be a bearish signal at all.
Final Thoughts
The PCR Ratio is one of the most useful sentiment indicators in options trading. Whether you're a beginner or an experienced trader, incorporating the Put Call Ratio into your trading strategy can offer valuable insights. But like any tool, it works best when used alongside proper research and risk management.
Understanding the balance between puts and calls helps traders decode market psychology, identify possible reversals, and make informed decisions. Keep an eye on the PCR Ratio, and you’ll start to see the hidden story behind market moves.
0 notes
Text
Triangle Pattern in Trading | Simple Guide for Everyone

Triangle Pattern in Trading: Master the Market Moves
Trading the financial markets may seem like rocket science, but what if I told you it’s more like spotting shapes in clouds? Yes, seriously. One of the most powerful chart patterns traders rely on is the triangle pattern, and understanding it could be your edge in the market—especially the symmetrical triangle pattern.
This article breaks it all down for you in the simplest way possible—no complicated terms, no financial degree required. Plus, we’ll show how tools like the best algo trading software in India and online trading software can help make the process smoother.
Learn the symmetrical triangle pattern in trading. Discover how it works using the best algo trading software in India & top online trading software.
What is a Triangle Pattern in Trading?
Imagine squeezing a spring between your fingers. It tightens and builds up pressure. Then one day—snap! It shoots out. That’s exactly what a triangle pattern does on a stock chart. It shows a market that’s consolidating, building pressure before breaking out in one direction.
A triangle pattern forms when the price of a stock, crypto, or any tradable asset moves within converging trendlines, forming a shape that literally looks like a triangle.
Types of Triangle Patterns
There are three main types of triangle patterns, and each tells a different story:
Symmetrical Triangle – The sides converge equally. It’s a sign of uncertainty.
Ascending Triangle – Flat top, rising bottom. Often a bullish sign.
Descending Triangle – Flat bottom, falling top. Usually a bearish signal.
In this guide, we’ll focus mostly on the symmetrical triangle pattern, but it’s useful to know the others too.
What is the Symmetrical Triangle Pattern?
Think of the symmetrical triangle as a tug of war between buyers and sellers. Both sides are strong, but neither can overpower the other—yet. So the price bounces between narrowing support and resistance levels.
Here’s the key part: this pattern doesn’t tell you the direction of the breakout, but it strongly suggests a breakout is coming soon. It’s like a pressure cooker ready to explode—up or down.
Why Triangle Patterns Matter
You don’t need to predict the market perfectly to succeed—you just need to be ready for when it moves. Triangle patterns help with that.
Key Benefits:
Anticipate breakouts
Identify entry and exit points
Avoid trading during uncertain periods
Spotting these patterns can give you an edge over traders who are just guessing.
How to Spot a Symmetrical Triangle
Here’s how to identify it like a pro:
Look for lower highs and higher lows
Draw two trendlines—one sloping down from above, one sloping up from below
The lines converge toward each other like scissors
Once these lines start coming together, traders watch closely for the breakout.
Breakouts: The Big Reveal
Breakouts are when the price bursts out of the triangle formation.
Breakout Direction Tips:
Volume spike? Expect a strong move.
Break above the upper line? Likely bullish.
Break below the lower line? Likely bearish.
No pattern is 100% accurate, but triangle breakouts often lead to explosive price action.
Volume and the Triangle Pattern
Volume is like the “voice” of the market. During a symmetrical triangle formation, volume tends to drop, showing less activity. But right before a breakout, volume usually spikes, confirming that the market is about to move big.
This is where having powerful online trading software helps—these platforms can alert you to changes in volume instantly.
Triangle Patterns vs. Other Patterns
How does the triangle compare to other chart patterns?
Pattern
Key Signal
Symmetrical Triangle
Uncertainty followed by breakout
Head and Shoulders
Trend reversal
Flags & Pennants
Continuation of trend
Double Top/Bottom
Major reversal points
The symmetrical triangle pattern is one of the few that doesn’t try to predict direction—it helps you prepare for it instead.
Common Mistakes to Avoid
Even the best tools can't fix poor trading habits. Avoid these rookie mistakes:
Entering before the breakout – Wait for confirmation.
Ignoring volume – It’s your early warning system.
Misidentifying the pattern – Practice drawing trendlines correctly.
Overtrading – Not every triangle leads to a big move.
Take your time. It’s not about catching every move—it’s about catching the right one.
How Algo Trading Makes It Easier
Can software help you catch these patterns faster? Absolutely.
With the best algo trading software in India, you can automate:
Pattern recognition
Volume analysis
Trade execution on breakouts
This means no more staring at charts all day. The software does the scanning and alerts you when it’s go-time.
Top Online Trading Software in India
Here are some of the best platforms where you can trade triangle breakouts:
Quanttrix – Known for its high-speed algorithms and pattern recognition.
Zerodha Kite – Popular for its easy interface and charting tools.
Upstox Pro – Combines speed with smart analytics.
Angel One – AI-driven alerts and customizable charts.
These online trading software platforms make it easier for Indian traders to take advantage of technical patterns like triangles.
Backtesting the Triangle Pattern
Before you risk real money, test it out.
Backtesting means applying the triangle pattern to past market data to see how well it worked.
Many platforms (like Quanttrix or TradingView) allow backtesting. Use this feature to:
Learn how often triangle breakouts succeed
Understand what conditions increase success
Improve your strategy over time
Real-Life Examples of Triangle Trading
Let’s say a stock like Reliance Industries starts forming a symmetrical triangle. You draw your trendlines and notice a breakout with strong volume on the upside.
If you had set an automated trade using algo software, you could’ve caught the breakout without lifting a finger.
Triangle patterns show up across stocks, crypto, commodities—you name it. They’re universal.
Tips for Beginners
Starting out? Here are a few things to keep in mind:
Use demo accounts – Practice without risk
Stick to one pattern – Master triangles first
Set alerts on your online trading software
Keep a trading journal – Log your triangle trades
Master one pattern and let it become your bread and butter before branching out.
Conclusion: Turning Shapes into Profits
Triangle patterns aren’t just pretty shapes—they’re predictive tools used by savvy traders around the world. The symmetrical triangle pattern in particular is a reliable signal of upcoming volatility.
With the help of the best algo trading software in India and reliable online trading software, you can turn this pattern into profit—without having to watch charts 24/7.
Trading doesn't have to be overwhelming. Sometimes, all you need is the ability to recognize a triangle.
FAQs
What does a symmetrical triangle pattern indicate? It shows price consolidation and signals an upcoming breakout, though it doesn’t predict the direction.
Can beginners use triangle patterns effectively? Yes! With some practice and the right tools, even beginners can spot and trade triangle patterns.
How does algo trading help with triangle patterns? Algo trading can automatically detect triangle formations and execute trades once a breakout is confirmed.
What is the best online trading software in India for chart patterns? Quanttrix, Zerodha Kite, and Upstox Pro are popular choices that support detailed charting and pattern detection.
Should I trade every triangle pattern I see? No. Only trade confirmed breakouts, ideally supported by volume and market conditions.
0 notes
Text
Stock Market Astrology: Unlocking Financial Wisdom with Guru Ji Dr Raj
The stock market is often viewed as a complex web of numbers, trends, and unpredictable movements. Investors and traders spend years mastering financial charts and economic indicators, yet market behavior frequently defies logical expectations. In a world where conventional analysis sometimes falls short, a growing number of investors are exploring an ancient but insightful tool: Stock Market Astrology.
Astrology has guided human decision-making for centuries, from agriculture to governance — and now, modern traders are rediscovering its value in understanding market dynamics. With the guidance of experts like Guru Ji Dr Raj – Best Astrologer in USA, many are learning how celestial movements could offer new perspectives on financial markets.
What Is Stock Market Astrology?
At its core, Stock Market Astrology is the study of how planetary alignments, lunar cycles, and cosmic influences affect market trends and investor psychology. Just as the moon influences ocean tides, believers argue that celestial events can subtly shape collective human emotions — fear, greed, optimism — which drive buying and selling behavior.
Financial astrology doesn’t replace traditional analysis. Instead, it provides an additional layer of insight, helping traders anticipate potential volatility or favorable opportunities.
How Planetary Movements Interact with Market Behavior
The concept might seem unconventional at first, but stock market astrologers like Guru Ji Dr Raj use precise techniques based on Vedic and Western astrology principles to decode market patterns.
Planetary Aspects and Market Sentiment
Conjunctions, Squares, and Trines: Favorable aspects often coincide with bullish trends, while tense aspects may signal bearish movements.
Mercury Retrograde: Traders sometimes associate this phenomenon with market confusion or unexpected reversals.
Nakshatras and Financial Cycles
In Vedic astrology, Nakshatras (lunar constellations) play a vital role. Certain Nakshatras are linked to prosperity, caution, or unexpected events. Their transitions can offer critical insights for timing trades.
Lunar Phases and Market Volatility
New moons and full moons are believed to heighten emotional decision-making in the markets. Understanding these cycles helps traders plan strategic entries and exits.
Under the expertise of Guru Ji Dr Raj, these celestial observations are methodically analyzed to offer traders structured, actionable insights — not vague predictions.
The Modern Face of Financial Astrology
Thanks to advancements in technology, Stock Market Astrology has become more accessible and precise. Astrologers today use real-time planetary tracking, ephemeris software, and integrate their forecasts with modern financial analytics.
Services offered by experts like Guru Ji Dr Raj – Best Astrologer in USA now include:
Daily and weekly market outlooks
Sector-specific financial forecasts
Personalized trading horoscopes based on individual birth charts
Timing guides for major financial decisions
This blending of ancient wisdom with modern tools ensures that astrology complements, rather than replaces, logical financial decision-making.
Why Some Investors Incorporate Astrology Into Their Strategy
While skepticism around financial astrology exists, a growing community of traders finds value in its insights. Here’s why:
Anticipating Emotional Swings
Since markets are largely driven by human emotion, astrology’s ability to map collective moods offers a unique advantage.
Enhancing Timing Strategies
Knowing when market sentiment might shift — even if the “why” remains unclear — allows investors to manage risk and time their moves more precisely.
Providing a Broader Context
Astrology looks at macro-cycles and long-term energies, helping investors understand broader economic shifts that traditional analysis may overlook.
With seasoned practitioners like Guru Ji Dr Raj providing nuanced interpretations, astrology becomes a tool for strategic foresight, not superstition.
Common Criticisms and Balanced Perspectives
Skeptics often point out that astrology lacks empirical scientific proof when applied to financial markets. However, defenders highlight:
Astrology’s historical use in agriculture, governance, and early economic planning.
The undeniable role of collective psychology in market trends, which astrology seeks to interpret.
The practical results many traders have reported when combining astrology with traditional technical analysis.
As with any investment strategy, astrology should complement — not replace — rational research and sound risk management.
Practical Applications of Stock Market Astrology
If you are curious about incorporating astrological insights into your trading or investing, here are some practical applications:
Market Timing: Plan entries and exits around favorable celestial periods.
Risk Assessment: Identify periods where heightened caution may be necessary.
Sector Selection: Analyze which industries are astrologically favored during specific planetary cycles.
Personalized Trading Strategy: Tailor your financial approach based on your individual astrological profile.
Clients who work with Guru Ji Dr Raj often report feeling more prepared and confident when combining astrological guidance with technical analysis.
Should You Consult an Expert for Financial Astrology?
While anyone can study basic astrology, decoding complex celestial influences on volatile markets requires deep expertise. This is where trusted professionals like Guru Ji Dr Raj – Best Astrologer in USA make a real difference.
An expert consultation ensures that interpretations are accurate, personalized, and grounded in both astrological wisdom and financial realities.
If you are serious about enhancing your market perspective with astrology, it’s essential to work with someone who understands both the stars and the markets.
Book Your Online Consultation Today
In a world where milliseconds can define profits and losses, having every possible edge matters. Book an online consultation with Guru Ji Dr Raj – Best Astrologer in USA and discover how cosmic patterns could align with your financial goals. To learn more or to schedule your personalized session, visit rajguru.us.
#astro community#astro observations#astrology#astrology content#astro notes#astrology signs#vedic astrology#astrology notes#birth chart#astronotes#astro placements#share market
0 notes
Text
How to Trade Using Candlestick Patterns for Better Trade Decisions
Candlestick patterns are one of the most widely used tools in technical analysis. They provide valuable insights into market sentiment and potential price movements by analyzing the open, close, high, and low of each trading period. By understanding and using candlestick patterns, traders can make more informed decisions, anticipate market reversals, and optimize entry and exit points.
Here’s how you can use candlestick patterns effectively in your trading strategy.
1. What are Candlestick Patterns?
A candlestick pattern is formed by one or more candlesticks that represent price movements within a given timeframe. Each candlestick shows:
Open price: The price at which the asset opened during the time period.
Close price: The price at which the asset closed during the time period.
High price: The highest price reached during the period.
Low price: The lowest price reached during the period.
Candlestick patterns can be either bullish (indicating an upward price movement) or bearish (indicating a downward price movement), depending on the relationship between the open and close prices.
2. Popular Bullish Candlestick Patterns
Bullish candlestick patterns signal potential upward price movement. Here are a few common ones to look out for:
Bullish Engulfing Pattern: This pattern consists of a small bearish candlestick followed by a larger bullish candlestick that completely engulfs the previous one. It indicates strong buying pressure and often signals the beginning of an uptrend.
Hammer: A hammer candlestick has a small body and a long lower shadow, which indicates that sellers tried to push the price lower, but buyers stepped in and drove the price back up. It suggests a potential reversal from a downtrend to an uptrend.
Morning Star: This pattern consists of three candlesticks: a long bearish candlestick, followed by a small-bodied candlestick, and then a long bullish candlestick. The morning star indicates a potential trend reversal from bearish to bullish.
3. Popular Bearish Candlestick Patterns
Bearish candlestick patterns suggest potential downward price movement. Here are a few common bearish patterns to look for:
Bearish Engulfing Pattern: The opposite of the bullish engulfing pattern, the bearish engulfing consists of a small bullish candlestick followed by a larger bearish candlestick that completely engulfs it. This pattern indicates strong selling pressure and often signals the start of a downtrend.
Shooting Star: The shooting star has a small body and a long upper shadow, signaling that buyers tried to push the price higher but were unable to sustain it. This pattern suggests a potential reversal from an uptrend to a downtrend.
Evening Star: The evening star is the opposite of the morning star, consisting of a long bullish candlestick, followed by a small-bodied candlestick, and then a long bearish candlestick. This pattern indicates a potential reversal from bullish to bearish.
4. Using Candlestick Patterns for Entry and Exit
Candlestick patterns can be used to make more informed decisions about when to enter and exit trades:
Entry: When you identify a bullish reversal pattern (like a bullish engulfing or hammer) at support levels, it could be an indication to enter a long position. Similarly, a bearish reversal pattern (like a bearish engulfing or shooting star) at resistance levels could signal a short position.
Exit: Candlestick patterns can also help with determining exit points. For example, if you are in a long position and a bearish reversal pattern (like an evening star) forms near a resistance level, it might be a signal to close your position or set a stop-loss order to protect your profits.
5. Combining Candlestick Patterns with Other Indicators
While candlestick patterns can provide valuable insights, they work best when combined with other technical indicators to confirm the signals. Here are some tools you can use alongside candlestick patterns:
Support and Resistance: Look for candlestick patterns that form at key support or resistance levels. For example, a bullish engulfing pattern at a support level has a higher probability of success.
Moving Averages: Combine candlestick patterns with moving averages (e.g., 50-day or 200-day MA) to confirm the overall trend. A candlestick pattern that aligns with the trend can be more reliable.
RSI (Relative Strength Index): Use RSI to confirm whether an asset is overbought or oversold. A candlestick reversal pattern accompanied by an overbought or oversold condition can strengthen your trade decision.
6. Practice Patience and Wait for Confirmation
Candlestick patterns should never be used in isolation. They work best when you wait for confirmation before entering a trade. For example:
Volume: If a candlestick pattern forms with high volume, it’s a stronger signal. Volume confirmation helps validate the strength of the pattern.
Other Indicators: Look for confirmation from indicators like RSI or moving averages. For example, a bullish engulfing pattern near a moving average support level combined with an RSI showing oversold conditions may provide a more reliable signal.
Waiting for confirmation ensures you’re not jumping into a trade based on an isolated pattern, which could turn out to be a false signal.
Final Thought: Master Candlestick Patterns for Smarter Trading
Candlestick patterns are a powerful tool that can enhance your trading strategy. By understanding and recognizing common bullish and bearish patterns, you can make more informed decisions about entry and exit points, improve timing, and manage risk more effectively.
Ready to trade smarter with expert-backed strategies? Download Univest — the SEBI-registered trading app that helps you identify profitable candlestick patterns, follow expert strategies, and trade with confidence. Stay ahead of the market and improve your trading success.
0 notes
Text
Assessing the Right Time to Invest in Forex: A Comprehensive Guide
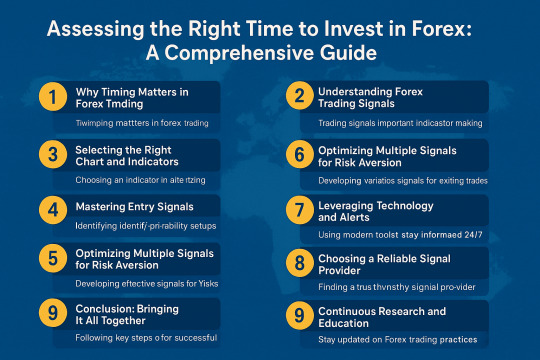
Investing in the foreign exchange (Forex) market can be highly rewarding—but only if you know when and how to enter and exit trades. This guide will walk you through the key steps to assess the optimal time to invest, including understanding trading signals, choosing the right charts, mastering entry and exit indicators, and leveraging technology to stay ahead. Whether you’re a beginner or a seasoned trader, these strategies will help you make informed, logical decisions and minimize risk.
1. Why Timing Matters in Forex Trading
The Forex market operates 24 hours a day, five days a week, with trillions of dollars changing hands daily. Given its continuous nature and high volatility, timing your trades can be the difference between healthy profits and significant losses. Entering at the wrong time may expose you to adverse currency swings, while exiting too early can prevent you from maximizing gains.
A well-timed trade allows you to:
Capitalize on momentum during strong trends
Avoid sharp reversals triggered by economic news
Reduce drawdowns and preserve capital
Improve risk-to-reward ratios on every position
By the end of this article, you’ll have a clear roadmap to pinpoint the best moments to invest and secure consistent returns.
2. Understanding Forex Trading Signals
Trading signals are alerts based on predefined criteria that suggest when to buy or sell a currency pair. They distill vast market data into actionable insights, helping traders spot opportunities without parsing every tick on the chart. Signals can be:
Technical: Generated from mathematical calculations on price and volume (e.g., Moving Averages, RSI, MACD).
Fundamental: Driven by economic events, like interest rate decisions or GDP reports.
Sentiment-based: Reflecting trader positioning and market psychology.
The key is to choose signals that align with your trading style—whether that’s scalping, day trading, swing trading, or longer-term position trading.
3. Selecting the Right Chart and Indicators
Before diving into signals, select a charting platform that offers:
Real-time data feeds for all major and minor currency pairs
Customizable timeframes (from 1-minute to monthly)
Built-in technical indicators and the ability to add custom scripts
Common Forex Charts
Line Chart: Simplest view showing closing prices.
Bar Chart: Displays open, high, low, and close (OHLC) for each period.
Candlestick Chart: Similar to bar charts, but with color-coded bodies—excellent for spotting reversal patterns.
Essential Technical Indicators
Moving Averages (MA): Identify trend direction and dynamic support/resistance.
Relative Strength Index (RSI): Measures overbought/oversold conditions.
Moving Average Convergence Divergence (MACD): Captures trend strength and momentum shifts.
Bollinger Bands: Highlight volatility and potential breakout points.
Stochastic Oscillator: Another momentum tool for spotting reversal zones.
Familiarize yourself with how each indicator behaves across different timeframes. Longer MAs smooth out noise but lag more, while shorter MAs react quickly but can generate false signals.
4. Mastering Entry Signals
An effective entry strategy combines multiple indicators to confirm a high-probability setup. Here’s a step-by-step process:
Trend Confirmation:
Use a 50-period and 200-period MA crossover to determine the primary trend (bullish when 50 above 200; bearish when below).
Momentum Filter:
Check RSI or MACD histogram for momentum alignment. For example, in an uptrend, RSI should be above 50.
Pattern Recognition:
Look for chart patterns (e.g., flags, pennants, head and shoulders) that signal continuation or reversal.
Entry Trigger:
A candlestick pattern (e.g., bullish engulfing) or a break above/below a recent swing high/low.
Volume/Volatility Check:
Confirm with volume spikes or Bollinger Band width expansion to ensure the move is supported by sufficient trading activity.
Example Entry Signal Workflow
Step 1: EUR/USD 4-hour chart shows 50 MA above 200 MA (uptrend).
Step 2: RSI sits at 55, indicating bullish momentum.
Step 3: Price consolidates in a bull flag for three candles.
Step 4: A breakout candle closes above the flag’s top—enter long.
Step 5: Volume increases by 20% above the 20-period average, confirming strength.
5. Optimizing Exit Strategies
Your exit plan is just as important as your entry. There are three common types of exits:
Fixed Stops and Profit Targets:
Predefine a stop-loss level (e.g., 30 pips) and a profit target (e.g., 60 pips) before entering. This guarantees a positive risk-to-reward ratio.
Trailing Stops:
Move your stop-loss in your favor as price advances. Many traders use a moving average or ATR-based trailing stop to capture extended moves.
Limit Exits at Key Levels:
Close positions at significant support/resistance zones or Fibonacci retracement lines.
Short-Term (Scalp/Swing) Exits
For quick trades, focus on “turning points”—repeated short-term patterns that can produce fast reversals. Monitor currency pair swings on 5- to 15-minute charts and set tight limit exits (e.g., 10–15 pips) with equally tight stops.
Real-Time Exit Signals
Many platforms offer real-time alerts—for example, if the MACD line crosses below the signal line or if price breaks below a key moving average. These can automate your exit decisions and reduce emotional bias.
6. Combining Multiple Signals for Risk Aversion
Relying on a single indicator is risky; it can generate false positives or lag behind. Instead, create a signal matrix by:
Overlaying trend, momentum, and volatility indicators
Filtering signals across multiple timeframes (e.g., align a 15-minute entry with a 1-hour trend)
Assigning weights to each signal based on reliability and recent performance
By evaluating multiple Forex signals together, you gain a holistic view of the market and can better anticipate fluctuations. This approach helps you stick to a logical mechanism rather than making random decisions under stress.
7. Leveraging Technology and Alerts
Modern Forex trading thrives on technology. With the right tools, you can analyze markets around the clock and never miss a crucial signal.
Mobile Trading Apps: Execute buy/sell orders and monitor charts on your smartphone—no physical presence required.
Automated Alert Systems: Configure alerts for when indicators meet your predefined parameters (e.g., RSI crosses below 30).
Expert Advisors (EAs): Deploy algorithmic trading systems that scan for signals and place trades automatically.
These innovations ensure that you’re always ready to act on new opportunities, whether you’re at your desk or on the go.
8. Choosing a Reliable Signal Provider
While self-generated signals are ideal, many traders supplement their strategies with professional signal services. To choose a trustworthy provider:
Check Track Record: Look for audited performance over at least six months with clear equity curves.
Read Reviews and Forums: Engage with communities on Forex forums and social media—peer feedback can be invaluable.
Compare Costs vs. Value: Free signals can be high-volume but low-quality, while paid services often offer curated, lower-frequency alerts.
Trial Periods: Opt for services that provide a trial or money-back guarantee so you can test signals risk-free.
Always cross-reference third-party signals with your own analysis to maintain control over your trades.
9. Continuous Research and Education
Forex markets evolve constantly. To stay ahead:
Read Business Newspapers and Magazines: Stay informed on macroeconomic trends that influence currency values.
Participate in Online Forums and Webinars: Exchange ideas with other traders and learn from expert lectures.
Backtest New Strategies: Use historical data and Forex software to simulate performance before risking real capital.
Maintain a Trading Journal: Record each trade’s setup, outcome, and your emotional state to refine your approach over time.
By committing to lifelong learning, you’ll adapt your system to changing market conditions and improve your win rate.
10. Conclusion: Bringing It All Together
Assessing the right time to invest in Forex isn’t about luck—it’s about systematic analysis, disciplined execution, and continuous improvement.
Understand and select the best trading signals for your style.
Choose the right charts and technical indicators.
Master robust entry and exit strategies.
Combine signals across multiple timeframes for enhanced risk aversion.
Leverage technology to automate alerts and execute trades.
Partner with a reputable signal provider, but always validate their calls.
Commit to ongoing research and education to refine your edge.
By following these steps, you’ll position yourself to make well-timed, high-probability trades that align with your goals and risk tolerance. Remember, consistency beats occasional brilliance—stick to your plan, and let your system guide you to long-term success in the Forex market. For more insights: Mastering Forex Trading Psychology: Traits, Emotions, and Mindset for Success Paperback – Large Print, May 20, 2025 by NABAL KISHORE PANDE (Author)
#Forex#TradingSignals#ForexStrategy#ForexIndicators#CurrencyTrading#InvestSmart#MarketTiming#ForexCharts#TradingPsychology#ExitStrategy
0 notes
Text
Top Equity Swing Trading Strategies India – A Guide for Smart Traders
Swing trading is becoming increasingly popular among retail traders in India looking for short- to medium-term gains. If you're someone who wants to profit from market trends without committing to long-term investments or the fast pace of day trading, swing trading may be your ideal strategy.
In this guide, we explore the top equity swing trading strategies India has to offer, tailored to suit the unique characteristics of Indian stock markets. Whether you're a beginner or a seasoned trader, you'll find actionable insights to enhance your swing trading journey.
What is Swing Trading?
Swing trading is a trading style that aims to capture short- to medium-term price movements over a period ranging from a few days to several weeks. Unlike intraday trading, swing trading allows traders more time to analyze charts, study trends, and make informed decisions. It's perfect for part-time traders who cannot constantly monitor the markets.
Swing traders usually rely on technical analysis, although some also incorporate fundamental factors when picking stocks.
Why Choose Equity Swing Trading in India?
India’s equity market is vibrant, volatile, and full of opportunities. Here are a few reasons why swing trading is especially suited for Indian markets:
High Liquidity: Stocks listed on NSE and BSE offer excellent liquidity, which is crucial for entering and exiting trades swiftly.
Diverse Sectors: Indian markets allow traders to diversify across sectors like IT, pharma, banking, FMCG, and more.
Active Retail Participation: Increasing participation by retail investors adds momentum to stocks, which swing traders can capitalize on.
To get started with actionable strategies, check out our detailed resource on Equity swing trading strategies India.
Best Equity Swing Trading Strategies India Traders Can Use
Here are the most effective swing trading strategies tailored to Indian market conditions:
1. Moving Average Crossover Strategy
This strategy involves two moving averages—typically the 50-day and 200-day moving averages. When the short-term MA crosses above the long-term MA, it’s a bullish signal (golden cross). Conversely, a cross below is bearish (death cross).
Entry Point: Buy when the 50-DMA crosses above the 200-DMA.
Exit Point: Sell when the trend reverses or hits your profit target.
Indian stocks like Infosys, HDFC Bank, or Tata Motors often exhibit clear crossover patterns, making them ideal candidates.
2. Support and Resistance Bounce
This involves identifying key support and resistance levels on stock charts. Stocks tend to bounce from support levels and retreat from resistance zones.
Entry Point: Buy near support with confirmation (e.g., bullish engulfing pattern).
Exit Point: Near resistance or when price weakens.
For example, if Reliance Industries shows consistent support at ₹2,200, entering near this level can offer a favorable risk-to-reward ratio.
3. Breakout Strategy
When a stock breaks above a well-established resistance or below support with significant volume, it often continues in that direction for a few days to weeks.
Entry Point: Enter on breakout with high volume confirmation.
Exit Point: Use trailing stop-loss or exit when the price momentum weakens.
This strategy is particularly effective in earnings seasons when stock volatility surges.
4. Relative Strength Index (RSI) Reversal
RSI helps identify overbought and oversold conditions. An RSI below 30 often indicates an oversold stock, while above 70 indicates overbought conditions.
Entry Point: Buy when RSI moves above 30 after hitting oversold.
Exit Point: Sell when RSI nears 70 or shows reversal.
Many Indian mid-cap and small-cap stocks offer profitable swing trades using RSI reversal setups.
5. Volume Spike Strategy
An unexpected spike in trading volume often precedes a significant price move. Pairing volume spikes with price action and candlestick confirmation can be a powerful swing trading signal.
Entry Point: Buy when a volume spike accompanies a bullish breakout.
Exit Point: Exit when volume dries up or price loses strength.
Volume analysis works well for stocks like Adani Enterprises, IRCTC, and Zomato, where retail trader participation is high.
Risk Management in Swing Trading
Even the best strategies fail without solid risk management. Here are essential tips:
Use Stop-Loss Orders: Always define your maximum acceptable loss before entering a trade.
Limit Exposure: Avoid putting all your capital in a single trade.
Position Sizing: Adjust your lot size based on account size and risk tolerance.
Stay Updated: Indian markets are influenced by domestic and global news, earnings reports, and policy changes.
Tools and Platforms for Swing Trading in India
To execute your swing trading strategies effectively, you need the right tools:
Charting Software: TradingView, Zerodha Kite, and Upstox Pro offer excellent charting tools.
Brokerage Platforms: Choose discount brokers like Zerodha, Upstox, or Angel One for lower transaction costs.
News Feed: Use tools like Moneycontrol, Bloomberg Quint, or Economic Times Markets for real-time updates.
Common Mistakes to Avoid in Swing Trading
Overtrading: Trading too frequently can erode profits due to fees and emotional exhaustion.
Ignoring News Events: Swing trades can be disrupted by news like interest rate hikes, policy changes, or global cues.
Lack of Strategy: Jumping into trades without a tested system is a fast track to losses.
Chasing Trades: Don’t buy just because a stock is moving up rapidly. Always wait for pullbacks or setups.
Final Thoughts
India’s equity markets are full of opportunities for swing traders who are patient, strategic, and disciplined. By mastering proven Equity swing trading strategies India, traders can position themselves for consistent profits without the stress of intraday volatility.
Swing trading blends the benefits of technical analysis with a manageable timeframe—making it ideal for working professionals, part-time traders, and those who prefer quality over quantity in their trades.
Ready to Get Started?
At Finversify, we provide expert-curated trading guides, platform comparisons, and tools to help you become a better trader. Whether you're new to swing trading or looking to sharpen your edge, our resources are built with Indian traders in mind.
Visit Finversify today and take your trading to the next level with our latest insights on Equity swing trading strategies India!
0 notes
Text
Candlestick Pattern PDF in Hindi | Learn Trading Basics

Candlestick Pattern PDF in Hindi – The Ultimate Beginner’s Guide
Learning the stock market can feel like learning a new language. Ever felt confused looking at those green and red sticks on a chart? Don’t worry—you’re not alone. These colorful shapes, called candlestick patterns, tell powerful stories about stock prices. And if you're looking for a simple way to understand them in your own language, this guide and Candlestick Pattern PDF in Hindi is just what you need.
Imagine having a flashlight while walking through a dark forest—that's what candlestick patterns are for traders. They light the way and help you predict the next move. In this article, we’ll break it all down for you in easy Hindi-English style and guide you toward some of the best online stock trading courses in India to take your skills to the next level.
Download candlestick pattern PDF in Hindi. Learn basics with the best stock market course India & best online stock trading courses in India.
What is a Candlestick Pattern?
A candlestick pattern is like a small storybook of price movements in the stock market. Each "stick" or candle shows four important things: the opening price, closing price, high, and low for a particular time. These patterns help traders make decisions—whether to buy, sell, or hold.
Why Should You Learn Candlestick Patterns?
Think of candlestick patterns as emotional fingerprints of the market. They show how investors are feeling—fearful, hopeful, greedy, or cautious. Learning these patterns gives you a better chance to predict market moves and avoid costly mistakes. It’s like having a weather forecast before stepping out!
The History of Candlestick Patterns
Did you know candlestick patterns were first used over 300 years ago in Japan? A rice trader named Munehisa Homma developed this system to track price trends. His methods are still used today in the stock market, commodity trading, and even crypto markets.
Anatomy of a Candlestick
Every candlestick has three main parts:
Body: Shows the opening and closing prices.
Wick (or shadow): Indicates the highest and lowest prices during that time.
Color: Usually green (price went up) or red (price went down).
Understanding this structure helps you read charts like a pro!
Types of Candlestick Patterns
Candlestick patterns fall into three broad categories:
Single candle patterns
Double candle patterns
Triple candle patterns
Each tells a different kind of story—some indicate a change is coming, while others confirm that a trend is continuing.
Single Candlestick Patterns
These patterns involve just one candle but can give strong signals:
Doji: Market is confused. Buyers and sellers are at equal power.
Hammer: Signals a potential reversal after a downtrend.
Shooting Star: Indicates a possible drop after a price rise.
Double Candlestick Patterns
Here, two candles combine to create a more reliable signal:
Bullish Engulfing: Second candle completely covers the first. Indicates upward trend.
Bearish Engulfing: Signals a downward trend.
Tweezer Tops and Bottoms: Show a potential reversal in trend.
Triple Candlestick Patterns
When three candles come together, they form powerful patterns:
Morning Star: Bullish reversal after a downtrend.
Evening Star: Bearish reversal after an uptrend.
Three White Soldiers: Strong bullish trend.
Three Black Crows: Strong bearish trend.
Most Powerful Candlestick Patterns to Know
Want to save time and focus only on the important ones? Here are the top candlestick patterns every trader should master:
Hammer and Inverted Hammer
Engulfing Patterns
Morning/Evening Star
Doji
Three White Soldiers
Three Black Crows
These patterns work well across timeframes—whether you're day trading or investing for the long term.
How to Read Candlestick Patterns with Charts
Understanding theory is one thing. But applying it? That’s where the magic happens.
Use platforms like TradingView or Zerodha Kite to see real-time charts. Watch the candles form. Try to "read" their story. With practice, you’ll start spotting patterns without even trying.
Where to Download Candlestick Pattern PDF in Hindi
Looking for a Candlestick Pattern PDF in Hindi? Great idea! Having a PDF in your own language makes it easier to grasp the concepts.
You can download quality resources from:
Trendy Traders is one of the leading institutes in India offering comprehensive and practical stock market education. Known for delivering the best stock market courses in India, Trendy Traders has helped thousands of individuals—beginners, working professionals, and aspiring traders—gain in-depth knowledge and confidence to trade successfully in the stock market.(in Hindi and English)
Varsity by Zerodha
Stock Market Hindi YouTube Channels
Telegram groups dedicated to Hindi stock trading content
Make sure the PDF includes images, real-life examples, and covers the major patterns listed above.
Tips to Learn Faster
Learning candlestick patterns doesn't need to be boring. Here’s how you can make it faster and fun:
Use Flashcards: Make your own with pattern names and meanings.
Watch Videos: Especially Hindi YouTube tutorials with chart examples.
Practice Daily: Use demo trading apps to apply what you learn.
Join Forums: Connect with other learners who speak your language.
Best Stock Market Course India
If you're serious about learning, enrolling in the best stock market course in India is a game changer. Some popular ones include:
Trendy Traders is one of the leading institutes in India offering comprehensive and practical stock market education. Known for delivering the best stock market courses in India, Trendy Traders has helped thousands of individuals—beginners, working professionals, and aspiring traders—gain in-depth knowledge and confidence to trade successfully in the stock market.(in Hindi and English)
Elearnmarkets
Zerodha Varsity
FinGrad
Look for courses that offer Hindi support, live classes, and practical assignments.
Best Online Stock Trading Courses in India – Trendy Traders
Trendy Traders is one of the leading institutes offering some of the best online stock trading courses in India. Known for its practical and student-focused approach, Trendy Traders has helped thousands of aspiring traders gain the knowledge and confidence to succeed in the stock market.
Why Choose Trendy Traders?
Comprehensive Curriculum The courses cover everything from the basics of stock market investing to advanced strategies in technical and fundamental analysis. This includes intraday trading, swing trading, options trading, risk management, and trading psychology.
Expert Mentors Trendy Traders is backed by a team of experienced traders and market experts who offer real-world insights and mentorship, ensuring that students learn not just theory but also how to apply strategies in live markets.
Flexible Online Learning Their courses are delivered online, making it convenient for students across India to access high-quality education from the comfort of their homes.
Live Trading Sessions Students benefit from live market training where they can see strategies being applied in real time, enhancing their learning experience.
Community & Support Enrollees gain access to an active trading community and continued support even after course completion.
Whether you're a beginner or looking to refine your trading skills, Trendy Traders offers some of the best stock market courses in India, designed to empower you to trade confidently and profitably.
Conclusion
Understanding candlestick patterns is like learning the alphabet of the stock market. Without it, you’re just guessing. With it, you’re making informed decisions. And when you get your hands on a candlestick pattern PDF in Hindi, things become even easier.
Don’t stop here. Combine your pattern knowledge with a best stock market course India or explore the best online stock trading courses in India to gain real market confidence. Happy trading!
FAQs
Where can I find a good candlestick pattern PDF in Hindi? You can download it from platforms like NSE India, Zerodha Varsity, and various trading Telegram groups.
Is understanding candlestick patterns enough to trade in the stock market? Not entirely. It’s a strong base, but you should also learn about risk management, indicators, and trading psychology.
Are there stock market courses available in Hindi? Yes! Many platforms like Elearnmarkets and NIFM offer full Hindi support for their stock market courses.
How long does it take to learn candlestick patterns? With regular practice, you can understand the basics in 2-4 weeks. Mastery takes more time and experience.
Do online stock trading courses in India offer certificates? Yes, most reputed platforms provide certificates upon completion which can boost your trading career.
0 notes
Text
Candlestick Patterns: Mastering Market Moves with Accurate and Profitable Setups
In technical analysis, Candlestick Patterns are among the most powerful tools traders use to predict price movements. These patterns, originating from Japanese rice traders in the 18th century, provide visual cues about market sentiment, momentum, and potential reversals.
While there are dozens of candlestick formations, not all are equally reliable or easy to use. In this guide, we will focus on the most accurate and easy-to-understand candlestick patterns that offer strong profit potential, especially for swing traders and intraday traders.

What Are Candlestick Patterns?
A candlestick represents the price movement of an asset within a specific timeframe (e.g., 5-minute, daily, weekly). Each candlestick shows four key prices:
Open
High
Low
Close
The body (thick part) shows the range between the open and close. The wicks (or shadows) show the highs and lows. A green (or white) body shows a bullish candle, while a red (or black) one shows a bearish candle.
When grouped, Candlestick Patterns reveal momentum, reversals, or continuation of trends—making them highly valuable for timing trades.
1. Bullish Engulfing Pattern – Strong Buy Signal
Structure: A small red candle followed by a larger green candle that completely engulfs the previous day’s red candle.
Meaning: It indicates a strong reversal from bearish to bullish sentiment.
Best Used In: Downtrends or near support zones.
✅ Why It Works: It shows buyers stepping in with strong conviction, overpowering the previous day’s sellers.
2. Bearish Engulfing Pattern – Strong Sell Signal
Structure: A small green candle followed by a larger red candle that engulfs the previous green one.
Meaning: Suggests a reversal from bullish to bearish sentiment.
Best Used In: Uptrends, especially after a rally.
✅ Why It Works: It often signals that buyers are exhausted and sellers are gaining control.
3. Hammer – Bullish Reversal Pattern
Structure: Small body with a long lower wick, usually forming after a downtrend.
Meaning: Buyers rejected lower prices, showing potential for reversal.
Best Used In: Downtrends or oversold markets.
✅ Why It Works: Signals exhaustion of selling pressure and potential entry of buyers.
4. Shooting Star – Bearish Reversal Pattern
Structure: Small body with a long upper wick after an uptrend.
Meaning: Price attempted to rise but failed, indicating weakness.
Best Used In: Uptrends or near resistance.
✅ Why It Works: It highlights a failed rally, often followed by price correction.
5. Doji – Indecision, But Powerful with Confirmation
Structure: Very small body with long wicks, showing close is near the open.
Meaning: Market is undecided—watch for what happens next.
Best Used In: At the top or bottom of trends.
✅ Why It Works: Dojis often precede reversals, especially when followed by strong confirmation candles.
6. Morning Star – Bullish Reversal
Structure: A three-candle pattern: a long red candle, followed by a small body (Doji or Spinning Top), and a strong green candle.
Meaning: Shift from bearish to bullish momentum.
Best Used In: Downtrends or after corrections.
✅ Why It Works: Indicates transition from selling pressure to strong buying.
7. Evening Star – Bearish Reversal
Structure: Long green candle, followed by a small-bodied candle, then a long red candle.
Meaning: Sign of exhaustion in an uptrend, often preceding a downtrend.
Best Used In: Uptrends or after a bullish rally.
✅ Why It Works: Shows that buyers are losing steam and sellers are gaining control.
How to Maximize Profits with Candlestick Patterns
🔎 1. Combine with Support and Resistance
Candlestick patterns are more effective when they occur at key technical levels. For example, a Bullish Engulfing pattern at strong support offers a higher probability of success.
⚙️ 2. Use in Conjunction with Indicators
Pair candlestick patterns with tools like Relative Strength Index (RSI) or Moving Averages to confirm trend reversals or continuations.
⏱️ 3. Focus on Volume Confirmation
High volume on the reversal candle adds credibility to the signal. Volume confirms the participation of institutional players.
📈 4. Time Your Entry and Exit
Don’t trade on the pattern alone. Wait for confirmation candles or enter on the next candle’s break of the reversal level. Set clear stop-losses below/above the pattern for safety.
Final Thoughts
Candlestick Patterns are essential for anyone looking to understand price action and predict market behavior. When used correctly, patterns like the Bullish Engulfing, Hammer, and Morning Star can offer high-probability entry points for profitable trades.
What separates successful traders from the rest is not just identifying patterns but using them in the right context—with support, volume, and indicators backing them up. Simplicity, accuracy, and discipline are the keys to making candlestick patterns a reliable part of your trading strategy.
0 notes
Text
Decoding Advanced Chart Patterns: Double Tops and Head & Shoulders
Understanding Technical Analysis and Chart Patterns
Technical analysis largely depends on identifying visual indicators that hint at potential market movements. Among the array of tools available, chart patterns, such as the double top formation, remain a steadfast choice. The Double Top and Head & Shoulders patterns are among the most reliable and extensively studied formations. These reversal patterns, including the double bottom, aren't mere shapes on a chart—they symbolize the collective psychology of traders and the ongoing battle between buyers and sellers.
The Role of Double Tops and Head & Shoulders in Trading
This guide delves into the formation of these patterns, how traders can leverage them across various markets, and the common pitfalls to avoid. Whether you're involved in forex, stocks, or crypto trading, mastering the Double Top and Head & Shoulders patterns, as well as other continuation patterns, can provide a structured approach to your trading strategy.
What Makes Reversal Patterns So Powerful?
The Importance of Reversal Patterns in Market Analysis
Reversal patterns indicate a change in market direction. They suggest that the current trend—often bullish reversal—is losing steam and that a shift to bearish momentum may follow. This makes them especially useful for traders looking to time exits from long positions or enter new short setups.
Contextualizing Reversal Patterns for Better Trading Decisions
What separates strong patterns from false alarms is context. A Double Top or Head & Shoulders setup means little if the broader trend, volume, and momentum indicators don’t support the narrative. That’s why seasoned traders treat these patterns as part of a wider toolkit—not a standalone signal.
Psychological Insights from Reversal Patterns
Reversal patterns like the Double Top and Head & Shoulders are common reversal patterns are essential for identifying potential trend reversals. These patterns highlight a change in market sentiment, often signaling that the existing trend is weakening. By recognizing these bullish continuation formations, traders can anticipate shifts in the prevailing trend, allowing them to adjust their strategies accordingly. The psychological aspect of these patterns is crucial, as they reflect the collective emotions of market participants—fear, greed, and indecision—leading to potential market reversals.
The Double Top Pattern Explained
Formation and Mechanics of the Double Top
The Double Top forms when price action rallies to a resistance level, pulls back, then rallies again, only to hit the same resistance and drop. The inability to break the previous high shows fading bullish momentum. Once the neckline (the low between the two peaks) is broken, the pattern confirms, and a potential downtrend may begin.
Psychological Insights and Trading Implications
The psychological takeaway is simple: buyers tried twice to push higher but failed. Sellers begin to dominate, and traders may look to capitalize on the shift. This pattern is a classic example of a bearish reversal pattern. It occurs after an upward trend, signaling that the bullish momentum is weakening. The pattern forms when the price hits a resistance level twice, failing to break through, and subsequently declines. This failure to surpass previous highs indicates that buying pressure is diminishing, making it an opportune moment for traders to consider short positions.
Best Conditions for a Double Top Pattern to Work
Optimal Market Conditions
This pattern performs best after a sustained uptrend. If the price has been ranging or consolidating, a double top may not carry as much weight. For maximum effectiveness, traders should confirm the pattern with volume indicators or a trendline break.
Using Technical Indicators for Confirmation
Some traders use oscillators like the RSI to spot bearish divergence at the second peak, which can strengthen the case for a reversal. For the Double Top bearish pattern to be most effective, it is crucial that it follows a strong upward trend. This context provides the pattern with the necessary momentum to signal a reversal. Additionally, confirming the pattern with volume indicators or trendline breaks enhances its reliability. Traders often look for bearish divergence using technical indicators like the RSI to further validate the pattern's potential for signaling a trend reversal.
The Head & Shoulders Pattern: A Stronger Reversal Indicator?
Structure and Significance
The head and shoulders pattern is often viewed as one of the most reliable reversal signals. With its three-peak structure, it reflects a market that's struggling to maintain upward momentum. The left shoulder marks the first rally and pullback, followed by a stronger push upward to form the head. The final rally—the right shoulder—falls short of previous highs, showing weakness in buying pressure.
Confirmation and Trading Strategy
Once the price breaks below the neckline, the pattern confirms. This typically signals a shift from bullish to bearish sentiment. The Head & Shoulders pattern is revered for its reliability as a bearish reversal chart pattern. Its distinct three-peak structure provides a clear visual representation of waning bullish momentum. The pattern's formation, with the head being higher than the shoulders, signifies a weakening of buying pressure. When the price breaks below the neckline, it confirms the pattern, often leading to a significant downward trend.
What Makes Head & Shoulders Patterns So Reliable?
Psychological and Technical Aspects
Institutional traders often watch this pattern because of its psychological clarity. The inability to create a higher high after the head shows that bullish energy is fading. Volume tends to decrease during the formation and then spike during the neckline break, providing additional confirmation.
Versatility Across Timeframes
These patterns also occur across all timeframes, from 5-minute charts in day trading to weekly charts for swing traders. The reliability of the Head & Shoulders pattern, as well as the symmetrical triangle pattern, lies in its clear depiction of market psychology. Institutional traders, in particular, value this pattern for its ability to highlight the exhaustion of buying pressure. As the pattern forms, volume typically decreases, indicating a lack of conviction among buyers. The subsequent volume spike when the neckline breaks serves as a strong confirmation of the bearish reversal. This pattern's versatility across various timeframes adds to its appeal for traders seeking to identify potential trend changes.
Double Top vs. Head & Shoulders: What's the Difference?
While both patterns are bearish reversal signals, they differ in complexity and interpretation.
Double Top is simpler and quicker to form. It shows resistance at a single level and failure to break it.
Head & Shoulders is more gradual and involves a higher high (the head) before the final failure. It's often seen as more reliable but also requires more patience.
In essence, the Double Top reflects rejection at a known resistance, while the Head & Shoulders shows an exhaustion of buyers across three separate waves.
The key distinction between the Double Top and Head & Shoulders patterns lies in their structure and complexity. The Double Top is a straightforward formation, characterized by two peaks at nearly the same level, indicating a clear resistance point. In contrast, the Head & Shoulders pattern is more intricate, featuring three distinct peaks with the head being higher. This complexity often makes the Head & Shoulders pattern more reliable, as it reflects a more gradual exhaustion of buying pressure. However, it also requires traders to exercise patience in waiting for the pattern to fully develop.
How to Trade the Double Top Pattern Effectively?
To trade the Double Top:
Wait for confirmation with a neckline break.
Place a stop-loss slightly above the second peak.
Measure the height from the peak to the neckline and project it downward to estimate your target.
Volume confirmation is important. Ideally, the second peak should form on lower volume, and the break below the neckline should come with a volume spike.
Trading the Double Top pattern effectively requires patience and discipline. Traders should wait for the trend lines and pattern to confirm with a break below the neckline before entering short positions. Setting a stop-loss slightly above the second peak helps manage risk. To estimate a profit target, measure the height from the peak to the neckline and project it downward. Volume plays a crucial role in confirming the pattern's validity, with a lower volume at the second peak and a volume spike during the neckline break serving as key indicators.
How to Trade the Head & Shoulders Pattern?
With the Head & Shoulders:
Identify the three peaks and draw the neckline.
Wait for the price to break below the neckline before entering.
Place your stop above the right shoulder.
Measure the height from the head to the neckline and subtract that from the breakout point to project your target.
Some traders refine this further by using Fibonacci retracement levels for profit-taking zones.
Trading the Head & Shoulders pattern involves a systematic approach. Traders should first identify the three peaks and draw the neckline. Entry should occur only after the price breaks below the neckline, signaling a confirmed reversal. A stop-loss placed above the right shoulder helps protect against potential losses. To determine a profit target, measure the height from the head to the neckline and subtract it from the breakout point.
In addition to these steps, traders often incorporate technical indicators to enhance their strategy. For instance, using the Relative Strength Index (RSI) can help identify overbought conditions, which may coincide with the formation of the right shoulder, further validating the pattern's bearish reversal potential. Moreover, monitoring volume is crucial; a decrease in volume during the formation of the head and shoulders, followed by a volume spike upon the neckline break, strengthens the case for a trend reversal.
Furthermore, it's essential to consider the broader market context. Patterns that align with existing bearish trends or coincide with key resistance levels tend to be more reliable. By integrating these factors, traders can increase their confidence in the pattern and make more informed decisions.
Advanced traders might also look for confluence with other chart patterns or technical indicators, such as moving averages or Bollinger Bands, to confirm the reversal signal. This multi-faceted approach helps in filtering out false signals and improving the accuracy of trade entries and exits.
Overall, the Head & Shoulders pattern, when combined with a comprehensive market analysis and risk management strategy, can be a powerful tool for identifying potential market tops and optimizing trading outcomes.
Can These Patterns Work in Crypto and Forex?
Absolutely. Double Tops and Head & Shoulders appear across all asset classes, including forex and cryptocurrencies. However, in markets like crypto—where price movements, such as during a double bottom formation, are more volatile—false breakouts can be more frequent. That’s why volume and momentum indicators become even more critical in these environments. Traders often rely on these technical indicators to filter out noise and validate genuine trend reversals, ensuring that their trading strategies are robust against market volatility.
In forex, where liquidity and institutional order flow play a larger role, traders often pair these patterns with tools like moving averages, Bollinger Bands, or the ADX to validate breakouts. These additional tools help traders gauge the strength of the trend and the likelihood of a successful breakout, providing a more comprehensive market analysis.
How Institutions and Advanced Traders Use These Patterns?
Institutional traders rarely rely on patterns alone. Instead, they use them in conjunction with order flow, volume profile analysis, and key support/resistance zones. When large players spot a Double Top or descending triangle forming near a major resistance, they may begin building short positions slowly, causing subtle shifts in price that retail traders can learn to recognize. This strategic approach allows them to anticipate market reversals and position themselves advantageously before the broader market reacts.
This deeper layer of pattern interpretation can help traders avoid false signals and better time their entries. By understanding the underlying market dynamics and integrating multiple technical analysis tools, traders can enhance their decision-making process and improve their trading outcomes.
Should You Rely Solely on Chart Patterns?
Not entirely. While patterns like the Double Top and Head & Shoulders can help guide decisions, they’re not predictive guarantees. Successful traders use a combination of chart patterns, market context, volume confirmation, and strict risk management. This holistic approach ensures that they are not solely dependent on one signal but rather have a comprehensive understanding of market conditions.
Combining patterns with indicators like RSI, MACD, or moving averages can increase confidence. Some also use candlestick patterns—like bearish engulfing or shooting stars—as added confirmation near the peaks. This multifaceted strategy allows traders to cross-verify signals, including bullish reversal patterns, and reduce the likelihood of errors.
Real Market Example (Descriptive Only)
Let’s say a currency pair like EUR/USD climbs steadily over two weeks, topping out at 1.1100. After a pullback to 1.1030, it rallies again to 1.1098 but fails to break higher. Shortly after, the price drops below 1.1030 on rising volume. That’s a textbook Double Top. Such scenarios demonstrate the importance of volume analysis in confirming pattern signals, as rising volume during the breakout reinforces the bearish reversal pattern.
Now, imagine a stock forms a high of $150, drops to $140, climbs to $155, and then fails to get past $150 again before collapsing. If you spot the three-peak structure forming over a month and the neckline breaks below $140, you’re looking at a solid Head & Shoulders setup. Recognizing these formations early allows traders to capitalize on potential downward trends, optimizing their profit targets.
Why Learning These Patterns Still Matters in 2025?
1. Enduring Relevance of Chart Patterns
Even in a world dominated by algorithms and high-frequency trading, human behavior doesn’t change. These patterns reflect hesitation, fear, overconfidence, and loss of momentum—all fundamental aspects of market psychology. Understanding these psychological components can give traders an edge in anticipating market reversals and adjusting their strategies accordingly.
2. Improving Timing and Outcomes
Whether you're an active day trader or building a longer-term swing strategy, learning how to confirm Double Tops with volume or spot a Head & Shoulders setup before the neckline break can significantly improve your timing and outcomes. This knowledge equips traders with the ability to navigate complex market environments with greater precision and confidence.
3. Adaptability Across Markets and Timeframes
In addition to their psychological insights, these patterns remain relevant due to their adaptability across various markets and timeframes. As financial markets continue to evolve, the ability to recognize and interpret chart patterns like Double Tops and Head & Shoulders becomes even more crucial for identifying potential bullish reversals. These patterns, as seen on the price chart, provide traders with a framework for understanding market sentiment and potential trend reversals, regardless of the asset class or trading style.
4. Complementing Modern Analytical Techniques
Moreover, as more traders incorporate advanced technical analysis and machine learning tools into their strategies, the foundational knowledge of chart patterns serves as a valuable complement. By combining traditional pattern recognition with modern analytical techniques, traders can enhance their ability to identify profitable opportunities and manage risks effectively.
5. A Timeless Tool for Future Trading
As we move further into the future, the significance of chart patterns in trading will likely persist, offering traders a timeless tool to decode market dynamics and make informed decisions. Whether you're trading stocks, forex, or cryptocurrencies, mastering these patterns will continue to be a critical component of successful trading strategies in 2025 and beyond.
Enhancing Your Strategy with Pattern Recognition
Using chart patterns isn’t about memorizing shapes. It’s about understanding what the market is telling you. When used with the right tools—volume, support, and resistance, momentum indicators—they become powerful allies, including the bullish flag pattern, in building a more disciplined trading plan. This approach encourages traders to focus on data-driven decisions rather than emotional reactions, ultimately leading to more consistent trading success.
Patterns like the Double Top and Head & Shoulders provide structure, helping you avoid emotional trades and focus on setups with a statistical edge. And in a world where markets move fast, having that structure makes all the difference. By integrating these patterns into a broader trading strategy, traders can enhance their market analysis and improve their overall performance.
0 notes
Link
#BreakoutTrading#chartpatterns#ExplosiveMarketMoves#marketvolatility#MomentumTrading#priceaction#ProfitTaking#riskmanagement#StockMarket#supportandresistance#technicalanalysis#TradingSignals#TradingStrategy#TrendFollowing#volumeanalysis
0 notes
Text
Unlocking Smart Trading: How SEBI Registered Investment Advisors and Trade Ideas Help You Find the Best Stocks to Swing Trade
Introduction
In today’s dynamic financial markets, retail investors are constantly looking for smarter ways to generate returns. While long-term investing remains a solid strategy, swing trading has emerged as a popular method to profit from short- to medium-term price movements. But successful swing trading requires the right tools, guidance, and research. That’s where SEBI registered investment advisors and reliable Trade Ideas come in.
What Is a SEBI Registered Investment Advisor?
A SEBI registered investment advisor (RIA) is certified and regulated by the Securities and Exchange Board of India. These professionals are authorised to offer personalised investment advice to clients, ensuring compliance with strict regulatory standards. Working with a SEBI-registered advisor ensures that the recommendations you receive are unbiased, transparent, and tailored to your financial goals.
Why Choose a SEBI Registered Investment Advisor?
Trust and Credibility: Backed by SEBI regulations.
Tailored Advice: Investment strategies based on your risk profile.
Transparency: Clear fee structures and unbiased recommendations.
Regulatory Protection: Investors have recourse in case of misconduct.
The Power of Trade Ideas
Trade Ideas refer to carefully selected trading opportunities that are identified based on technical analysis, market trends, and fundamental research. These ideas are often generated by analysts or advisory platforms to help traders identify stocks with strong breakout potential or reversal setups.
What Makes a Trade Idea Valuable?
Data-Driven Insights: Based on market patterns and price action.
Timely Execution: Ideal for short-term trading opportunities.
Backed by Research: Combines technical indicators with macro trends.
Risk-Reward Balance: Highlights optimal entry and exit points.
Finding the Best Stocks to Swing Trade
Swing trading thrives on identifying stocks with strong momentum, volatility, and clear technical signals. The best stocks to swing trade are typically:
In a trending sector or theme (e.g., renewable energy, digital tech).
Showing bullish chart patterns like breakouts, flags, or cup-and-handle formations.
Supported by increasing trading volumes and favorable news sentiment.
Undergoing positive earnings revisions or institutional interest.
With the help of a SEBI registered advisor and expert trade ideas, traders can shortlist such opportunities confidently.
How to Combine Advisory with Trade Ideas
The real advantage comes when you combine both personalised advice and curated stock picks:
Advisory Backing: Get professional validation for trade ideas.
Risk Management: Use advisor strategies to limit losses and protect gains.
Diversification: Advisors help balance your swing trades with long-term holdings.
Consistent Learning: Improve your trading knowledge with expert feedback.
Conclusion
For traders aiming to make informed and confident moves in the market, the combination of a SEBI registered investment advisor, powerful Trade Ideas, and a disciplined swing trading strategy is invaluable. Whether you’re a beginner or an experienced trader, aligning your actions with credible insights and expert guidance will significantly enhance your chances of success.
Start identifying the best stocks to swing trade with the help of trusted advisors and market-tested trade ideas—because smart investing begins with the right partnership.
0 notes
Text
How to Trade the Bullish Engulfing Pattern: Complete Guide with Strategies
In the world of candlestick trading, price action patterns offer invaluable insights into market sentiment and potential reversals. One of the most powerful and frequently observed reversal patterns is the Bullish Engulfing Pattern. This pattern signals a shift from bearish to bullish sentiment, often preceding a strong upward move. In this blog post, we’ll explore: What the Bullish Engulfing…
#Best candlestick patterns for trading#Bullish Candlestick Patterns#Bullish Engulfing confirmation#Bullish Engulfing in downtrend#Bullish Engulfing in intraday trading#Bullish Engulfing Pattern#Bullish Engulfing pattern explained with examples#Bullish Engulfing setup#Bullish Engulfing trading strategy#Bullish Engulfing vs Bearish Engulfing#candlestick chart patterns#Candlestick reversal patterns#EMA bounce with candlestick patterns#engulfing candle setup#Engulfing candle trading strategy#Entry and exit strategy for Bullish Engulfing#High volume Bullish Engulfing#How to identify a Bullish Engulfing pattern#How to Trade Bullish Engulfing#intraday trading strategy#learn technical analysis#Price Action Strategy#Profitable Bullish Engulfing strategy for beginners#reversal trading signals#RSI and Bullish Engulfing#Stock trading patterns#Support and resistance trading#Swing trading with Bullish Engulfing#technical analysis#Technical Analysis Patterns
0 notes
Text
MACD Indicator: Spotting Buy and Sell Signals in Trading
Timing the market is one of the most challenging yet rewarding aspects of trading. Whether you are involved in stocks, forex, or cryptocurrency, knowing when to buy and when to sell is crucial for maximizing profits and minimizing losses. One of the most widely used tools to help with this is the MACD indicator, short for Moving Average Convergence Divergence.
The MACD is a popular momentum and trend-following indicator in technical analysis. It was developed by Gerald Appel in the late 1970s and has since become a key part of many traders’ toolkits. It helps you identify changes in the strength, direction, momentum, and duration of a trend in a stock or asset’s price.
In this article, we will explore how the MACD works, how to interpret its signals, and how you can use it in your trading strategy with confidence.
What Is the MACD Indicator and How Is It Calculated?
The Moving Average Convergence Divergence (MACD) is a trend-following momentum indicator that shows the relationship between two moving averages of a security’s price. At its core, MACD helps traders understand whether momentum is increasing or decreasing, which is useful for spotting buy or sell signals before the market makes a big move.
The MACD consists of three components:
1. MACD Line: This is calculated by subtracting the 26-period Exponential Moving Average (EMA) from the 12-period EMA. This line fluctuates above and below zero and reflects the difference between the short-term and long-term momentum.
2. Signal Line: This is a 9-period EMA of the MACD Line. It acts as a trigger for buy and sell signals. When the MACD Line crosses above the Signal Line, it can indicate a potential upward move. Conversely, when the MACD Line crosses below the Signal Line, it may suggest a downward move.
3. Histogram: The histogram represents the difference between the MACD Line and the Signal Line. When the histogram bars grow taller, the momentum is strengthening in the direction of the trend. When they shrink, the momentum is weakening.
These three elements work together to provide a visual representation of price momentum and possible trend reversals. Unlike some other indicators that lag significantly behind the price, the MACD attempts to provide early signals with a balance between responsiveness and stability.
Understanding MACD Crossovers and What They Mean
One of the most important things to learn when using MACD is how to recognize crossovers. These occur when the MACD Line and the Signal Line intersect. This intersection can be interpreted as a signal that the trend may be changing.
A bullish crossover happens when the MACD Line crosses above the Signal Line. This often suggests that upward momentum is building and that it could be a good time to consider buying the asset. It doesn’t guarantee profits, but it can be a strong signal in a broader bullish trend.
A bearish crossover occurs when the MACD Line crosses below the Signal Line. This is often seen as a warning that downward momentum is gaining strength, and it may be time to sell or at least be cautious about new long positions.
For example, let’s say you are analyzing a trading pair like SHIBUSDT. You might notice that the MACD Line has crossed above the Signal Line on the daily chart. Combined with a rising histogram, this could be interpreted as a sign that SHIB’s price is gaining upward momentum and that there may be an opportunity to enter a position.
Crossovers are among the most common MACD signals, but they work best when confirmed by other indicators or when used in combination with price action patterns.
The Importance of the MACD Histogram in Identifying Momentum
The histogram is an often overlooked but incredibly useful part of the MACD. It provides a clear, visual indication of how strong or weak the momentum is behind a trend.
When the bars on the histogram are growing in height, it means the MACD Line is moving further away from the Signal Line. This suggests that momentum in the current trend is increasing. If the histogram bars are above the zero line and growing, it often confirms a strong bullish trend. If they’re below zero and growing in size, it usually confirms a strong bearish trend.
On the other hand, if the histogram bars start to shrink, it signals that momentum is beginning to fade. Even if the trend has not yet reversed, this could be an early warning that a change is coming.
For instance, if you are monitoring SHIB/USDT and the histogram has been shrinking for several days while the price remains flat or starts to decline, this could indicate that buyers are losing strength. It doesn’t necessarily mean an immediate drop is coming, but it’s a sign to be more cautious and potentially tighten risk controls.
Using MACD Divergence to Spot Potential Trend Reversals
Another powerful feature of the MACD is divergence analysis. Divergence occurs when the price of an asset and the MACD indicator move in opposite directions. This is often a strong clue that the current trend may be weakening or about to reverse.
There are two main types of divergence:
1. Bullish Divergence: This happens when the price makes lower lows, but the MACD makes higher lows. It suggests that while the price is still declining, the selling momentum is weakening, and a reversal to the upside could be near.
2. Bearish Divergence: This occurs when the price makes higher highs, but the MACD makes lower highs. It indicates that the upward momentum is fading and that a downward reversal might follow.
Divergence is particularly useful when confirmed with other indicators like RSI or support and resistance zones. It is also more significant on higher timeframes (e.g., daily or weekly charts), where price movements carry more weight.
Imagine you are watching SHIB/USDT again. The price may be rising, forming new local highs, but the MACD is starting to slope downward. This bearish divergence could be your cue to start preparing for a potential retracement or reversal.
How to Use MACD in Your Trading Strategy
The MACD can be incredibly useful, but it should not be used in isolation. To build a well-rounded strategy, consider the following steps:
Start by identifying the overall trend using longer timeframes. If the trend is up and the MACD gives a bullish signal on a shorter timeframe, that’s a stronger setup.
Use MACD crossovers as entry or exit signals, but wait for confirmation. This could be a candlestick pattern, a break of a support or resistance level, or alignment with another indicator like RSI or Bollinger Bands.
Always manage your risk carefully. MACD, like all indicators, can give false signals—especially during periods of low volatility or sideways markets.
Backtest the MACD in your preferred market and timeframe. Some assets, like SHIB/USDT, may respond better to MACD signals on 4-hour or daily charts, depending on market conditions.
Common Pitfalls to Avoid When Using MACD
While MACD is a powerful tool, traders should be aware of its limitations. It is a lagging indicator, meaning it is based on past price data. As a result, it may signal a trade after a trend has already started or ended.
MACD also tends to perform poorly in range-bound or sideways markets, where price movements are small and inconsistent. In such environments, crossovers and histogram shifts can be misleading and lead to whipsaws.
Another common mistake is to treat MACD as a one-size-fits-all solution. Remember that each asset behaves differently. A strategy that works well on SHIB/USDT might not be as effective on Bitcoin or traditional stocks. Always adapt your use of MACD to the asset and market conditions you are trading.
Conclusion
The MACD indicator is one of the most reliable tools in a trader’s arsenal for analyzing momentum and identifying potential entry and exit points. By learning how to read MACD crossovers, histograms, and divergences, you can gain valuable insights into the strength and direction of market trends.
However, like any technical indicator, MACD should be used as part of a broader strategy that includes other forms of analysis and proper risk management. When used correctly, MACD can help you make more informed decisions and improve your overall trading performance.
0 notes