#ChartJS
Explore tagged Tumblr posts
Visit Tumblr Blog
Explore Tumblr blogs with no restrictions, modern design and the best experience.
Last Seen Tumblr Blogs


Fun Fact
Hackers stole 65M passwords from Tumblr in 2013.
Video
youtube
GAS-074 Create a Dashboard with ChartJS & Google Apps Script
0 notes
Video
youtube
How to Generate Dynamic Line Charts in PHP Using Chart.js
Whether you’re building dashboards, analytics tools, or reporting systems, mastering dynamic chart creation enhances your ability to showcase data effectively online.
Article Link: https://bit.ly/3UTZiXW.
0 notes
Text
Supercharge your Odoo18 Dashboard OWL skills! Master reactive sales dashboards with OWL, Chart.js, and ORM data. Step-by-step guide includes templates, JS component, and CSS. #Odoo #OWL #Dashboard #ChartJS #WebDev
0 notes
Text
Data Science project| How efficiently we can use ChartJS to plot a line chart? |
In Today’s we are discussing how efficiently we can use ChartJS and to plot a line chart? Our expert explaining how to rendering a chart using chartJS with the help of this video for our data science learners. Learn data science with Python in our python data science live project courses you will find how to build projects for scratch by your own. You will learn how to handle open-ended real-life challenges and problems that professional data scientists do. Our experts help you to unlock the doors, building your confidence and making you ready for an exciting new data science career.
With our Comprehensive Project-based data science courses covering all concepts and fundamentals of the Data Science process from Data Integration, Data Manipulation, Descriptive Analytics and Visualization and rendering chart with chartJS, Data Cleansing using Python, Statistical Analysis, Predictive Analytics and Machine Learning models, Data Cleansing using Python that can enable you to master in elements of Data Science. The Most demanded Industry pattern for Project with Data Science Certification Course by BISP.
#chartJS#project data science#Data Cleansing in Python#Data Science advanced certification course#chart rendering in chartJS
1 note
·
View note
Text
64. Catch Up!
GUYS! I didn’t abandon you! I’ve just been working...working really hard. Updating an hour a day began to be too much to keep up with and instead of stubbornly sticking to that just because I have always done it, I gave myself a much needed break and reassessment. It wasn’t worth it with all the other stuff I had to, so I had to drop the load a bit...Project weeks are among us. We were assigned to build our own web app in four weeks! We are now in week 3 and things are going...pretty well, y’all! I love my project, I love my idea, my mentors, peers and teachers love it. I’m feeling really good. I’ve had a lot of ups and downs with it, have fixed a ton of bugs, and have learned a lot. I have pushed myself beyond boundaries I thought I couldn’t cross and have blown past them. I had finished my MVP (minimum viable product to hand in as a done project) in a week. Scraping the data and cleaning my database were the most time consuming, but I wanted to spend the most on that because I knew part of my project’s magic WAS the data. As a former data analyst and Econ major trying to move away from that title, I was advised and tried not to make my project so data heavy, but I guess some lives just choose you...I’m alright with that.

My project involves...music...I’m not going to say much more. I want to wait until I get it cleaned and hosted before I reveal anymore. I used Genius’ API and talked about my excitement of my project to a recruiter I know at Genius. I had been thinking of him throughout my project building and wanted to show him. To my surprise, he looked at my LinkedIn off of private. We have not had a conversation in years, nor have I seen him on my page for years, so the fact that he looked at my profile while he has no clue I have been thinking of sharing my project with him, makes me feel that that was more than coincidence. I always know that God is working and is planning things, but some of my moves are not aligned with what he made me to be, I don’t think, because of my free will. Of course he knows I am going to do it, but he also gives me free will to test me. It is times like these where I feel like my head, body and soul are aligned with where he wants them to be.
I work on this every chance I get, turning down invitations to party. During the 1st project week, I attempted, but never actually exercised. I felt gross. I don’t get as much water down as I used to, which was already not much, and sometimes I skip meals if I get REALLY locked into fixing a problem. I know the answer or resolution to my problem is on the other end of some hard work. I have had a drive for this unlike any other thing I have had in my life besides God. I can’t wait to share it, host it, sell ad space on it, pitch it to Genius and my other interviewers. I am more focused on this than my other secular loves: cheer, running, pretty dudes that aren’t good for me :). I could not imagine having this drive for finance or any of my previous roles.
A lot of people come to me for help nowadays and I have become even more comfortable at school. I do not get to speak to my folks as often, but they send me their love. My mom told me how proud of me she was and that really warmed my heart. She has always supported me, but to remind me of this randomly as I’m half-way through my program is great. It is so warming to know that while she’s working, she is proud of me and so inspired to reach out and call me to tell me that, “Hey, I know you’re working hard. I just wanted to tell you that I love you and am so proud of you.”

This has been such an incredible experience. I have received so much support and it feels like so many people are down for the cause with me. I am so glad I chose what I wanted to do. I am so glad that I knew that this is what I wanted to do and I did not want to settle for anything else because I knew I really wanted to give this a go. I know this is camp and I know a lot will change in the “real world”, but I’m ready for it.

I’ve had some more informational interviews with people from Netflix, Uber and start-up owners. They each have offered to reach out or make referrals on my behalf. Random friends have reached out to introduce me to folks that will help me in my career (thank you, Cristian! <3). Some friends have sent me handwritten letters (thank you, Armine! <3). Shout out Trent...just because...I feel really connected to my mentors.
One teacher made me feel targeted. Sometimes, I am the last in the lab and ignore the announcement to return to lecture when it is time and she will come stand right next to me to get me to come to lecture as if I did not hear the gong ring. Well, I needed help one day and reached out on Slack. She picked it up, and although I thought, “Aww damnit!,” when she did, she helped me understand a HUGE part of my program that, once it was fixed, gave me so much autonomy to build. We connected, and I threw out whatever stupid assumptions/judgement I dreamt up about her. I like to think I am not judgmental, but man I am. I just feel that way because I hate being right when I think negatively about people.
Back to the positivism: I really love the church I am going to, I am happy single and I am excited for what is to come. I broke off a “texting” relationship with a person I kinda liked and kinda worried about how it would distract me. I’m glad that I remember him maybe once or twice a week. I also received a text from a person I really liked, still kinda do, who found out about my camp and wished me luck. I didn’t even cry about him! LOL! In the words of Ariana Grande, “Thank you, NEXT!!” :) I am very locked in.

White-boarding has been going well. I was a bit anxious, but I treat it like all the other technical skills I am learning and try to practice it everyday.

I also do not get as many hunger headaches. Of course, I work out a little bit less, and eat a little less strictly. I could get more sleep at night too, but we’re almost to the finish line!
What I’m craving right now? Pancakes or a crispy savory crepe...and a movie night!!
Thank you all for reading, checking in on me. Your likes, follows, questions, and comments keep me motivated. Even if some of you say nothing, your silent support is encouraging!

#women in engineering#engineering#coding#bootcamp#coding bootcamp#black woman#black women#stem#women in stem#economics#d3#chartjs#python#html#full-stack#full-stack engineering#web development#full-stack web development#silicon valley#san francisco#sf#bay area#school#student#studying#woman
2 notes
·
View notes
Text
How To Use Chart JS In Laravel

The fundamentals of Chart.js are quite straightforward. First, we must install Chart.js into our project. Depending on the settings of your project, you may be installing it using npm or bower, or you may link to a constructed version via a CDN or clone/build from GitHub. Simply connecting to the created CDN version in the sample's blade file would suffice for this brief example. A The fundamentals of Chart js are quite straightforward. First, we must install Chart js into our project. Depending on the settings of your project, you may be installing it using npm or bower, or you may link to a constructed version via a CDN or clone/build from GitHub. In our examples, we'll only link to the built-in CDN version for the purposes of this brief demonstration. We'll just plot the ages of the app users in this case. We're presuming you've already set up the Laravel auth scaffolding and carried out the required migrations to make a Users table. If not, take a look at the information here or modify it for the model you're using for your chart's data. Therefore, before creating any users at random, we'll first add an age column to our Users table. For more information, see our post on how to use faker to create random users, however for this demonstration, let's make a database migration to add an age column by using: add age to users table php artisan make:migration —table='users' To change the up function to: edit this file in the database migrations directory. Schema::table('Users', function (Blueprint $table) { $table->int('age')->nullable(); }); Run php artisan migrate after that, and your Users table should now contain an age column. Visit /database/factories/UserFactory now, and add the following at the end of the array: 'age' is represented by $faker->numberBetween($min = 20, $max = 80), The complete return is thus: return ; Run the following commands to build a UsersTableSeeder: make:seeder UsersTableSeeder in PHP This will produce UsersTableSeeder.php in the database. The run function should include the following: factory(AppUser::class, 5)->create(); When this is executed, 5 users will be created; modify 5 to the number of users you need. After that, we must open DatabaseSeeder.php in /database/seeds and uncomment the code in the run() function. Finally, execute php artisan db:seed. Five new users should appear, each of whom has an age. For our Charts page, we will now develop a model, controller, views, and routes. Run the following command in PHP: make:controller ChartController —model=Chart. To the file /app/Http/Controllers/ChartController.php, add the following: use AppUser; use AppChart; use DB; ... public function index() { // Get users grouped by age $groups = DB::table('users') ->select('age', DB::raw('count(*) as total')) ->groupBy('age') ->pluck('total', 'age')->all(); // Generate random colours for the groups for ($i=0; $ilabels = (array_keys($groups)); $chart->dataset = (array_values($groups)); $chart->colours = $colours; return view('charts.index', compact('chart')); } The random colour scheme is one example of the exciting things you can do with the controller's data, though you can also specify hardcoded colours if you'd choose. In /resources/views/charts/, we must now create an index.blade.php file and add the following (depending on your blade setup and layout; here is an example): Laravel Chart Example Chart Demo Finally, we need to add the following to /routes/web.php: Route::get('/charts', 'ChartController@index')->name('charts'); Go to at your-project-name.test/charts now. Although this should serve as a good starting point for your understanding of the fundamentals of charts and graphs in Laravel, you may refer to the Chart.js documentation for more details on customizing your charts. Read the full article
0 notes
Text
Eleven - Multi-Purpose Bootstrap Admin Template
Eleven – Multi-Purpose Bootstrap Admin Template
Eleven – Multi-Purpose Bootstrap Admin Template is a creative admin template which comes with a React Next.js variant, angular variant, gohugo variant as well as an HTML/CSS/JS version. It comes out of the box with support ffor light and dark colour schemes, animated icons as well as a myriad of other features. With this, you get all you need to start working on your React/Angular/HTML SAAS, CRM,…

View On WordPress
#admin#angular#bootstrap#chartjs#dark mode#dashboard#Hugo#javascript#lottie#modern#nextjs#react#reactjs#responsive#sass#SSR
0 notes
Text
Building a COVID-19 Dashboard with Vue.js and Chart.js - Diligent Dev
Building a COVID-19 Dashboard with Vue.js and Chart.js – Diligent Dev
In this tutorial, we’ll be using Vue.js and Chart.js to build a COVID-19 dashboard. We’re living in some scary times right now. With COVID-19 tearing through the … source

View On WordPress
0 notes
Text
Graph Template
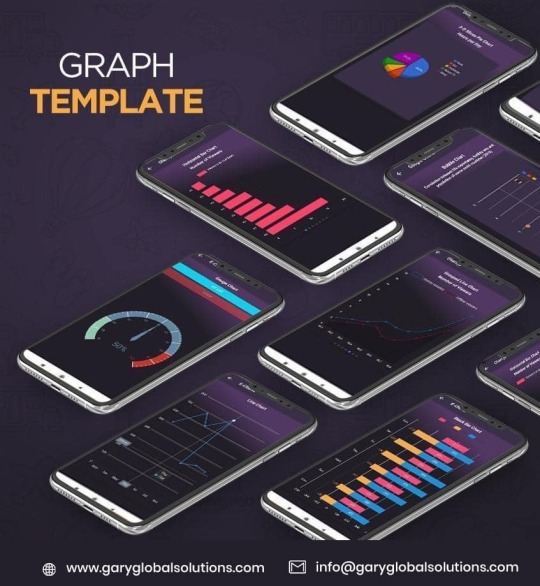
Easily integrate your graphs into your Ionic App with the help of our amazing Ionic Graph Template. Libraries Supported : 1. Chart.js 2. D3.js 3. E-charts 4. Google charts Check it out Experience the New Era of Online Graph with our Ionic 4 Graph Template To Purchase please click on the below link : https://market.ionicframework.com/themes/ionic-4-graph-template or http://garyglobalsolutions.com/items.php?item_id=ionic-graph-template Download the app using this link : https://play.google.com/store/apps/details?id=io.ionic.graph&hl=en_US Connect With Us: https://www.garyglobalsolutions.com/ You Can Also Follow Us For Regular Updates Facebook:
https://www.facebook.com/garyglobalsolutions/
Youtube: https://www.youtube.com/channel/UCADKPh7m7trTYXs1RDftDnQ… Linked In: https://www.linkedin.com/company/gary-global-solutions/
#ERPManagementAgency#ERPmanagementCompany#DigitalMarketingCompany#ERPmanagement#ERPdevelopment#DigitalMarketing#GaryGlobalSolutions#GaryGlobals#checkitout#mobileapps#graphtemplate#mobileapp#webdeveloper#developmentteam#applications#developers#Ionic4#GoogleChart#Chartjs#Graph#Ionic
0 notes
Photo

How to create dynamic visualizations with Cube.js and Chart.js ☞ https://morioh.com/p/9671be18ea7b #Cube #Chart #Morioh
0 notes
Photo

How to create dynamic visualizations with Cube.js and Chart.js ☞ https://morioh.com/p/9671be18ea7b #Cube #Chart #Morioh
0 notes
Photo

Hello #devs 👀🧙♂️ - Today I started learning Redux Saga. I learnt about generator functions in JavaScript and how they are used in Saga. So far I liked the concept but it's very difficult to get used to. - I love Redux thunk because of it's simplicity which I did not find in Saga. I'll continue learning more about it and it's implementation in my project. Although I'm going to branch out to not modify my previous code that's using Thunk. - I also created some charts for a client's trading website. I found about a new (for me) chart library named apex charts. I loved it in compare to #chartjs - What are you working on? Tell me in the comments 🤙🏻🔥 . . . . . . . . . . . . . . . . #javascript #softwaredeveloper #webdev #html5 #programmerlife #programmerslife #jquery #coderlife #frontenddeveloper #buildtheweb #webdevelopers #programmingisfun #iosdeveloper #codingbootcamp #peoplewhocode #codelife #fullstackdeveloper #backenddeveloper #codingdays #vue #vuejs #javascriptdeveloper #reactjs #wordpress #woocommerce #linux #ui #ux https://www.instagram.com/p/B-cVH-Mga3D/?igshid=v7zdoyk4d41d
#devs#chartjs#javascript#softwaredeveloper#webdev#html5#programmerlife#programmerslife#jquery#coderlife#frontenddeveloper#buildtheweb#webdevelopers#programmingisfun#iosdeveloper#codingbootcamp#peoplewhocode#codelife#fullstackdeveloper#backenddeveloper#codingdays#vue#vuejs#javascriptdeveloper#reactjs#wordpress#woocommerce#linux#ui#ux
0 notes
Photo

How to create dynamic visualizations with Cube.js and Chart.js ☞ https://morioh.com/p/9671be18ea7b #Cube #Chart #Morioh
0 notes
Text
Project Data Science | Getting Started with ChartJS | ChartJS Tutorials|
The right visualization can give your analytic app or dashboard the punch to make it truly great. Visualize with Power is your destination for the visualization best practices that will make your work truly stand out from the crowd. The same concept we are discussing in this video tutorial, how we can use chartJS to visualize our data. We are starting with basics of chartJS, what is chartJS? Our expert explaining how to rendering a chart using chartJS with the help of this video for our data science learners.
We are offering live project working with our Advanced data science certification training. This is not just a training candidate really work on real project from the very beginning of the training. We are sharing all our real scenario experience and knowledge with the help of data science project training. In this Data Science Certification Training with project Building, where we teach you how to build a project from scratch with Data Science skills and practice mode helps you sharpen them.
With our Comprehensive Project-based data science courses covering all concepts and fundamentals of the Data Science process from Data Integration, Data Manipulation, Descriptive Analytics and Visualization and rendering chart with chartJS, Data Cleansing using Python, Statistical Analysis, Predictive Analytics and Machine Learning models, Data Cleansing using Python that can enable you to master in elements of Data Science. The Most demanded Industry pattern for Project with Data Science Certification Course by BISP.
youtube
#chartJS#Data Cleansing in Python#Data Science advanced certification course#chart rendering in chartJS#Data wrangling in Python
1 note
·
View note
Photo

How to create dynamic visualizations with Cube.js and Chart.js ☞ https://morioh.com/p/9671be18ea7b #Cube #Chart #Morioh
0 notes
Photo

Build Ionic 4 Apps with Chart.js for Beginners
☞ http://bit.ly/2Pe28Fm
#Ionic #Chart.js #javascript
0 notes