#CircleChart
Explore tagged Tumblr posts
Visit Tumblr Blog
Explore Tumblr blogs with no restrictions, modern design and the best experience.
Last Seen Tumblr Blogs


Fun Fact
In Q3 of 2020, 31% of US users access the Tumblr app daily.
Text

Jimin fue el artista con más posiciones en el puesto número 1 de la lista global de K-pop de Circle en 2024 (84 veces en total)
CIRCLE_CHART X 9 ene. 2025 CIRCLE CHART 2024년 연말결산🖤
세계에서 가장 많이 사랑받은 케이팝 아티스트는? 💕
· 집계 기준 2024년 일간 글로벌K-pop차트에서 1위를 가장 많이 한 아티스트
써클차트연말결산 #써클차트연말결산2024
써클차트 #CIRCLECHART
지민 #JIMIN
CIRCLE CHART Liquidación de fin de año 2024 🖤
¿Quién es el artista de K-pop más querido del mundo? 💕
· Criterios de agregación En la lista diaria mundial de K-pop en 2024 Artista con mayor ranking #1
써클차트연말결산 #써클차트연말결산2024
써클차트 #CIRCLECHART
지민 #JIMIN
#park jimin#jimin#지민#jiminshiii#amor a mis chicos jmjk#써클차트연말결산#JIMIN#써클차트#Jimin x CIRCLE_CHART#써클차트연말결산2024#cr. a CIRCLECHART#Jimin fue el artista con más posiciones en el puesto número 1 de la lista global de K-pop de Circle en 2024
5 notes
·
View notes
Text
240110 official_nct tiktok update
make me water〰️ #MARK #YEONJUN #NCTDREAM #NCT #TOMORROW_X_TOGETHER #투모로우바이투게더 #TXT #CIRCLECHART #CCMA2023 #써클차트 #써클차트뮤직어워즈2023
60 notes
·
View notes
Photo

📸 #msphotograph Posted @withregram • @circlechart . CIRCLE CHART MUSIC AWARDS 2022 🖤 오피셜 포토 대방출! @aespa_official 더 많은 CCMA 2022 정보가 궁금하다면? 프로필 링크 Click! #aespa #에스파 #CIRCLECHART #써클차트 #CIRCLECHARTMUSICAWARDS #써클차트뮤직어워즈 #CCMA #concert #photography #concertphotography #livemusic #music #musicphoto #festivalphotography #daily #view #design #musicphotography #audioloveofficial #bestmusicshots #liveconcertphotography #gigphotography #konsertfoto #htbarp #photographer #gig #live #music #concert https://www.instagram.com/p/CqRw9vLpvIp/?igshid=NGJjMDIxMWI=
#msphotograph#aespa#에스파#circlechart#써클차트#circlechartmusicawards#써클차트뮤직어워즈#ccma#concert#photography#concertphotography#livemusic#music#musicphoto#festivalphotography#daily#view#design#musicphotography#audioloveofficial#bestmusicshots#liveconcertphotography#gigphotography#konsertfoto#htbarp#photographer#gig#live
5 notes
·
View notes
Text
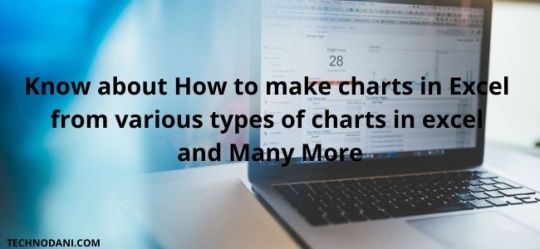
How to Make Chart in Excel [Easy and Practical] 2021

In this article, we will discuss how to make charts in Excel from various types of charts in excel, such as Graphs charts, bar charts, line charts, pie charts, and others. As you all know, Microsoft Corporation as the owner of the Excel application has made many improvements to its applications. This is evident from the many versions of Microsoft Excel that are sold in the market. However, is the way to make a chart in Excel the same in different versions? The answer is yes, almost the same. The only difference lies in the Excel ribbon menu used. But basically, the way of making it is the same. Then, do you already know how to make charts in Excel? If not, you are lucky to have found this article.
How to make charts in Excel from various types of charts in excel But before that, it would be better if you know the function of each type of graph so you don't use it wrong.
About Microsoft Excel
Microsoft Excel is a useful and powerful program for data analysis and documentation. It is a spreadsheet program, containing a series of columns and rows, where each intersection of column and row is a "cell". Each cell contains a data point or piece of information.
Types of charts in excel
Did you know that each type of charts in Excel tends to have a different function? Also, learn excel formulas to make it easier for you to process data. So here, there are types of charts in Excel that we have mention below for you and if you want to know about the full explanation on the type of charts in Excel then read the full article below. - Column Chart - Line Chart - Pie Charts (Circle Chart) - Bar Charts - Surface Charts - Stock Charts Here are some explanations about the type of charts in Excel that are suitable for certain data. 1. Column Chart (Chart Column) A column chart is a data visualization where each category is represented by a rectangle, the height of the rectangle is proportional to the plotted value. Column charts are also known as vertical bar charts. This type of graph is very suitable for comparing data or showing a change in data over a certain period of time. For example, a chart of brand preference with the type of cola.
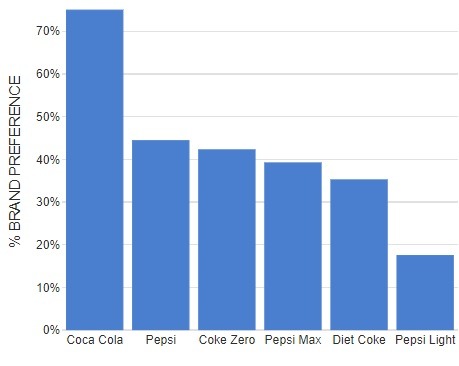
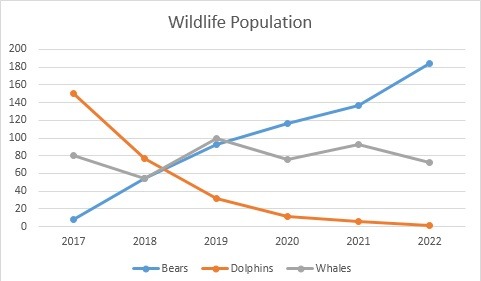
Column Chart-Image source: displayr.com 2. Line Chart (Figure Line) This chart is suitable for displaying continuous data and is very effective in identifying a pattern or trend. Therefore, it is common for people to use these graphs to display data trends at certain time intervals. For example, to display the Wildlife population.
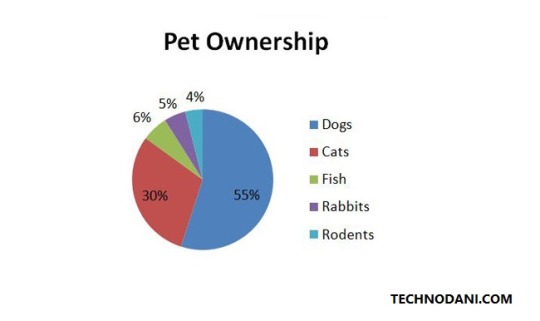
Line Chart 3. Pie Charts (Circle Chart) Next up is the circle chart type. This circle graph is used to show the proportion of an item in the data. Usually, the value of the items in the data is shown as a percentage. For example, the percentage of Pet ownership.
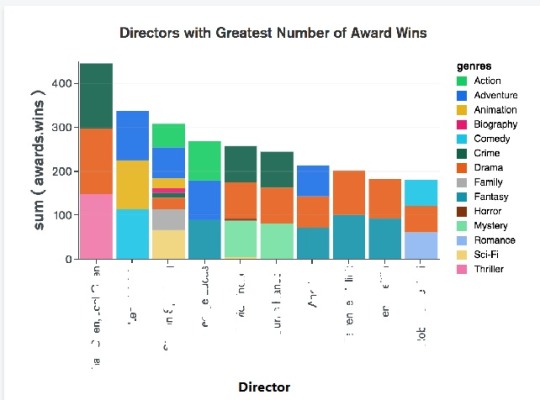
Pie Charts 4. Bar Charts This graph is usually used to compare several items. For example, to graph about Directors with the greatest Number of Award Wins.
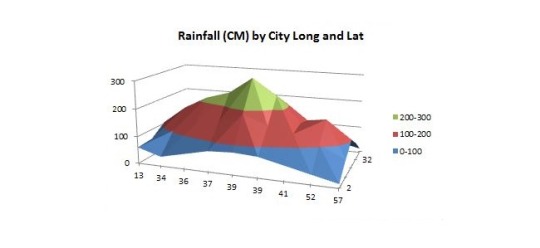
Bar Charts 5. Surface Charts (Graph Surface) This type of graph is very suitable to be used to find the optimal combination of two data sets. For example, in a topographic map or to illustrate the effect of Rainfall (CM) by city Long and Lat.
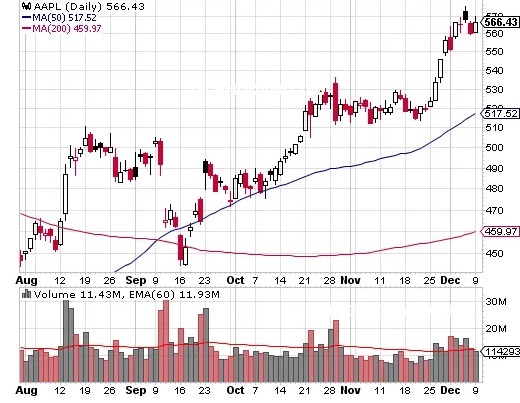
Surface Charts 6. Stock Charts (Graph Stock) Next are stock charts or stock charts. Usually, this type of chart is widely used to describe fluctuations in stock prices. However, not only for describing stocks, but you can also use this type of graph for scientific data, for example, to show temperature fluctuations.
Stock Charts
How to Make Various Types of Charts in Excel
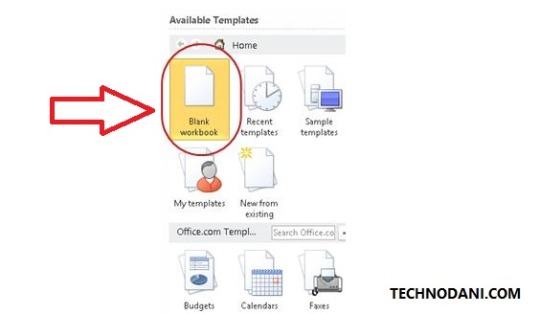
- Open your Microsoft Excel on your System. - Select "Blank Workbook". This means that you will create new data on a blank Excel sheet.
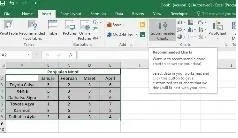
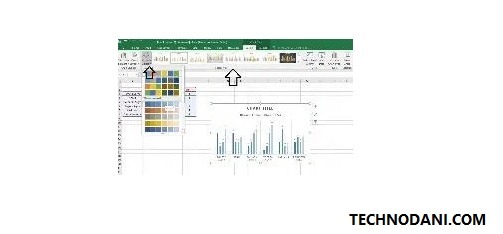
How to Make Various Types of Charts in Excel - Enter the data for which you want to graph. For example, here is made the sales data for several types of cars from January to April. - When all the data is ready, block all the tables you want to chart and select "Insert" from the menu. Now, on the "Insert" menu there are many types of charts that you can choose from. If you are confused about which one, you can try clicking "Recommended Charts".
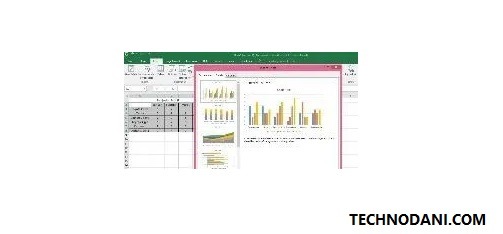
How to Make Various Types of Charts in Excel - The "Insert Chart" window will automatically appear. In this window, you can see the recommended chart forms and all the chart types available in Excel. The sample chart will also automatically fill in the data from the table that you have created.
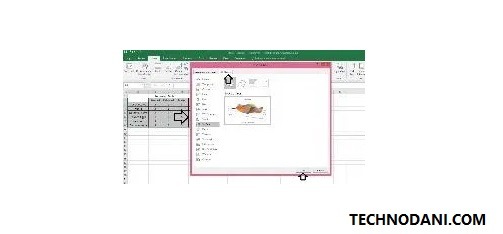
Insert chart - If you feel that the chart options on the "Recommended Charts" tab are not suitable, you can select the "All Charts" tab. You can see all types of charts in Excel on that tab. After selecting a suitable chart, press "OK".
All Charts - After pressing "OK", your chart will automatically appear along with a menu to design it. On the "Design" menu, you can choose the color you want to use along with the table forms. Try them one by one and choose according to your needs.
the process of making charts in excel - In the example table, the chart generated automatically by Excel has no title so it says "Chart Title", you can edit it by hovering over the text and pressing it.
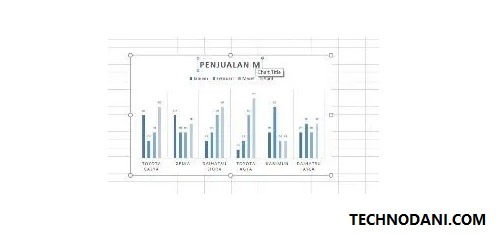
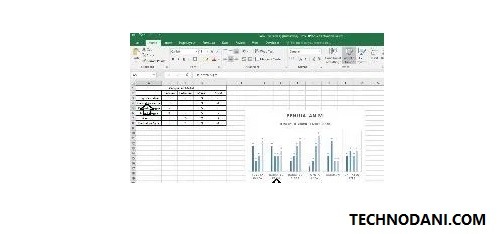
Chart Title - Apart from editing the chart title, you can also change the existing content on the chart through the table that has been created. Once you edit the data in the table, the graph will automatically update the data. You can see the result as an example below.
how to make a chart in excel finished
How to Make a Chart in Excel
Graphs or sparklines in Excel are great for showing trends in a series of values, such as highlighting minimum and maximum value cycles, economic cycles, sales results, and more. In addition, it is also great to use sparklines when you don't have enough space to place a large chart. Adding sparklines to the data you are working with will further clarify what is contained therein. Here's how to add sparklines. - Select a blank cell where you want to place the sparkline.
How to Make a Chart in Excel - empty cells - Select "Insert"> "Sparkline". After that, select the sparkline type you want to create such as rows or columns.
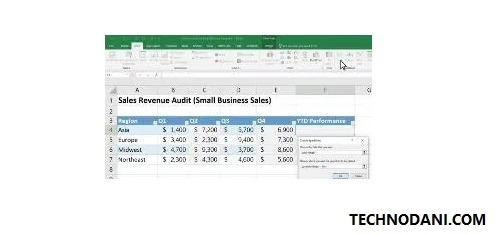
select the sparkline type - Then, select the cells in the row or column you want to chart and press "Ok" when you're done.
select the cells in the row - If you want all the data in the table to have sparklines, you can simply position the cursor in the lower-left corner of the cell that already contains the graph. When the black plus sign (+) appears, drag it down. Then, automatically all your data will have a sparkline.
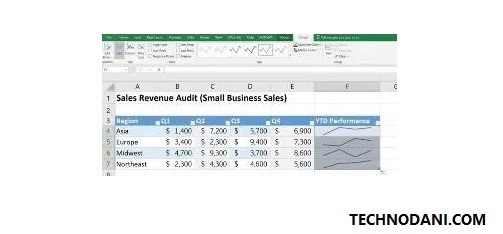
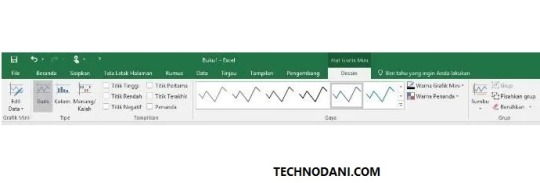
How to Make a Chart in Excel - After all, sparklines have been created, you can also customize the design by pressing the "Design" menu. In the design menu, you can choose the color of the graphic, the shape of the graphic, and so on according to your needs.
Sparkline design Related Article: How To Draw A Graph In Microsoft Word In 2020 Easily
How to Make a Chart in Excel with 2 Data
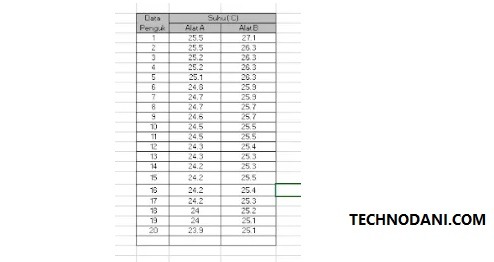
- Open Excel and create the data you want to graph. This time we will make an example of temperature comparison data that is measured with different tools.
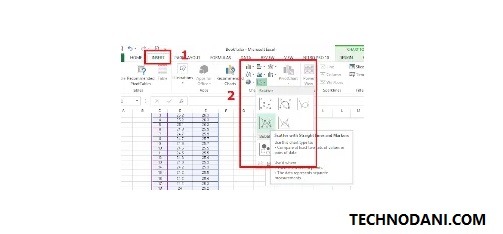
temperature comparison data - Then, place the cursor outside the table and click the "Insert" menu. Then select the desired chart type. In this example, the chart with the type Scatter will be selected.
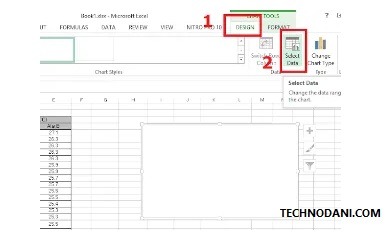
select the chart type - After that, a blank chart will appear on the worksheet. Click on the graphic and open the "Design" menu. Choose "Select Data".
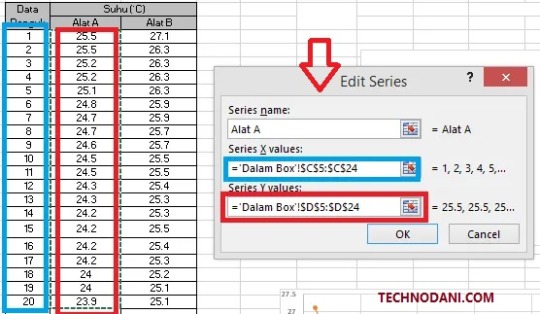
Click the graph - Then "Select Data Source" window will automatically appear. After that, press "Add" and enter your data. In series name, fill in the name of the data, fill in series X with values on the X-axis, and series Y fill with values on the Y-axis. After that, click "OK".
Select Data Source - Do the same for the second data.
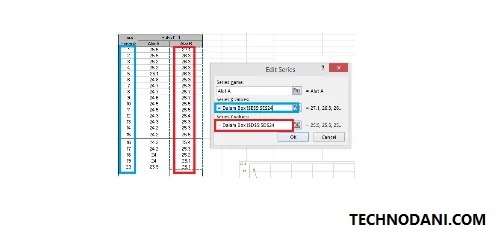
Insert second data - After all, data has been added, click "OK" on the "Select Data Source" window and the chart will appear on your worksheet.
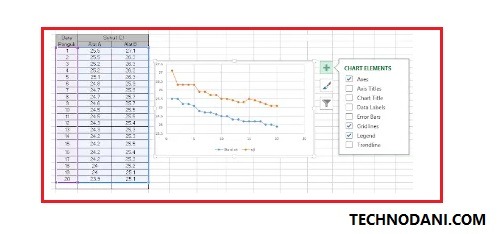
Select Data Source Else watch the video tutorial on how to make Graphs in Excel or How to Make a Chart in Excel.
Conclusion
Well, guys, Graphs in Excel are very widely used by people to explain the data they create. With graphs, people tend to find it easier to read data because it contains text and images. Hopefully, this way of making charts in Excel can help you. Also Read: What is ping test in Games, Internet Speed Test 2021 How to Reduce Photo Size on Computer, Mac, and Android 2021 How to Repair External Hard Drive Corrupted and Unreadable Fix Win & Mac 2021 Read the full article
#BarCharts#chart#chartappearance#chartformatting#chartsinexcel#chooseadesign#CircleChart#ColumnChart#create#createadatatable#different#education#excel#excel2007tutorial#excel2010#excelchartexamples#excelcreatecharts#excelfordummies#exceltutorials#fetchdataintothechart#graph#graphs#how#howto#howtocreateachartinexcel2010#howtocreateachartinexcel2016#howtocreateagraph#howtocreateagraphinexcel#howtocreateapiechartinexcel#HowtoMakeaChartinExcel
0 notes
Text


[230219] pledis_17 twitter update
캐럿들이 선물해 준 소중한 선물 🏆🏆 파이팅 넘치는 부석순의 무대도 잘 보셨죠 ❗️❗️ 캐럿들 항상 셉랑해 💎❤️ #세븐틴_지지고_볶고_렛츠고🔥 #써클차트 #CIRCLECHART #CIRCLECHARTMUSICAWARDS
13 notes
·
View notes
Photo


230218 - SEVENTEEN Twitter update
@pledis_17: [17'S] #써클차트뮤직어워즈
캐럿들이 선물해 준 소중한 선물🏆🏆 파이팅 넘치는 부석순의 무대도 잘 보셨죠‼️ 캐럿들 항상 셉랑해💎💕
#세븐틴_지지고_볶고_렛츠고🔥 #써클차트 #CIRCLECHART #CIRCLECHARTMUSICAWARDS
7 notes
·
View notes
Text
[230218] Yujin - Circle Chart TikTok update: 12th Circle Chart Music Awards
🎤: What is today's little happiness? 🐰: I'll have a late-night snack when I'm done 🥰
Source: https://www.tiktok.com/@circlechart/video/7201520108232133889
2 notes
·
View notes
Video
youtube
써클차트 뮤직 어워즈 2022 무대직캠 ㅣ #스테이씨 #STAYC https://youtu.be/uzjtjZFh0jA 많이 미숙하지만 현장의 분위기를 여러분과 함께 공유하고 싶어 업로드를 진행하게 되었습니다 *_* 내년에는 조금 더 발전된 모습의 직캠영상으로 찾아뵙겠습니다 감사합니다. 올해의 월드루키상 STAYC #STAYC #스테이씨 #BEAUTIFULMONSTER #RUN2U #TEDDYBEAR #CIRCLECHART CIRCLE CHART
0 notes
Text
36+ Best jQuery Graph Plugins & Tutorials with Demo 2017
36+ Best jQuery Graph Plugins & Tutorials with Demo 2017
Graphics in packages like Photoshop may be created each statistically and dynamically. Creating photos the use of statistical strategies is a bit hard while as compared to dynamical strategies. Here are the few jQuery Graph Plugins to help you generate charts or tables: 1. circleChart : jQuery plugin for Drawing Circular Charts CircleChart is a small jQuery plugin is useful for developing easy…
View On WordPress
0 notes
Text
アニメーションする円形チャート実装jQueryプラグイン「circleChart」
GitHub - TheBolliwood/circleChart: jQuery plugin for circular charts&n... http://j.mp/2nxcpwR phpspot開発日誌
0 notes
Text

Jung Kook 'Circle Chart Music Awards 2023'.
🏆Artist of the Year — Digital 🏆Artist of the Year — Physical Album 🏆Artist of the Year — Global Streaming
Digital Part (Seven - Clean Ver.)
Physical Album Part (GOLDEN)
Global Streaming Part (Seven - Explicit Ver.)
Jungkook ganó 3 de 4 categorías de Artista del Año en los Circle Chart Music Awards
— Es el único artista solista que ganó múltiples categorías AOTY este año.
— Es el primer solista que gana el AOTY - Álbum físico en 4 años.
— Jungkook se convirtió en el PRIMER ARTISTA SOLITARIO en la historia de los Circle Chart Music Awards en ganar las categorías de álbum físico y digital al mismo tiempo, y fue honrado con los MOST SOLO ARTIST AWARDS este año.
— Jungkook es el PRIMER SOLISTA en ganar simultáneamente el premio “Artista del Año” en las categorías Digital y Física en los Circle Chart Music Awards
circlechart instagram sale jungkook CIRCLE CHART MUSIC AWARDS 2023 🖤 써클차트 뮤직 어워즈 2023!
✨정국 (Jung Kook) @bts.bighitofficial 3관왕을 축하해요! -올해의 가수상 글로벌 스트리밍 부문 -올해의 가수상 써클지수 부문 -올해의 가수상 앨범 부문
#정국#JUNGKOOK #CIRCLECHART#써클차트 #CIRCLECHARTMUSICAWARDS#CIRCLECHARTMUSICAWARDS2023 #써클차트뮤직어워즈#써클차트뮤직어워즈2023 #CCMA#CCMA2023
CIRCLE_CHART X 10 ene.2024 CIRCLE CHART MUSIC AWARDS 2023 🖤 써클차트 뮤직 어워즈 2023!
✨정국 (Jung Kook) @bts_bighit
3관왕을 축하해요! -올해의 가수상 글로벌 스트리밍 부문 -올해의 가수상 써클지수 부문 -올해의 가수상 앨범 부문 https://x.com/CIRCLE_CHART/status/1745083079373291822?s=20
#jeon jungkook#정국#jungkook#kookie#galletita#CONGRATULATIONS JUNGKOOK#JUNGKOOK ARTIST OF THE YEAR#JungKook_GOLDEN#JUNGKOOK#Jung Kook Circle Chart Music Awards 2023#circlechart instagram sale jungkook#cr. a circlechart#cr. a CIRCLE_CHART en X
5 notes
·
View notes
Text

240102 circlechart Instagram story post
#txt#tomorrow x together#240102#instagram#story#soobin#yeonjun#beomgyu#taehyun#hueningkai#p: selca#circle chart
56 notes
·
View notes
Photo

📸 #msphotograph Posted @withregram • @circlechart . CIRCLE CHART MUSIC AWARDS 2022 🖤 오피셜 포토 대방출! @enhypen 더 많은 CCMA 2022 정보가 궁금하다면? 프로필 링크 Click! #ENHYPEN #엔하이픈 #CIRCLECHART #써클차트 #CIRCLECHARTMUSICAWARDS #CIRCLECHARTMUSICAWARDS2022 #써클차트뮤직어워즈 #써클차트뮤직어워즈2020 #CCMA #CCMA2022 #concert #photography #concertphotography #livemusic #music #musicphoto #festivalphotography #daily #view #design #musicphotography #audioloveofficial #bestmusicshots #liveconcertphotography #gigphotography #konsertfoto #htbarp #photographer https://www.instagram.com/p/CqKhydUOLNw/?igshid=NGJjMDIxMWI=
#msphotograph#enhypen#엔하이픈#circlechart#써클차트#circlechartmusicawards#circlechartmusicawards2022#써클차트뮤직어워즈#써클차트뮤직어워즈2020#ccma#ccma2022#concert#photography#concertphotography#livemusic#music#musicphoto#festivalphotography#daily#view#design#musicphotography#audioloveofficial#bestmusicshots#liveconcertphotography#gigphotography#konsertfoto#htbarp#photographer
4 notes
·
View notes
Text
tomorrowxtogether
Pinned Post
231013 TXT (투모로우바이투게더) 'Chasing That Feeling' Official MV
Source: youtube.com
#youtube#txt#tomorrow x together#231013#soobin#yeonjun#beomgyu#taehyun#hueningkai#Chasing That Feeling#Official MV
Blaze
173 notes
tomorrowxtogether


240102 page.soobin Instagram Post
새해 복 많이 받으세요! 무탈하고 즐거운 2024년이 되길
Source: instagram.com
#txt#tomorrow x together#240102#instagram#soobin#choi soobin#page.soobin
Blaze
148 notes
tomorrowxtogether

240102 circlechart Instagram story post
Source: instagram.com
#txt#tomorrow x together#240102#instagram#story#soobin#yeonjun#beomgyu#taehyun#hueningkai#p: selca#circle chart
Blaze
28 notes
tomorrowxtogether
Source: x.com
95 notes
·
View notes
Photo

📸 #maphotograph Posted @withregram • @circlechart . CIRCLE CHART MUSIC AWARDS 2022 🖤 오피셜 포토 대방출! @saythename_17 @pledis_boos @ho5hi_kwon @dk_is_dokyeom 더 많은 CCMA 2022 정보가 궁금하다면? 프로필 링크 Click! #세븐틴 #SEVENTEEN #부석순 #BSS #CIRCLECHART #써클차트 #CIRCLECHARTMUSICAWARDS #써클차트뮤직어워즈 #CCMA2022 #concert #photography #concertphotography #livemusic #music #musicphoto #festivalphotography #daily #view #design #musicphotography #audioloveofficial #bestmusicshots #liveconcertphotography #gigphotography #konsertfoto #htbarp #photographer #gig #live #music #concert https://www.instagram.com/p/CqIJa8quK_f/?igshid=NGJjMDIxMWI=
#maphotograph#세븐틴#seventeen#부석순#bss#circlechart#써클차트#circlechartmusicawards#써클차트뮤직어워즈#ccma2022#concert#photography#concertphotography#livemusic#music#musicphoto#festivalphotography#daily#view#design#musicphotography#audioloveofficial#bestmusicshots#liveconcertphotography#gigphotography#konsertfoto#htbarp#photographer#gig#live
0 notes
Video
tumblr
230218 circlechart tiktok update
요즘 재미있게 보고있는 애니메이션은? #써클차트뮤직어워즈 #CCMA#TOMORROWXTOGETHER
33 notes
·
View notes