#Cluster sampling vs random sampling
Explore tagged Tumblr posts
Visit Tumblr Blog
Explore Tumblr blogs with no restrictions, modern design and the best experience.
Last Seen Tumblr Blogs


Fun Fact
Kazakhstan’s Minister of Communications and Informatics has blocked the Tumblr site because it contained 60 sites of terrorism, extremism, and pornography in 2015.
Text
Cluster Sampling: Types, Advantages, Limitations, and Examples
Explore the various types, advantages, limitations, and real-world examples of cluster sampling in our informative blog. Learn how this sampling method can help researchers gather data efficiently and effectively for insightful analysis.
#Cluster sampling#Sampling techniques#Cluster sampling definition#Cluster sampling steps#Types of cluster sampling#Advantages of cluster sampling#Limitations of cluster sampling#Cluster sampling comparison#Cluster sampling examples#Cluster sampling applications#Cluster sampling process#Cluster sampling methodology#Cluster sampling in research#Cluster sampling in surveys#Cluster sampling in statistics#Cluster sampling design#Cluster sampling procedure#Cluster sampling considerations#Cluster sampling analysis#Cluster sampling benefits#Cluster sampling challenges#Cluster sampling vs other methods#Cluster sampling vs stratified sampling#Cluster sampling vs random sampling#Cluster sampling vs systematic sampling#Cluster sampling vs convenience sampling#Cluster sampling vs multistage sampling#Cluster sampling vs quota sampling#Cluster sampling vs snowball sampling#Cluster sampling steps explained
0 notes
Text
Evaluating Model Performance in Machine Learning

Evaluating the performance of a machine learning model is crucial to ensure it generalizes well to new data. Different evaluation metrics are used based on the type of problem (classification, regression, clustering, etc.).
1. Key Metrics for Model Evaluation
📌 Classification Metrics
Used when predicting categories (e.g., spam detection, image classification).
✅ Accuracy = TP+TNTP+TN+FP+FN\frac{TP + TN}{TP + TN + FP + FN}TP+TN+FP+FNTP+TN
Good for balanced datasets but misleading for imbalanced classes.
✅ Precision, Recall, and F1-score
Precision = TPTP+FP\frac{TP}{TP + FP}TP+FPTP (How many predicted positives were correct?)
Recall (Sensitivity) = TPTP+FN\frac{TP}{TP + FN}TP+FNTP (How many actual positives were detected?)
F1-score = Harmonic mean of Precision & Recall.
✅ ROC-AUC (Receiver Operating Characteristic — Area Under Curve)
Measures the trade-off between True Positive Rate (TPR) & False Positive Rate (FPR).
✅ Confusion Matrix
Shows True Positives (TP), False Positives (FP), True Negatives (TN), and False Negatives (FN).
✅ Log Loss (Cross-Entropy Loss)
Measures how uncertain the model’s predicted probabilities are. Lower is better.
📌 Regression Metrics
Used when predicting continuous values (e.g., house prices, stock prices).
✅ Mean Absolute Error (MAE)
Measures the average absolute difference between actual & predicted values.
✅ Mean Squared Error (MSE) & Root Mean Squared Error (RMSE)
Penalizes large errors more than MAE. RMSE gives values in original units.
✅ R² Score (Coefficient of Determination)
Measures how well the model explains variance in data (ranges from 0 to 1).
✅ Mean Absolute Percentage Error (MAPE)
Measures error as a percentage of actual values.
2. Model Performance Evaluation Techniques
✅ Train-Test Split
Split data into training (80%) and testing (20%).
Ensures model performance is evaluated on unseen data.
✅ Cross-Validation (K-Fold CV)
Splits data into K subsets and trains the model K times.
Reduces bias from a single train-test split.
✅ Bias-Variance Tradeoff
High Bias → Underfitting (Model too simple).
High Variance → Overfitting (Model too complex).
Solution: Use regularization (L1, L2), feature selection, and cross-validation.
✅ Learning Curves
Shows training vs. validation performance over epochs.
Helps detect underfitting or overfitting trends.
✅ Feature Importance & SHAP Values
Identifies which features influence model predictions the most.
Used in tree-based models like Random Forest, XGBoost.
3. Best Practices for Model Evaluation
✅ Use multiple metrics to get a complete picture. ✅ Handle imbalanced data using SMOTE, class weighting, or balanced sampling. ✅ Check for data leakage (e.g., using future information in training). ✅ Use domain knowledge to interpret model performance.
Conclusion
Evaluating model performance requires selecting appropriate metrics and validation techniques to ensure robust and generalizable models. The choice of metrics depends on the problem type (classification, regression) and dataset characteristics.
WEBSITE: https://www.ficusoft.in/deep-learning-training-in-chennai/
0 notes
Text
Mastering Data Science Using Python
Data Science is not just a buzzword; it's the backbone of modern decision-making and innovation. If you're looking to step into this exciting field, Data Science using Python is a fantastic place to start. Python, with its simplicity and vast libraries, has become the go-to programming language for aspiring data scientists. Let’s explore everything you need to know to get started with Data Science using Python and take your skills to the next level.
What is Data Science?
In simple terms, Data Science is all about extracting meaningful insights from data. These insights help businesses make smarter decisions, predict trends, and even shape new innovations. Data Science involves various stages, including:
Data Collection
Data Cleaning
Data Analysis
Data Visualization
Machine Learning
Why Choose Python for Data Science?
Python is the heart of Data Science for several compelling reasons:
Ease of Learning: Python’s syntax is intuitive and beginner-friendly, making it ideal for those new to programming.
Versatile Libraries: Libraries like Pandas, NumPy, Matplotlib, and Scikit-learn make Python a powerhouse for data manipulation, analysis, and machine learning.
Community Support: With a vast and active community, you’ll always find solutions to challenges you face.
Integration: Python integrates seamlessly with other technologies, enabling smooth workflows.
Getting Started with Data Science Using Python
1. Set Up Your Python Environment
To begin, install Python on your system. Use tools like Anaconda, which comes preloaded with essential libraries for Data Science.
Once installed, launch Jupyter Notebook, an interactive environment for coding and visualizing data.
2. Learn the Basics of Python
Before diving into Data Science, get comfortable with Python basics:
Variables and Data Types
Control Structures (loops and conditionals)
Functions and Modules
File Handling
You can explore free resources or take a Python for Beginners course to grasp these fundamentals.
3. Libraries Essential for Data Science
Python’s true power lies in its libraries. Here are the must-know ones:
a) NumPy
NumPy is your go-to for numerical computations. It handles large datasets and supports multi-dimensional arrays.
Common Use Cases: Mathematical operations, linear algebra, random sampling.
Keywords to Highlight: NumPy for Data Science, NumPy Arrays, Data Manipulation in Python.
b) Pandas
Pandas simplifies working with structured data like tables. It’s perfect for data manipulation and analysis.
Key Features: DataFrames, filtering, and merging datasets.
Top Keywords: Pandas for Beginners, DataFrame Operations, Pandas Tutorial.
c) Matplotlib and Seaborn
For data visualization, Matplotlib and Seaborn are unbeatable.
Matplotlib: For creating static, animated, or interactive visualizations.
Seaborn: For aesthetically pleasing statistical plots.
Keywords to Use: Data Visualization with Python, Seaborn vs. Matplotlib, Python Graphs.
d) Scikit-learn
Scikit-learn is the go-to library for machine learning, offering tools for classification, regression, and clustering.
Steps to Implement Data Science Projects
Step 1: Data Collection
You can collect data from sources like web APIs, web scraping, or public datasets available on platforms like Kaggle.
Step 2: Data Cleaning
Raw data is often messy. Use Python to clean and preprocess it.
Remove duplicates and missing values using Pandas.
Normalize or scale data for analysis.
Step 3: Exploratory Data Analysis (EDA)
EDA involves understanding the dataset and finding patterns.
Use Pandas for descriptive statistics.
Visualize data using Matplotlib or Seaborn.
Step 4: Build Machine Learning Models
With Scikit-learn, you can train machine learning models to make predictions. Start with simple algorithms like:
Linear Regression
Logistic Regression
Decision Trees
Step 5: Data Visualization
Communicating results is critical in Data Science. Create impactful visuals that tell a story.
Use Case: Visualizing sales trends over time.
Best Practices for Data Science Using Python
1. Document Your Code
Always write comments and document your work to ensure your code is understandable.
2. Practice Regularly
Consistent practice on platforms like Kaggle or HackerRank helps sharpen your skills.
3. Stay Updated
Follow Python communities and blogs to stay updated on the latest tools and trends.
Top Resources to Learn Data Science Using Python
1. Online Courses
Platforms like Udemy, Coursera, and edX offer excellent Data Science courses.
Recommended Course: "Data Science with Python - Beginner to Pro" on Udemy.
2. Books
Books like "Python for Data Analysis" by Wes McKinney are excellent resources.
Keywords: Best Books for Data Science, Python Analysis Books, Data Science Guides.
3. Practice Platforms
Kaggle for hands-on projects.
HackerRank for Python coding challenges.
Career Opportunities in Data Science
Data Science offers lucrative career options, including roles like:
Data Analyst
Machine Learning Engineer
Business Intelligence Analyst
Data Scientist
How to Stand Out in Data Science
1. Build a Portfolio
Showcase projects on platforms like GitHub to demonstrate your skills.
2. Earn Certifications
Certifications like Google Data Analytics Professional Certificate or IBM Data Science Professional Certificate add credibility to your resume.
Conclusion
Learning Data Science using Python can open doors to exciting opportunities and career growth. Python's simplicity and powerful libraries make it an ideal choice for beginners and professionals alike. With consistent effort and the right resources, you can master this skill and stand out in the competitive field of Data Science.
0 notes
Text
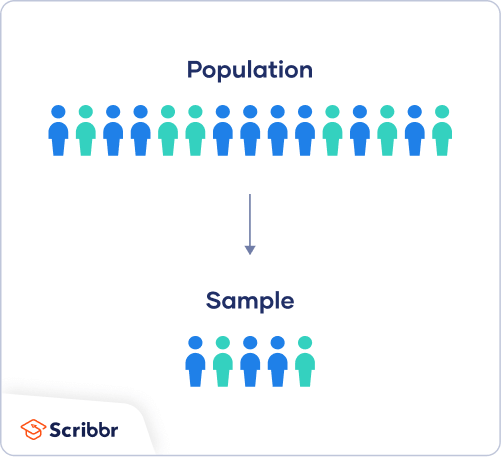
Research | Population vs Sample and Sample Strategies
via Scribbr
Within the context of research, a population is the entire group a researcher would want to draw conclusions on, whilst a sample is the group from which the data would be gathered to represent the population. The population can be defined based on a variety of factors, such as geographical location, age, income, etc. It can be very broad, or extremely specific based on the topic of research. Sampling itself can be divided into two sections;
Probability Sampling : A random selection of the population, allowing for strong statistical inferences about a given group.
Non-Probability Sampling : A Non random selection based on convenience or a certain criterion or criteria, allowing for easy collection of data.
Probability Sampling Methods
Probability Sampling is mainly used in quantitative research. It means that every member of the population has a chance of being selected. If the goal is to produce results representative of the whole population, probability sampling techniques are the most valid choice. These can be divided into four groups;
Simple Random Sample
Systematic Sample
Stratified Sample
Cluster Sample
The first technique dictates that any random member of the population has an equal chance of being selected. Therefore the sampling frame should include the whole population. To conduct this, RNG or other chance based techniques could be used to gather a sample. Systematic sampling is similar to simple random sampling, but it is usually slightly easier to conduct. Every member of the population is listed with a number, but instead of randomly generating numbers, individuals are chosen at regular intervals. It is important to make sure that there is no hidden pattern in the list that might skew the sample.
Stratified sampling involves dividing the population into subpopulations that may differ in important ways. It allows you draw more precise conclusions by ensuring that every subgroup is properly represented in the sample. This method involves separating the population into substrata based on characteristics such as age, gender, or other relevant factors. Based on the overall proportions of the population, the sample must be reflective of that ratio. So, the sample is formed by calculating the the number of people based on the size of the strata. After this, any of the above two sampling strategies could be used.
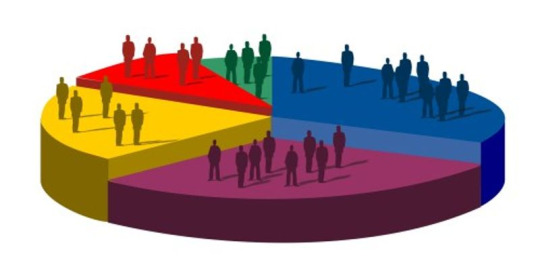
Cluster sampling also involves dividing the population into subgroups, but each subgroup should have similar characteristics to the whole sample. Instead of sampling individuals from each subgroup, you randomly select entire subgroups. While this method is better suited to dealing with large, dispersed populations, there is room for more error within the sample, as there could be substantial differences between clusters.
Non-Probability Sampling Methods
This sampling technique is based on non-random criteria, and not every individual has a chance to be included in the sample. This type of sampling is cheaper and easier to access, but runs a larger risk of sampling bias. If a non-probability sample is used, it must be as representative of the population as possible.
Non-probability sampling techniques are often used in qualitative research. The aim is not to test a hypothesis about a broad population, but to develop an initial understanding of a small or under-researched population. This too, can be divided into four groups;
Convenience Sample
Purposive Sample
Snowball Sample
Quota Sample
Convenience sampling is the most self-explanatory; it includes a population that is most accessible to the researcher. While it is easier, there is no way to guarantee generalisable results. Another method of sampling similar to this is voluntary response sampling, which involves voluntary action to help the researcher (eg;- an online survey). Alas, this method of selection is also somewhat biased, as some people are inherently more likely to volunteer than others, and thus are likely to have stronger opinions on a given topic.
Purposive sampling involves selecting a demography that is most useful towards the topic of research being conducted. It is often used in qualitative research, where the researcher wants to gain detailed knowledge about a specific phenomenon rather than make statistical inferences, or where the population is very small and specific. When using this method, a strong rationale and criteria need to be made clear based on inclusion and exclusion.
If a population is harder to access, a snowball sample can be used to recruit participants via other participants. This is also susceptible to sampling bias, as there is no way to guarantee representation of the entire population based on the reliance of other participants to recruit more people.
A quota is a non-random selection of a predetermined number or proportion of units. This is the basic premise of quota sampling. To find a quota, the population must be divided into mutually exclusive strata, and individuals would be recruited until the quota is reached. These units share specific characteristics, determined prior to forming each strata. The aim of quota sampling is to control what or who makes up the sample.
via labroots
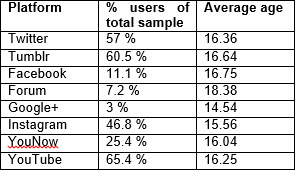
So how can this be applied to my primary research methods? In terms of the survey, first we must determine the population. The primary purpose of this survey is to gather data on the general Sri Lankan population's attitudes towards their daily commute to school or work. The secondary purpose is to garner if the average Sri Lankan student or salaryman enjoys their daily routine, and whether they would be doing something different. Since the demography is more vague (mostly being based on geographical location), the responses would be a result of voluntary response sampling; the only factors that I can control are the platforms that I post the survey on and whether or not participants share the survey on their own public networks.
These sampling strategies are more applicable to my focus and control group initiatives. The purpose of these two groups is to gather qualitative information on the population's attitudes towards a Solarpunk future, whether these attitudes change based on animated content, and to measure the change between those who have seen the animation and those who haven't. The population in this case would be those at university. Why? This is because it is statistically likely that those who attend AOD are culturally diverse Sri Lankans, between the ages of 16 and 25 (Gen Z), belong to families of a moderate to high income bracket (which would heighten their access to information), and are more versed in non-traditional problem solving skills as a result of majoring in design.
As I am looking into qualitative research, I would have to use a non-probability sampling strategy. Convenience sampling would be ruled out as it is a more unreliable strategy, as would quota and snowball sampling. This leaves purposive sampling, which fits well into what I am trying to do; gather data on a small specific population on a niche concept/idea. For the purpose of this research, as mentioned earlier, I would like to gather a section of the current L4 batch (which as it happens, is representative of the population of AOD). This is due to their cultural diversity, age (as Gen Z, they are more likely to be progressive and environmentally conscious), and most importantly their experience in design- which at this point is not as much as the average designer but more than the average person their age. Due to the nature of them being exposed in large part to the standard education system, which prioritises subjects such as math, science, etc., and just breaking into the design field, these students could offer fresh perspectives on the topic of my research.
This could be taken a step further; looking at the L4s, I could conduct multi-stage sampling by including an element of stratified sampling; depending on if I can procure the necessary data on those from my campus.
Now that I have narrowed down what kind of strategies I want to use for my primary research, I can move on to curating a new set of questions based on this information.
0 notes
Text
been reading abt this one genetic study and it is rlly interesting but also bc using modern genetics to infer stuff abt history is something i'm Aware you have to be Cautious of it does kind of result in me having Knowledge that i don't feel entirely comfortable thinking of as Knowledge. which is a v weird state of mind. esp when some of the original phrasing was already really cautiously vague.
(cut to ramble abt boring things i am in no way qualified to teach)
like okay time to ramble: i found it bc as part of a long slowburn identity crisis i got rlly frustrated with what little i know of history & not having a clue where to place myself in it - like, england has had so many different waves of migration and changes of regime, and also aristocracy-focused history isn't always good at even distinguishing between those, and if we don't even know which of those groups we're descended from... do we know anything??? (eg: fucking druids wld be talking abt The Old Ways and i'd be sitting here like. okay even if you weren't glorified wiccans, are they "the Old Ways"? are they??? is that our history or someone else's entirely? like, literally, i don't have any particular interest in doing this, but if i theoretically WERE to try and return to the religion of my prechristian ancestors, should i reconstruct druidry or heathenry or smthn else entirely?)
SO i basically wanted to ask how much, if at all, are the modern english descended from the various groups who have lived here. Who The Fuck Actually Are We
and i did basically get a cautious answer! (after finding better scicomm than the fucking guardian, which didn't even take enough care to clearly separate "english and cornish" from "british". fuck the guardian.) the actual conclusions we can pretty safely draw re: this question are:
1. the modern english have a v high level of similarity with other peoples of the uk (the study said "british isles" but roi was not counted), much of which appears to be v ancient dna, which means the genetic evidence directly contradicts the old theory that the anglo-saxons completely displaced/wiped out the britons of england. which is nice. love when my ancestors do not commit genocide on my other ancestors
2. the genetic "clusters" in england and cornwall showed a significant minority of dna (less as you travel north) theorised to be anglo-saxon - "between 10% and 40%". which, like i was saying, is both Information and Non Information. "congratulations participants, you're helping our understanding of history evolve bc you're def partly descended from the ancient britons but you also appear to have some anglo-saxon ancestry!" "oh cool. how much?" "oh you know... some". i know it doesn't matter in the real world but sjfkflshlk damn historic population geneticists u live like this? (they weren't even saying "25% +/- 15%". didn't even give us an average. just like. somewhere in this range lol)
(okay actually i am in Explaining Mode so here goes. afaict part of the problem is they're not even sure which common ancestry to be counting. only clusters in england/cornwall have any northern german common ancestry, but everyone in the uk has danish common ancestry - BUT the danish dna is significantly higher than average in groups w n.german dna. so the problem is: what's ancient, what's anglo-saxon, could any of it be viking? we just don't know.)
(they might have been able to tell by dating it but idk if they tried. and also some of their other dating was coming out Wonky - eg iirc the n.german dna is mostly dated to abt 300 years after anglo-saxon migration ended. so what's going on? did the two communities just take a v long time to integrate, or is something afoot?)
(also, of course - england is pretty genetically homogenous but there is still Some variety by region in this genetic component so making a sweeping statement abt "the english" is hard.)
3. there is a Mystery ComponentTM that makes up a larger segment than the alleged anglo-saxon dna, is found in england, scotland and northern ireland BUT not wales (so it's not just Basic British Ingredients), and matches northern france? i think they're guessing prehistoric migration for that. idk if they dated it. Hmmmm. ~Mystery DNA~
4. methodological info if you're concerned: they used participants from rural areas whose grandparents had all been born in the 50mile radius from them, so region-specific info should be p trustworthy, and the sample size was over 2000. they also found their "clusters" algorithmically and then plotted them back onto the map, so there shouldn't be confirmation bias there.)
(if i *were* to complain, looking at their map... scotland and wales have some gaps in them. some significant gaps.)
5. smthn we might genuinely be concerned abt in the analysis of these results - are we taking the results from places we know to have a historical migration as more meaningful than those we don't? looking at the results shows me every single cluster has a small but significant portion of common ancestry with modern belgium, maybe 1/12. (i'm looking at blurry pie charts, that's my best guess lol.) no analysis i've read has mentioned it.
on the other hand - idk anything abt the history of belgium but i wld not be at all surprised if their genetics were basically somewhere between germany and france, and we've already discussed both those places.
plus, possibly more relevantly - they DID scan for similarities with various other countries in europe and didn't find them. eg, no signficant/detectable common ancestry with the finnish. so if it's showing up at all, let alone as 10% or more, it's more than just random noise.
so it's knowledge but it's not knowledge but it's /more/ knowledge than not knowledge? yeah. i'm having a great time
6. assorted fun(?) facts for those who made it this far:
-the most unique place genetically they found was orkney (note: there were no participants from shetland), who showed ~25% norwegian ancestry, followed by wales, who as we remember have no Mystery DNA.
-the differences between cornwall and devon were minor, but they were definitely there and they followed modern county line p much perfectly!
-there were two different clusters in northern ireland and the west of scotland, but they DIDN'T break down into ireland vs scotland. it looked more like it might be a highland/lowland gael/gall thing. i don't know if they checked if the n.irish respondents were catholic or protestant but uhh probably better not to all things considered
-no matter how minutely you break down genetic differences, there is a large group covering much of england that is basically homogenous. you can tell genetically which island in orkney someone's from, but you can't tell the difference between people from north yorkshire and people from kent.
okay this has been a poorly explained ramble if you'd like to read the damn thing yourself it's this: https://peopleofthebritishisles.web.ox.ac.uk/population-genetics
nb that is their website for laypeople, i've looked at a few different interpetations of this but i haven't looked at the actual paper (yet? dk if i can be bothered going deeper. we'll see)
5 notes
·
View notes
Text
Analysis requests: Age
This first set of results shows the relationship between the age of the viewer and their responses, with conclusions written above the cut and full results and explanation of methodology to be found below the cut, along with a brief definition of terms.
Age/Are you subscribed to Phil? vs Age/Are you subscribed to Dan?
- People who only watch Phil are not significantly older than those who only watch Dan, but both groups are significantly older than those who watch both.
Age/In what year did you discover danisnotonfire/AmazingPhil?
- Respondents who started watching in the earlier years are older.
Age/Overall do you prefer the content of danisnotonfire or AmazingPhil?
- People who have no specific preference are significantly younger than those who prefer Dan's or Phil's content, and people who prefer Phil's content are significantly older than those who don't have a specific preference or prefer Dan's content.
Age/Who do you relate to the most?
- People who find Phil more relatable are significantly older than people who find Dan more relatable.
Age/Who are you most attracted to?
- People who are most attracted to Phil are significantly older than people who are more attracted to Dan.
Age/Who would you rather be friends with?
- There is no significant difference between the ages of people dependent on who they would rather be friends with.
Age/Do you ship Phan?
- People who ship Phan are significantly younger than those who do not ship Phan.
Age/Which of the following do you think is most likely to describe Dan and Phil’s relationship in real life?
- People who believe that Dan and Phil have or have had a romantic background are significantly older than those who believe in a platonic background.
Age/Do you consider yourself to be part of the phandom?
- These three groups differ significantly in age, in all combinations. People who consider themselves part of the phandom are younger than those who do not, or only partially do, and people who do not consider themselves as a part of the phandom are older than those who do, or only partially do.
Age/Is the Phandom the only fandom you belong to?
- Respondents who are in multiple fandoms are significantly younger.
Age/Whether or not you consider yourself part of a website’s phandom, where do you choose to see or discuss Dan and Phil related content?
Age/Do you read phanfiction?
- People who read phanfiction are significantly younger than those who do not.
Age/Do you send premium messages?
- People who send Premium msgs in Phil's and Dan's chat are significantly younger than those who do not send Premiums.
Age/Would you approach Dan and Phil if you saw them randomly?
- Respondents who wouldn't/haven't approached them are significantly older than those who would or have approached them.
Age/Did you attend TATINOF?
- There is no significant difference between the ages of people who did or did not attend TATINOF.
Age/Have you ever purchased something from the Dan and Phil Shop?
- People who have purchased from the DAP Shop are significantly younger than those who have not.
n - number of responses.
M - mean, the average result.
SD - standard deviation. The average distance to the average result - showing if results are typically clustered around an average result, or if there is a wide range of results.
Significant difference (p < x)/Not significant - There is a mathematical way to determine if two numbers (for example the age averages of two groups) are actually different from one another, or if they are within the range of what is considered random variance. This is called the p-value and we consider differences between results ‘significant’ when the p-value is smaller than 0.05. For large samples such as this, most results are significant - this does not mean that the difference is particularly large, just that there is a difference.
Pearson r - a measure of the linear correlation between two variables, with a value of between -1 and 1. A negative correlation means that as one becomes higher the other becomes lower, a positive correlation means that as one becomes higher so does the other.
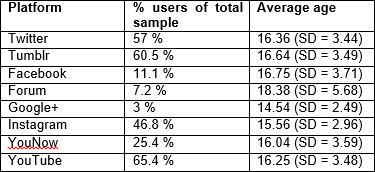
Age/Are you subscribed to Phil? vs Age/Are you subscribed to Dan?
(Only subscriptions to DINOF and AP were taken into consideration.)
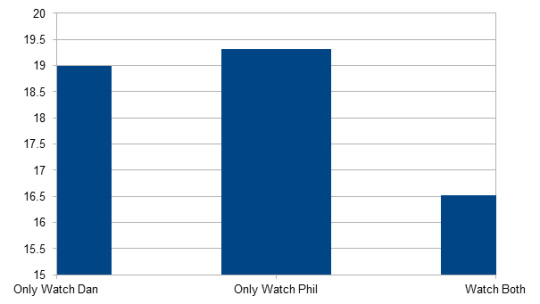
Only watch Dan n = 91; M = 18.99; SD = 5.05
Only watch Phil n = 132; M = 19.32; SD = 5.01
Watch both n = 24,085; M = 16.52; SD = 3.55
Partially significant (p < 0.001): People who only watch Phil are not significantly older than those who only watch Dan, but both groups are significantly older than those who watch both.
Age/In what year did you discover danisnotonfire/AmazingPhil?
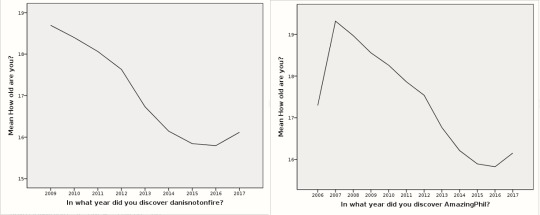
There is a significant (p < 0.01) negative correlation between year in which respondents started watching and their age (Pearson r = -.228). This means that respondents who started watching in the earlier years are older.
Age/Overall do you prefer the content of danisnotonfire or AmazingPhil?
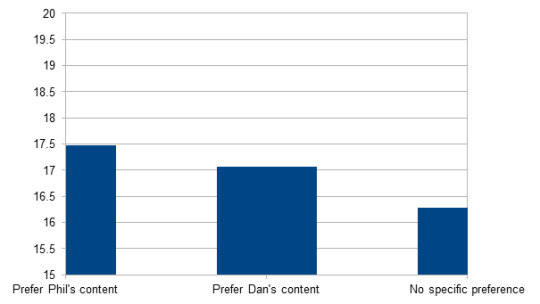
Prefer Phil's content n = 2268; M = 17.47; SD = 4.4
Prefer Dan's content n = 5475; M = 17.06; SD = 3.66
No specific preference n = 16722; M = 16.28; SD = 3.40
Significant (p < 0.001): These three groups differ significantly in age, in all combinations. (People who have no specific preference are significantly younger than those who prefer Dan's or Phil's content, and people who prefer Phil's content are significantly older than those who don't have a specific preference or prefer Dan's content.)
Age/Who do you relate to the most?
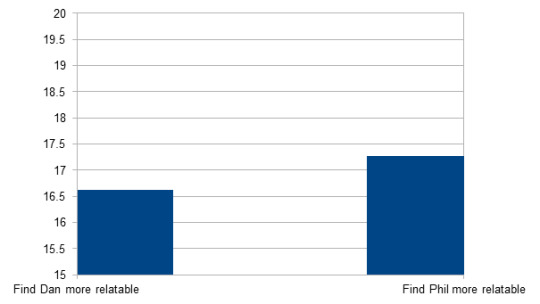
Dan n = 12603; M = 16.62; SD = 3.42
Phil n = 2189; M = 17.27; SD = 4.55
Significant (p < 0.001): People who find Phil more relatable are significantly older than people who find Dan more relatable.
Age/Who are you most attracted to?
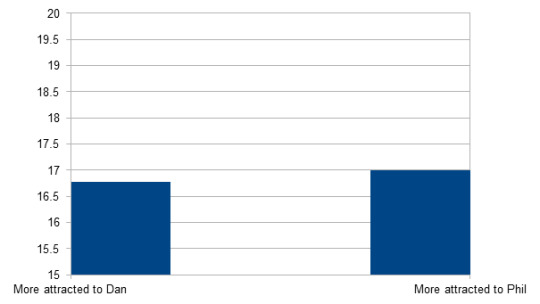
Dan n = 5324; M = 16.77; SD = 3.56
Phil n = 1255; M = 17.00; SD = 4.512
Significant (p < 0.001): People who are most attracted to Phil are significantly older than people who are more attracted to Dan.
Age/Who would you rather be friends with?
Dan n = 1707; M = 17.12; SD = 3.75
Phil n = 2596; M = 17.35; SD = 4.42
Not significant.
Age/Do you ship Phan?
(Simplified by only taking clear "Yes" and "No" answers)
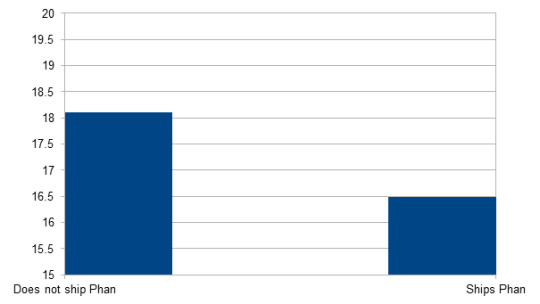
Does not ship Phan n = 1332; M = 17.89; SD = 4.42
Ships Phan n = 13097; M = 16.29; SD = 3.55
Significant (p < 0.001): People who ship Phan are significantly younger than those who do not ship Phan.
Age/Which of the following do you think is most likely to describe Dan and Phil’s relationship in real life?
(Relationship question was recoded to reflect romantic background vs. platonic background. Romantic background = long term romantic relationship; they recently started a romantic relationship; they were romantic/sexual in the past, broke up and are now back together; they were romantic/sexual in the past, but now are just friends; they were romantic/sexual in the past, but now I don’t know. Platonic background = purely good friends; purely platonic best buds who mean the world to each other.)
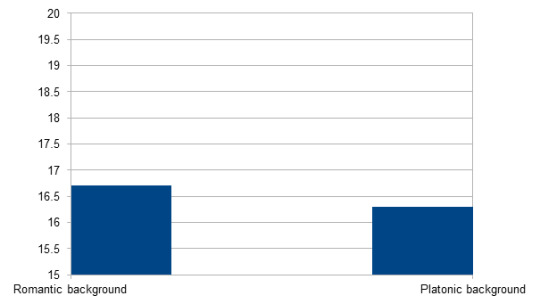
Romantic background n = 12358 (50.3 %); M = 16.70; SD = 3.79
Platonic background n = 7781 (31.7 %); M = 16.29; SD = 3.27
Significant (p < 0.001): People who believe that Dan and Phil have or have had a romantic background are significantly older than those who believe in a platonic background.
Age/Do you consider yourself to be part of the phandom?
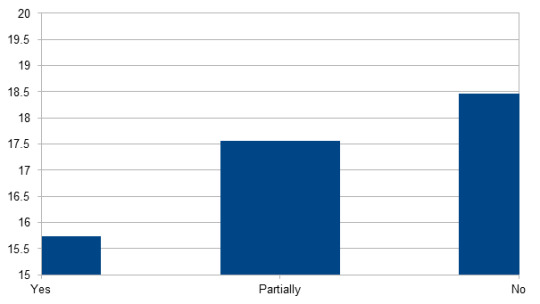
Yes n = 11811; M = 15.74; SD = 3.1
Partially n = 3615; M = 17.55; SD = 3.98
No n = 601; M = 18.46; SD = 4.27)
Significant (p < 0.001): These three groups differ significantly in age, in all combinations. People who consider themselves part of the phandom are younger than the other two groups, and people who do not consider themselves as a part of the phandom are older than the other two groups.
Age/Is the Phandom the only fandom you belong to?
(Filtered out respondents who replied that they are not in the phandom.)
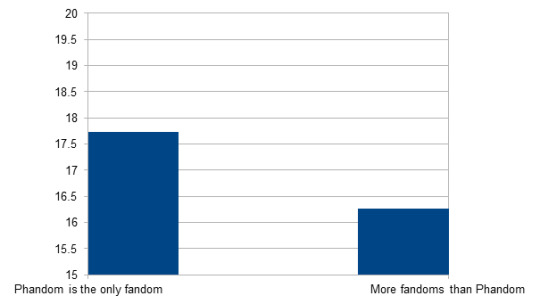
Phandom as only fandom: n = 2477; M = 17.73; SD = 4.82
More fandoms than Phandom: n = 20127; M = 16.27; SD = 3.29
Significant (p < 0.001): Respondents who are in multiple fandoms are significantly younger.
Age/Whether or not you consider yourself part of a website’s phandom, where do you choose to see or discuss Dan and Phil related content?
Significance levels not included due to high number of possible comparisons.
Age/Do you read phanfiction?
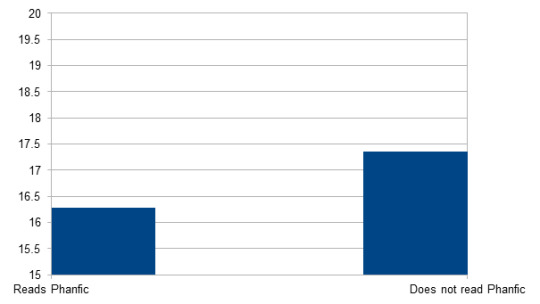
Reads Phanfic n = 18090; M = 16.28; SD = 3.43
Does not read Phanfic n = 6423; M = 17.36; SD = 3.433
Significant (p < 0.001): People who read phanfiction are significantly younger than those who do not.
Age/Do you send premium messages?
- Phil:
Sends Premium msgs n = 1140; M = 15.94; SD = 3.63
Does not send n = 18408; M = 16.48; SD = 3.63
- Dan:
Sends Premium msgs n = 1180; M = 15.86; SD = 3.65
Does not send n = 18589; M = 16.49; SD = 3.48
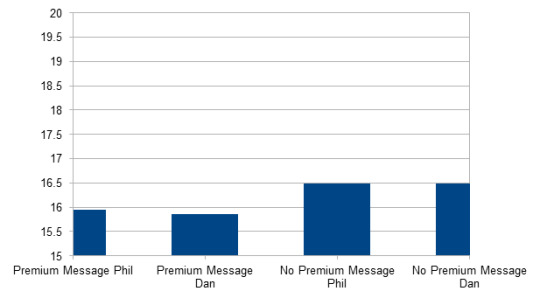
Both significant (p < 0.001): People who send Premium msgs in Phil's and Dan's chat are significantly younger than those who do not send Premiums.
Age/Would you approach Dan and Phil if you saw them randomly?
(Answer options "Yes, I met Dan/Phil/both/individually" and "No, but I would approach if I saw them" were counted as "would approach them")
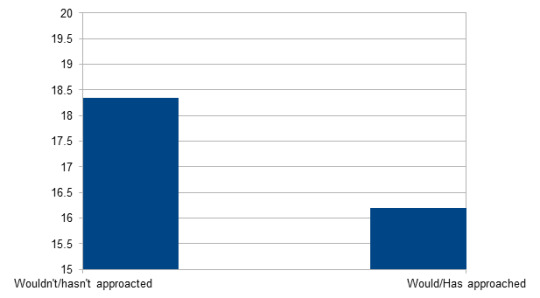
Would approach/has approached: n = 20205; M = 16.19; SD = 3.18
Wouldn't approached/hasn't appoached: n = 4308; M = 18.34; SD = 4.74
Significant (p < 0.001): Respondents who wouldn't/haven't approached them are significantly older than those who would or have approached them.
Age/Did you attend TATINOF?
Attended TATINOF: n = 6191; M = 16.62; SD = 3.54
Did not attend TATINOF: n = 18321; M = 16.55; SD = 3,62
Not significant
Age/Have you ever purchased something from the Dan and Phil Shop?
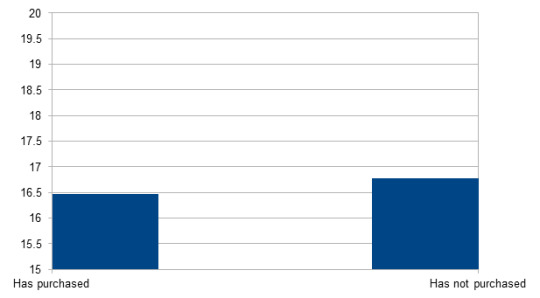
Has purchased n = 9285; M = 16.47; SD = 3.80
Has not purchased n = 13222; M = 16.78; SD = 3.55
Significant (p < 0.001): People who have purchased from the DAP Shop are significantly younger.
255 notes
·
View notes
Text
Databricks Certified Professional Data Scientist Exam Questions
If you are looking to clear the Databricks Certified Professional Data Scientist exam on your first go, then you should study PassQuestion high-quality Databricks Certified Professional Data Scientist Exam Questions that will help you succeed in the exam. With the help of the Databricks Certified Professional Data Scientist Exam Questions provided by PassQuestion, you will be able to get complete technical assistance and guidelines for the preparation of Databricks Certified Professional Data Scientist exam so you can pass your exam on the first attempt.
Databricks Certified Professional Data Scientist Exam Description
The Databricks Certified Professional Data Scientist certification exam assesses the understanding of the basics of machine learning and the steps in the machine learning lifecycle, including data preparation, feature engineering, the training of models, model selection, interpreting models, and the production of models. The exam also assesses the understanding of basic machine learning algorithms and techniques, including linear regression, logistic regression, regularization, decision trees, tree-based ensembles, basic clustering algorithms, and matrix factorization techniques. The basics of model management with MLflow, like logging and model organization, are also assessed.
Prerequisites
The minimally qualified candidate should have:
a complete understanding of the basics of machine learning, including:
bias-variance tradeoff
in-sample vs. out-of sample data
categories of machine learning
applied statistics concepts
a intermediate understanding of the steps in the machine learning lifecycle, including:
data preparation
feature engineering
model training, selection, and production
interpreting models
a complete understanding of basic machine learning algorithms and techniques, including:
linear, logistic, and regularized regression
tree-based models like decision trees, random forest and gradient boosted trees
unsupervised techniniques like K-means and PCA
specific algorithms like ALS for recommendation and isolation forests for outlier detection
a complete understanding of the basics of machine learning model management like logging and model organization with MLflowExam Details
The exam consists of 60 multiple-choice questions. Candidates will have 120 minutes to complete the exam. The minimum passing score for the exam is 70 percent. This translates to correctly answering a minimum of 42 of the 60 questions. The exam will be conducted via an online proctor. This exam has no code-based questions, and there will be no test aids available while taking the exam.
View Online Databricks Certified Professional Data Scientist Free Questions
You are asked to create a model to predict the total number of monthly subscribers for a specific magazine. You are provided with 1 year's worth of subscription and payment data, user demographic data, and 10 years worth of content of the magazine (articles and pictures). Which algorithm is the most appropriate for building a predictive model for subscribers? A.Linear regression B.Logistic regression C.Decision trees D.TF-IDF Answer : A
You are working in a data analytics company as a data scientist, you have been given a set of various types of Pizzas available across various premium food centers in a country. This data is given as numeric values like Calorie. Size, and Sale per day etc. You need to group all the pizzas with the similar properties, which of the following technique you would be using for that? A.Association Rules B.Naive Bayes Classifier C.K-means Clustering D.Linear Regression E.Grouping Answer : C
Which of the below best describe the Principal component analysis A.Dimensionality reduction B.Collaborative filtering C.Classification D.Regression E.Clustering Answer : A
You have collected the 100's of parameters about the 1000's of websites e.g. daily hits, average time on the websites, number of unique visitors, number of returning visitors etc. Now you have find the most important parameters which can best describe a website, so which of the following technique you will use A.PCA (Principal component analysis) B.Linear Regression C.Logistic Regression D.Clustering Answer : A
Refer to the exhibit.
You are building a decision tree. In this exhibit, four variables are listed with their respective values of info-gain. Based on this information, on which attribute would you expect the next split to be in the decision tree? A.Credit Score B.Age C.Income D.Gender Answer : A
0 notes
Text
Hands on Machine Learning
Chapter 1-2
- batch vs online learning
- instance vs model learning
- hyperparameter grid search
Chapter 3
- 1-precision (x) vs recall (y) is the ROC curve
- true positive rate = recall = sensitivity and true negative rate is = precision = specificity
- harmonic mean to balance precision and recall averages
Chapter 4
- training data with 3 different types of stochastic gradient descent: batch, mini batch, stochastic (with single sample row)
- cross entropy error is minimized for logistic regression
- softmax for multi class predictions. multi-label vs multi-class predictions where labels are mutually exclusive. Softmax is used when mutually exclusive labels.
- softmax helps the gradient not die, while argmax will make it disappear
Chapter 5 SVM
- svm regression is opposite of few points in the street but actually more
- hard vs soft margin classification (like output is a probability vs 1 or 0?)
- kernel trick makes non-linear classification less computationally complex
- dual problem is a problem with a similar or in this case the same mathematical solution as the primal problem of maximizing the distance between the boundaries
- things to better understand: kernel SVM thru Mercer’s condition, how hinge loss applies to SVM solved with gradient descent
Chapter 6
- trees are prone to overfit and regressions are sensitive to the orientation of the data (can be fixed with PCA)
Chapter 7
- ensemble through bagging or pasting: one with replacement and the other without, leading to OOB error
- extra randomized trees when splits on nodes for the tree is done on a random threshold. It’s called random trees bc of using only a subset of features and data points for each tree
- Adaboost (weighting wrong predictions more) vs. gradient boost (adding predictions on all the error residuals)
- stacking is a separate model used to aggregate multiple models instead of a hard vote
Chapter 9 unsupervised
- Silhouette score, balance intra and inter cluster scores, but can do for each cluster to get you a balance within the clusters
- DBSCAN density clustering, sihoulette score to find the optimal epsilon, working well for dense clusters. Don’t need to specify number of clusters
- Gaussian Mixture Model, also density clustering working well for ellipsoid clusters. Do need to specify cluster number, and covariance type of the types of shapes, which would mess it up. It also helps with anomaly detection because of p values. This can’t use silhouette score bc they’re not spherical shapes because of biases of distances.
- Bayesian GMM, similar to lasso for GMM, to set cluster count for you with priors
- Latent class, which is the cluster label of a latent variable
Chapter 13 CNN computer vision
- CNN uses a square to go over pixels in a square, some with zero padding; this is called “convolving”
- the layers are actual horizontal and vertical filters, that the model uses to multiple against inputted image
- these filters can be trained to eventually become pattern detectors. Patterns could be dog faces or even edges
- a pooling layer doesn’t detect patterns but simply averages things together, simplifying complex images
- QUESTION: how does the pattern eventually detect if yes or no for training if something is a dog for instance?
Chapter 8 Dimensionality Reduction
- PCA: projection onto a hyperplane in a dimension, max with the same number of features. The number of top dimensions you pick is your hyper parameter, with the max being the dimensions you are in. The next line is orthogonal for projection
- Kernel PCA: vector is curved or circular, not just 1 straight line. The additional hyper parameter is the shape of the curved lines used. It’s a mathematical transformation used to make different data points linearly separable in a higher dimension (making lines in a lower dimension look curved) without actually having to go to the higher dimension.
- you can decompress by multiplying by the inverse transformation. Then you see how off you are from the actual image, i.e reconstruction error
- another measurement is explained variance ratio for each dimension n, also chosen with an elbow plot
- manifold learning is twisting, unfolding, etc from a 2D space to 3D space
Chapter 14
- RNN predict time series and NLP
- it is a loop with time, each previous layer feeding into the next
- can be shorted with probabilistic dropout and feeding older t-20 to t-1 outputs, to prevent vanishing gradient
- LTSM cell allows you to recognize what’s an important input vs an unimportant one to forget
- encoder vs decoder for machine translation NLP occurs such that encoders are fed in a series as one output to a series of decoders, each with its own output. https://youtu.be/jCrgzJlxTKg
youtube
Chapter 15 autoencoders
a neural function that encodes and decodes, predicting itself (technically unsupervised but is a supervised training neural network with fewer outputs in the middle ie the encoder which simplifies and then the same number of outputs as inputs in the final layer.
GANS used autoencoders to build additional data, and autoencoders are dimensionality reducers.
Questions: how is it reducing dimensionality if the same number of outputs as inputs exist?
It’s helpful for detecting anomalies or even predicting if something is a different class. If the error bar of the output and input is super large, it is likely an anomaly or different class.
https://youtu.be/H1AllrJ-_30
https://youtu.be/yz6dNf7X7SA
Reinforcement learning
Q-learning is a value derived to punish or reward behaviors at each step in reinforcement learning
Reinforcement learning requires doing a lot of steps and getting just 1 success criteria at the end
It can be trained with stochastic gradient descent, boosting the actions with gradient descent that yielded more positive end Q score results
youtube
youtube
QUESTIONS
- does waiting longer days increase power? Or does it increase only in so far that sample size increases with more days of new users exposed? More days of data even with the same sample size will decrease std.
1 note
·
View note
Text
Learn Statistics and Data Analysis Intuitively
Welcome to Statistical Aid!
Statistical Aid is a site that provides statistical content, data analysis content, and also discusses the various fields of statistics. You can learn statistics and data analysis intuitively by Statistical Aid. All the contents on this site are written to provide help to the students who are very weak in statistics and data analysis. From basic to advanced, you can get all the topics of statistics presented on this site very simply. You can get help from the following topics:
Basic Statistics
Definition and scope of statistics
Statistical Data
Population vs Sample
Random Variable
Central tendency
Arithmetic, Geometric and harmonic mean
Measures of Dispersion
Variance and Standard Deviation
Skewness and Kurtosis
Correlation analysis
Intra vs Inter class correlation
Regression Analysis
Data levels (Nominal, ordinal, Interval and Ratio)
Hypothesis Testing
Probability Distributions in Statistics
Bernoulli Distribution
Binomial Distribution
Negative Binomial distribution
Poission Distribution
Exponential Distribution
Normal distribution
Gamma Distribution
Geometric Distribution
Hypergeometric Distribution
Uniform Distribution
Power Series Distribution
Logarithmic Series Distribution
Sampling Distributions in Statistics
Probability Sampling
Simple Random Sampling
Stratified Sampling
Systematic Sampling
Multi-Stage Sampling
Cluster Sampling
Quadrat Sampling
Non Probability Sampling
Purposive sampling
Snowball sampling
Convenience sampling
Data analysis Content and Tutorials
SPSS
R Tutoriala
SPSS Tutorials
There are also some other topics as following:
Non Parametric Tests
Time Series Analysis
Statistical Inference
Experimental Design
Data Science
Data Analytics tools free Download
SPSS 25 free Download
Stata 14.2 free Download
0 notes
Text
data science functions
Credits are earned by completing courses the place each course is usually 7.5 credits. The programme consists of obligatory courses, obligatory elective courses and elective courses. Through a combination of principle and practice within the courses of the program, you'll gain an understanding of how and why certain fashions and algorithms work and will be in a position to determine their potentialities and limitations. You will be able to approach a real-world downside in a selected drawback area, combining current and new methods to create an efficient resolution. You will have the flexibility to constantly be taught in these rapidly evolving fields, talk with experts and non-experts in particular downside domains and to responsibly apply these technologies. You will also acquire the insights to have the ability to understand and influence the roles of Data Science and AI in society.
To interface Bluetooth with Arduino/Raspberry Pi and write a program to turn LED ON/OFF when ‘1’/’0’ is acquired from smartphone using Bluetooth. To interface LED/Buzzer with Arduino/Raspberry Pi and write a program to turn ON LED for 1 sec after each 2 seconds. Explore the potential areas using embedded controllers/processors in real time techniques.
In fact, you most likely use synthetic intelligence every single day, no matter the place you work or what you do. Ask 10 totally different specialists what synthetic intelligence is, and you may get 10 completely different solutions. A good definition comes from Demis Hassabis, CEO of DeepMind, an AI firm that Google purchased. To be precise, Data Science covers AI, which includes machine learning. However, machine studying itself covers another sub-technology — Deep Learning.
Data science is not just related to the statistical aspect of the method, nevertheless it feeds the method and derives advantages from it through knowledge engineering. Data engineers and data scientists have a huge position to play in propelling AI ahead. Data science is a broad field of examine pertaining to knowledge methods and processes, aimed at maintaining data sets and deriving meaning out of them.
At Marketing AI Institute, we have spent years researching and making use of AI. Since 2016, we have published more than four hundred articles on the topic. And we've revealed stories on 50+ AI-powered distributors with greater than $1 billion in whole funding. We're additionally monitoring 1,500+ gross sales and marketing AI corporations with mixed funding north of $6.2 billion.
The core position of a Machine Learning Engineer could be to create programs that allow a machine to take specific actions with none specific programming. Their primary responsibilities consist of knowledge sets for analysis, personalising net experiences, and identifying enterprise requirements. Salaries of a Machine Learning Engineer vs Data Scientist can vary based on skills, experience and corporations hiring. Simply put, machine learning is the hyperlink that connects Data Science and AI.
Both machine studying and its subtype, deep learning, incorporate the method of learning from the information over time. While it isn't the only thing connecting the 2, deep learning is a kind of machine learning that works finest to strengthen the process of AI and knowledge science. Deep learning may be outlined as a machine studying approach that endeavors to teach computer methods things that come naturally to humans.
For instance, an AI device exists that writes e mail subject traces for you using natural language generation and pure language processing . The tool's AI model makes use of coaching from humans (samples of an organization's marketing copy) to study and enhance. But then the software drafts its personal email subject lines.
Data scientists use a mix of instruments, functions, rules and algorithms to make sense of random information clusters. Since almost all types of organizations today are producing exponential quantities of data around the world, it turns into tough to watch and store this knowledge. Data science focuses on information modelling and information warehousing to track the ever-growing information set. The data extracted through data science functions are used to guide enterprise processes and attain organisational targets.
Explore more on - Data Science Institutes in Hyderabad
360DigiTMG - Data Analytics, Data Science Course Training Hyderabad
Address:-2-56/2/19, 3rd floor, Vijaya towers, near Meridian school, Ayyappa Society Rd, Madhapur, Hyderabad, Telangana 500081
Contact us ( 099899 94319 )
https://360digitmg.com/data-science-course-training-in-hyderabad
Hours: Sunday - Saturday 7 AM - 11 PM
#best data science institute in hyderabad#data science institutes in hyderabad#data science course in hyderabad with placements
0 notes
Text
Supervised vs unsupervised machine learning
Supervised and unsupervised learning are the two different types of tasks in machine learning. In short supervised learning is done when we have prior knowledge of what the output values for our samples should be, and therefore, the goal of supervised learning is to learn a function that best approximates the relationship between input and output observable in the data. Unsupervised learning, on the other hand, does not have labeled outputs, so its goal is to infer the natural structure present within a set of data points.
Supervised Learning
Supervised learning is typically done in the context of classification, when we want to map input to output labels, or regression, when we want to map input to a continuous output. Common algorithms in supervised learning include logistic regression, naive bayes, support vector machines, artificial neural networks, and random forests. In both regression and classification, the goal is to find specific relationships or structure in the input data that allow us to effectively produce correct output data.
When conducting supervised learning, the main considerations are model complexity, and the bias-variance tradeoff. Note that both of these are interrelated.
Model complexity refers to the complexity of the function you are attempting to learn - similar to the degree of a polynomial. The proper level of model complexity is generally determined by the nature of your training data. If you have a small amount of data, or if your data is not uniformly spread throughout different possible scenarios, you should opt for a low-complexity model. This is because a high-complexity model will overfit if used on a small number of data points.
The bias-variance tradeoff also relates to model generalisation. In any model, there is a balance between bias, which is the constant error term, and variance, which is the amount by which the error may vary between different training sets. So, high bias and low variance would be a model that is consistently wrong 20% of the time, whereas a low bias and high variance model would be a model that can be wrong anywhere from 5%-50% of the time, depending on the data used to train it.
Unsupervised Learning
The most common tasks within unsupervised learning are clustering, representation learning, and density estimation. In all of these cases, we wish to learn the inherent structure of our data without using explicitly-provided labels. Some common algorithms include k-means clustering, principal component analysis, and auto-encoders. Since no labels are provided, there is no specific way to compare model performance in most unsupervised learning methods.
Two common use-cases for unsupervised learning are exploratory analysis and dimensionality reduction.
Unsupervised learning is very useful in exploratory analysis because it can automatically identify structure in data. For example, if an analyst were trying to segment consumers, unsupervised clustering methods would be a great starting point for their analysis. In situations where it is either impossible or impractical for a human to propose trends in the data, unsupervised learning can provide initial insights that can then be used to test individual hypotheses.
Dimensionality reduction, which refers to the methods used to represent data using less columns or features, can be accomplished through unsupervised methods. In representation learning, we wish to learn relationships between individual features, allowing us to represent our data using the latent features that interrelate our initial features. This sparse latent structure is often represented using far fewer features than we started with, so it can make further data processing much less intensive, and can eliminate redundant features.
So in summary:
Supervised: All data is labeled and the algorithms learn to predict the output from the input data.
Unsupervised: All data is unlabelled and the algorithms learn to inherent structure from the input data.
0 notes
Text
How Best to Measure Patient Persistence with Medications? Self Report or Pharmacy Fill?
MedicalResearch.com Interview with:

Dr. Fanaroll Alexander C. Fanaroff, MD, MHS Assistant Professor of Medicine, Division of Cardiovascular Medicine University of Pennsylvania MedicalResearch.com: What is the background for this study? Response: This is a secondary analysis of the ARTEMIS, a cluster randomized trial of copayment assistance for P2Y12 inhibitors in patients that had myocardial infarction. One of the primary endpoints of ARTEMIS was persistence with P2Y12 inhibitors: Did the patient continue to take a P2Y12 inhibitor over the entire 1 year following MI? In ARTEMIS, we captured persistence data in two ways, patient report and pharmacy fill records. What we did in this study was to look at the agreement between persistence as measured by these two methods. MedicalResearch.com: What are the main findings? Response: Overall, 15% of patients self-reported non-persistence, but 48% of patients were non-persistent by pharmacy fill data. When we looked at agreement between the methods, the two methods quite frequently did not agree: 50% of patients were persistent by both methods, 13.5% were non-persistent by both methods, 34.8% reported that they were persistent but were non-persistent by pharmacy fill, and 1.8% reported that they were non-persistent but were actually persistent by pharmacy fill records. Both methods are subject to bias: Self-report is subject to social desirability bias (where patients misrepresent medication taking behavior to please investigators) and recall bias (where patients don't remember their medications). Pharmacy fill data is subject to missing data if a pharmacy is not included in the database, or other reasons. Because of these biases, we next tried to understand which method of measuring persistence -- pharmacy fill records or self-report -- was "correct." To do this, we used two other methods of measuring persistence that were captured in ARTEMIS: copayment assistance vouchers and P2Y12 inhibitor serum drug levels. We had serum drug levels for a random sample of patients in ARTEMIS, and we found limited agreement beyond chance between serum drug levels and persistence as measured by pharmacy fill and patient report, which did not help sort out which method was more "correct." In the intervention arm, patients used vouchers to have copayments for P2Y12 inhibitors waived, and we were able to track when vouchers were used. Using the voucher data, 20% of patients that self-reported persistence but were characterized by pharmacy fill data as non-persistent actually were persistent, suggesting that pharmacy fill data underestimates persistence by roughly that amount. Lastly, we looked at clinical outcomes by persistence category, and found that patients persistent by both methods had the best outcomes, patients non-persistent by both methods had the worst outcomes, and patients with discordant persistence had outcomes intermediate between concordantly persistent and non-persistent patients. MedicalResearch.com: What should readers take away from your report? Response: Electronic health records increasingly have a mechanism for enabling physicians to check pharmacy fill records for patients to track persistence with medications. Our results show that this data is important, as it identifies more patients than self-report, but that it needs to be interpreted somewhat cautiously: Many patients non-persistent by pharmacy fill are actually persistent. The best way to understand persistence is to incorporate both patient self-report and pharmacy fill data, recognizing that patients non-persistent by both methods will have the worst outcomes. MedicalResearch.com: What recommendations do you have for future research as a result of this work? Response: Currently, health systems employ a number of interventions to increase medication persistence. Future research should look at the best way to target these interventions to patients that are non-persistent with medications, including methods that use both patient report and pharmacy fill data. No disclosures relevant to this research Citation: Fanaroff AC, Peterson ED, Kaltenbach LA, et al. Agreement and Accuracy of Medication Persistence Identified by Patient Self-report vs Pharmacy Fill: A Secondary Analysis of the Cluster Randomized ARTEMIS Trial. JAMA Cardiol. Published online March 04, 2020. doi:10.1001/jamacardio.2020.0125 Last Modified: The information on MedicalResearch.com is provided for educational purposes only, and is in no way intended to diagnose, cure, or treat any medical or other condition. Always seek the advice of your physician or other qualified health and ask your doctor any questions you may have regarding a medical condition. In addition to all other limitations and disclaimers in this agreement, service provider and its third party providers disclaim any liability or loss in connection with the content provided on this website. Read the full article
#EHRs#electronicmedicalrecords#healthcare#jamacardio#medicalresearch#medicationadherence#PennLDI#PennMed#pharmacy
0 notes
Text
300+ TOP Deep Learning Interview Questions and Answers
Deep Learning Interview Questions for freshers experienced :-
1. What is Deep Learning? Deep learning is one part of a broader group of machine learning techniques based on learning data analytics designs, as exposed through task-specific algorithms. Deep Learning can be supervised us a semi-supervised or unsupervised. 2. Which data visualization libraries do you use and why they are useful? It is valuable to determine your views value on the data value properly visualization and your individual preferences when one comes to tools. Popular methods add R’s ggplot, Python’s seaborn including matplotlib value, and media such as Plot.ly and Tableau. 3. Where do you regularly source data-sets? This type of questions remains any real tie-breakers. If someone exists going into an interview, he/she need to remember this drill of any related question. That completely explains your interest in Machine Learning. 4. What is the cost function? A cost function is a strength of the efficiency of the neural network data-set value with respect to given sample value and expected output data-set. It is a single value of data-set-function, non-vector as it gives the appearance of the neural network as a whole. MSE=1nΣi=0n(Y^i–Yi)^2 5. What are the benefits of mini-batch gradient descent? This is more efficient of compared tools to stochastic gradient reduction. The generalization data value by determining the flat minima. The Mini-batches provides help to approximate the gradient of this entire data-set advantage which helps us to neglect local minima. 6. What is mean by gradient descent? Gradient descent defined as an essential optimization algorithm value point, which is managed to get the value of parameters that reduces the cost function. It is an iterative algorithm data value function which is moves towards the direction of steepest data value function relationship as described by the form of the gradient. Θ: =Θ–αd∂ΘJ(Θ) 7. What is meant by a backpropagation? It ‘s Forward to the propagation of data-set value function in order to display the output data value function. Then using objective value also output value error derivative package is computed including respect to output activation. Then we after propagate to computing derivative of the error with regard to output activation value function and the previous and continue data value function this for all the hidden layers. Using previously calculated the data-set value and its derivatives the for output including any hidden stories we estimate error derivatives including respect to weights. 8. What is means by convex hull? The convex hull is represents to the outer boundaries of the two-level group of the data point. Once is the convex hull has to been created the data-set value, we get maximum data-set value level of margin hyperplane (MMH), which attempts to create data set value the greatest departure between two groups data set value, as a vertical bisector between two convex hulls data set value. 9. Do you have experience including Spark about big data tools for machine learning? The Spark and big data mean most favorite demand now, able to the handle high-level data-sets value and including speed. Be true if you don’t should experience including those tools needed, but more take a look into assignment descriptions also understand methods pop. 10. How will do handle the missing data? One can find out the missing data and then a data-set value either drop thorugh those rows value or columns value or decide value to restore them with another value. In python library using towards the Pandas, there are two thinging useful functions helpful, IsNull() and drop() the value function.

Deep Learning Interview Questions 11. What is means by auto-encoder? An Auto-encoder does an autonomous Machine learning algorithm data that uses backpropagation system, where that target large values are data-set to be similar to the inputs provided data-set value. Internally, it converts a deep layer that describes a code used to represent specific input. 12. Explain about from Machine Learning in industry. Robots are replacing individuals in various areas. It is because robots are added so that all can perform this task based on the data-set value function they find from sensors. They see from this data also behaves intelligently. 13. What are the difference Algorithm techniques in Machine Learning? Reinforcement Learning Supervised Learning Unsupervised Learning Semi-supervised Learning Transduction Learning to Learn 14. Difference between supervised and unsupervised machine learning? Supervised learning is a method anywhere that requires instruction defined data While Unsupervised learning it doesn’t need data labeling. 15. What is the advantage of Naive Bayes? The classifier preference converge active than discriminative types It cannot learn that exchanges between characteristics 16. What are the function using Supervised Learning? Classifications Speech recognition Regression Predict time series Annotate strings 17. What are the functions using Unsupervised Learning? To Find that the data of the cluster of the data To Find the low-dimensional representations value of the data To Find determine interesting with directions in data To Find the Magnetic coordinates including correlations To Find novel observations 18. How do you understanding Machine Learning Concepts? Machine learning is the use of artificial intelligence that provides operations that ability to automatically detect further improve from occurrence without doing explicitly entered. Machine learning centers on the evolution of network programs that can access data and utilize it to learn for themselves. 19. What are the roles of activation function? The activation function means related to data enter non-linearity within the neural network helping it to learn more system function. Without which that neural network data value would be simply able to get a linear function which is a direct organization of its input data. 20. Definition of Boltzmann Machine? Boltzmann Machine is used to optimize the resolution of a problem. The work of the Boltzmann machine is essential to optimize data-set value that weights and the quantity for data Value. It uses a recurrent structure data value. If we apply affected annealing on discrete Hopfield network, when it would display Boltzmann Machine. Get Deep Learning 100% Practical Training 21. What is Overfitting in Machine Learning? Overfitting in Machine Learning is described as during a statistical data model represents random value error or noise preferably of any underlying relationship or when a pattern is extremely complex. 22. How can you avoid overfitting? Lots of data Cross-validation 23. What are the conditions when Overfitting happens? One of the important design and chance of overfitting is because the models used as training that model is the same as that criterion used to assess the efficacy of a model. 24. What are the advantages of decision trees? The Decision trees are easy to interpret Nonparametric There are comparatively few parameters to tune 25. What are the three stages to build the hypotheses or model in machine learning? Model building Model testing Applying the model 26. What are parametric models and Non-Parametric models? Parametric models remain these with a limited number from parameters also to predict new data, you only need to understand that parameters from the model. Non Parametric designs are those with an unlimited number from parameters, allowing to and flexibility and to predict new data, you want to understand the parameters of this model also the state from the data that has been observed. 27. What are some different cases uses of machine learning algorithms can be used? Fraud Detection Face detection Natural language processing Market Segmentation Text Categorization Bioinformatics 28. What are the popular algorithms for Machine Learning? Decision Trees Probabilistic networks Nearest Neighbor Support vector machines Neural Networks 29. Define univariate multivariate and bivariate analysis? if an analysis involves only one variable it is called as a univariate analysis for eg: Pie chart, Histogram etc. If a analysis involves 2 variables it is called as bivariate analysis for example to see how age vs population is varying we can plot a scatter plot. A multivariate analysis involves more than two variables, for example in regression analysis we see the effect of variables on the response variable 30. How does missing value imputation lead to selection bias? Case treatment- Deleting the entire row for one missing value in a specific column, Implutaion by mean: distribution might get biased for instance std dev, regression, correlation. 31. What is bootstrap sampling? create resampled data from empirical data known as bootstrap replicates. 32. What is permutation sampling? Also known as randomization tests, the process of testing a statistic based on reshuffling the data labels to see the difference between two samples. 33. What is total sum of squares? summation of squares of difference of individual points from the population mean. 34. What is sum of squares within? summation of squares of difference of individual points from the group mean. 35. What is sum of squares between? summation of squares of difference of individual group means from the population mean for each data point. 36. What is p value? p value is the worst case probability of a statistic under the assumption of null hypothesis being true. 37. What is R^2 value? It’s measures the goodness of fit for a linear regression model. 38. What does it mean to have a high R^2 value? the statistic measures variance percentage in dependent variable that can be explained by the independent variables together. 40. What are residuals in a regression model? Residuals in a regression model is the difference between the actual observation and its distance from the predicted value from a regression model. 41. What are fitted values, calculate fitted value for Y=7X+8, when X =5? Response of the model when predictors values are used in the model, Ans=42. 42. What pattern should residual vs fitted plots show in a regression analysis? No pattern, if the plot shows a pattern regression coefficients cannot be trusted. 43. What is overfitting and underfitting? overfitting occurs when a model is excessively complex and cannot generalize well, a overfitted model has a poor predictive performance. Underfitting of a model occurs when the model is not able to capture any trends from the data. 44. Define precision and recall? Recall = True Positives/(True Positives + False Negatives), Precision = True Positives/(True Positives + False Positive). 45. What is type 1 and type 2 errors? False positives are termed as Type 1 error, False negative are termed as Type 2 error. 46. What is ensemble learning? The art of combining multiple learning algorithms and achieve a model with a higher predictive power, for example bagging, boosting. 47. What is the difference between supervised and unsupervised machine learning algorithms? In supervised learning we use the dataset which is labelled and try and learn from that data, unsupervised modeling involves data which is not labelled. 48. What is named entity recognition? It is identifying, understanding textual data to answer certain question like “who, when,where,What etc.” 49. What is tf-idf? It is the measure if a weight of a term in text data used majorly in text mining. It signifies how important a word is to a document. tf -> term frequency – (Count of text appearing in the data) idf -> inverse document frequency tfidf -> tf * idf 50. What is the difference between regression and deep neural networks, is regression better than neural networks? In some applications neural networks would fit better than regression it usually happens when there are non linearity involved, on the contrary a linear regression model would have less parameters to estimate than a neural network for the same set of input variables. thus for optimization neural network would need a more data in order to get better generalization and nonlinear association. 51. How are node values calculated in a feed forward neural network? The weights are multiplied with node/input values and are summed up to generate the next successive node 52. Name two activation functions used in deep neural networks? Sigmoid, softmax, relu, leaky relu, tanh. 53. What is the use of activation functions in neural networks? Activation functions are used to explain the non linearity present in the data. 54. How are the weights calculated which determine interactions in neural networks? The training model sets weights to optimize predictive accuracy. 55. which layer in a deep learning model would capture a more complex or higher order interaction? The last layer. 56. What is gradient descent? It comprises of minimizing a loss function to find the optimal weights for a neural network. 57. Imagine a loss function vs weights plot depicting a gradient descent. At What point of the curve would we achieve optimal weights? local minima. 58. How does slope of tangent to the curve of loss function vs weigts help us in getting optimal weights for a neural network Slope of a curve at any point will give us the direction component which would help us decide which direction we would want to go i.e What weights to consider to achieve a less magnitude for loss function. 59. What is learning rate in gradient descent? A value depicting how slowly we should move towards achieving optimal weights, weights are changedby the subtracting the value obtained from the product of learning rate and slope. 60. If in backward propagation you have gone through 9 iterations of calculating slopes and updated the weights simultaneously, how many times you must have done forward propagation? 9 61. How does ReLU activation function works? Define its value for -5 and +7 For all x>=0, the output is x, for all x Read the full article
0 notes
Text
Outlier Detection
What is an outlier?
An object that deviates significantly from the rest of the objects.
But outliers do not need to be extreme values.
e.g.) The point B on the first graph & the point on the second graph

Causes
Measurement or execution error.
Problems
Data outliers can spoil and mislead the training process resulting in poorer results.
Outliers can cause problems with certain types of models. For example, linear regression models are less robust to outliers than decision tree models.
How to handle
In general, if you have a legitimate reason to remove an outlier, it will help your model’s performance.
However, outliers are innocent until proven guilty. You should never remove an outlier just because it’s a "big number." That big number could be very informative for your model. We can’t stress this enough: you must have a good reason for removing an outlier, such as suspicious measurements that are unlikely to be real data.
Detecting Outlier
(There is no rigid mathematical definition of what constitutes an outlier; determining whether or not an observation is an outlier is ultimately a subjective exercise)
Univariate method
This method looks for data points with extreme values on one variable. (<=> taking into account only one feature to detect outliers)
Standard deviation
If you have any data point that is more than 3 times the standard deviation, then those points are very likely to be anomalous or outliers.

box plots
Any data points that show above or below the whiskers, can be considered outliers or anomalous.
A box plot is a graphical display for describing the distributions of the data based on a five-number summary.
The minimum
First quartile (Q1 / 25th Percentile / lower quartile)
Median (Q2 / 50th Percentile)
Third quartile (Q3 / 75th Percentile / upper quartile)
The maximum
Interquartile Range (IQR)


Tukey's fences
An outlier could be defined as any observation outside the range:

The univariate method does not always work well.
e.g.)

The points A=(-0.5,-1.5) and B=(0.5,0.5) are outliers.
However, the univariate method box plot has not detected Point B.
Z-score(standard score)
Standardize a feature and then the data points which are way too far from zero will be treated as the outliers. (In most of the cases a threshold of 3 or -3 is used)
Some good ‘thumb-rule’ thresholds can be: 2.5, 3, 3.5 or more standard deviations.

(By ‘tagging’ or removing the data points that lay beyond a given threshold we are classifying data into outliers and not outliers)
Multivariate method
This method looks for unusual combinations on all the variables.
Scatter plot
e.g.

Minkowski error
This method reduces the contribution of potential outliers in the training process.
Dbscan (Density Based Spatial Clustering of Applications with Noise)

e.g.)

Isolation Forest
Last but not least, isolation forests are an effective method for detecting outliers or novelties in data. It is a relatively novel method based on binary decision trees. Sci-Kit Learn’s implementation is relatively simple and easy to understand.
https://towardsdatascience.com/outlier-detection-with-isolation-forest-3d190448d45e
Theory
Isolation Forest, like any tree ensemble method, is built on the basis of decision trees.
In these trees, partitions are created by first randomly selecting a feature and then selecting a random split value between the minimum and maximum value of the selected feature.
In principle, outliers are less frequent than regular observations and are different from them in terms of values. That is why by using such random partitioning they should be identified closer to the root of the tree (shorter average path length, i.e., the number of edges an observation must pass in the tree going from the root to the terminal node), with fewer splits necessary. The idea of identifying a normal vs. abnormal observation can be observed in Figure 1. A normal point (on the left) requires more partitions to be identified than an abnormal point (right).

As with other outlier detection methods, an anomaly score is required for decision making. In the case of Isolation Forest, it is defined as:

where h(x) is the path length of observation x, c(n) is the average path length of unsuccessful search in a Binary Search Tree and n is the number of external nodes. Each observation is given an anomaly score and the following decision can be made on its basis:
A score close to 1 indicates anomalies
Score much smaller than 0.5 indicates normal observations
If all scores are close to 0.5 then the entire sample does not seem to have clearly distinct anomalies
Robust Random Cut Forest
Random Cut Forest (RCF) algorithm is Amazon’s unsupervised algorithm for detecting anomalies.
(Should be continued later)
Outlier analysis
Why?
In some applications such as fraud detection, the rare events can be more interesting than the more regularly occurring one.
Outlier detection vs Novelty detection
https://scikit-learn.org/stable/modules/outlier_detection.html
Novelty detection
The training data is not polluted by outliers and we are interested in detecting whether a new observation is an outlier. In this context an outlier is also called a novelty.
Outlier detection is then also known as unsupervised anomaly detection and novelty detection as semi-supervised anomaly detection.
https://www.geeksforgeeks.org/machine-learning-outlier/ https://elitedatascience.com/data-cleaning https://www.neuraldesigner.com/blog/3_methods_to_deal_with_outliers https://en.wikipedia.org/wiki/Box_plot https://www.google.com/url?sa=i&source=images&cd=&ved=2ahUKEwid4aq4sfbmAhVSM94KHVfVAZoQjRx6BAgBEAQ&url=https%3A%2F%2Ffrhyme.github.io%2Fpython-lib%2Fboxplot%2F&psig=AOvVaw3kWIut7ORi7jLHsPL80fDO&ust=1578654731751874 https://en.wikipedia.org/wiki/Outlier#Tukey's_fences https://en.wikipedia.org/wiki/Standard_score https://towardsdatascience.com/ways-to-detect-and-remove-the-outliers-404d16608dba https://towardsdatascience.com/a-brief-overview-of-outlier-detection-techniques-1e0b2c19e561 https://towardsdatascience.com/5-ways-to-detect-outliers-that-every-data-scientist-should-know-python-code-70a54335a623
0 notes
Text
Another MCQ Test on the USMLE

By BRYAN CARMODY, MD
One of the most fun things about the USMLE pass/fail debate is that it’s accessible to everyone. Some controversies in medicine are discussed only by the initiated few – but if we’re talking USMLE, everyone can participate.
Simultaneously, one of the most frustrating things about the USMLE pass/fail debate is that everyone’s an expert. See, everyone in medicine has experience with the exam, and on the basis of that, we all think that we know everything there is to know about it.
Unfortunately, there’s a lot of misinformation out there – especially when we’re talking about Step 1 score interpretation. In fact, some of the loudest voices in this debate are the most likely to repeat misconceptions and outright untruths.
Hey, I’m not pointing fingers. Six months ago, I thought I knew all that I needed to know about the USMLE, too – just because I’d taken the exams in the past.
But I’ve learned a lot about the USMLE since then, and in the interest of helping you interpret Step 1 scores in an evidence-based manner, I’d like to share some of that with you here.
However…
If you think I’m just going to freely give up this information, you’re sorely mistaken. Just as I’ve done in the past, I’m going to make you work for it, one USMLE-style multiple choice question at a time._
Question 1
A 25 year old medical student takes USMLE Step 1. She scores a 240, and fears that this score will be insufficient to match at her preferred residency program. Because examinees who pass the test are not allowed to retake the examination, she constructs a time machine; travels back in time; and retakes Step 1 without any additional study or preparation.
Which of the following represents the 95% confidence interval for the examinee’s repeat score, assuming the repeat test has different questions but covers similar content?
A) 239-241
B) 237-243
C) 234-246
D) 228-252
_
The correct answer is D, 228-252.
No estimate is perfectly precise. But that’s what the USMLE (or any other test) gives us: a point estimate of the test-taker’s true knowledge.
So how precise is that estimate? That is, if we let an examinee take the test over and over, how closely would the scores cluster?
To answer that question, we need to know the standard error of measurement (SEM) for the test.
The SEM is a function of both the standard deviation and reliability of the test, and represents how much an individual examinee’s observed score might vary if he or she took the test repeatedly using different questions covering similar material.
So what’s the SEM for Step 1? According to the USMLE’s Score Interpretation Guidelines, the SEM for the USMLE is 6 points.
Around 68% of scores will fall +/- 1 SEM, and around 95% of scores fall within +/- 2 SEM. Thus, if we accept the student’s original Step 1 score as our best estimate of her true knowledge, then we’d expect a repeat score to fall between 234 and 246 around two-thirds of the time. And 95% of the time, her score would fall between 228 and 252.
Think about that range for a moment.
The +/- 1 SEM range is 12 points; the +/- 2 SEM range is 24 points. Even if you believe that Step 1 tests meaningful information that is necessary for successful participation in a selective residency program, how many people are getting screened out of those programs by random chance alone?
(To their credit, the NBME began reporting a confidence interval to examinees with the 2019 update to the USMLE score report.)
Learning Objective: Step 1 scores are not perfectly precise measures of knowledge – and that imprecision should be considered when interpreting their values.
__
Question 2
A 46 year old program director seeks to recruit only residents of the highest caliber for a selective residency training program. To accomplish this, he reviews the USMLE Step 1 scores of three pairs of applicants, shown below.
230 vs. 235
232 vs. 242
234 vs. 249
For how many of these candidate pairs can the program director conclude that there is a statistical difference in knowledge between the applicants?
A) Pairs 1, 2, and 3
B) Pairs 2 and 3
C) Pair 3 only
D) None of the above
–
The correct answer is D, none of the above.
As we learned in Question 1, Step 1 scores are not perfectly precise. In a mathematical sense, an individual’s Step 1 score on a given day represents just one sampling from the distribution centered around their true mean score (if the test were taken repeatedly).
So how far apart do two individual samples have to be for us to confidently conclude that they came from distributions with different means? In other words, how far apart do two candidates’ Step 1 scores have to be for us to know that there is really a significant difference between the knowledge of each?
We can answer this by using the standard error of difference (SED). When the two samples are >/= 2 SED apart, then we can be confident that there is a statistical difference between those samples.
So what’s the SED for Step 1? Again, according to the USMLE’s statisticians, it’s 8 points.
That means that, for us to have 95% confidence that two candidates really have a difference in knowledge, their Step 1 scores must be 16 or more points apart.
Now, is that how you hear people talking about Step 1 scores in real life? I don’t think so. I frequently hear people discussing how a 5-10 point difference in scores is a major difference that totally determines success or failure within a program or specialty.
And you know what? Mathematics aside, they’re not wrong. Because when programs use rigid cutoffs for screening, only the point estimate matters – not the confidence interval. If your dream program has a cutoff score of 235, and you show up with a 220 or a 225, your score might not be statistically different – but your dream is over.
Learning Objective: To confidently conclude that two students’ Step 1 scores really reflect a difference in knowledge, they must be >/= 16 points apart.
__
Question 3
A physician took USMLE Step 1 in 1994, and passed with a score of 225. Now he serves as program director for a selective residency program, where he routinely screens out applicants with scores lower than 230. When asked about his own Step 1 score, he explains that today’s USMLE are “inflated” from those 25 years ago, and if he took the test today, his score would be much higher.
Assuming that neither the test’s content nor the physician’s knowledge had changed since 1994, which of the following is the most likely score the physician would attain if he took Step 1 in 2019?
A) 205
B) 225
C) 245
D) 265
–
The correct answer is B, 225.
Sigh.
I hear this kind of claim all the time on Twitter. So once and for all, let’s separate fact from fiction.
FACT: Step 1 scores for U.S. medical students score are rising.
See the graphic below.
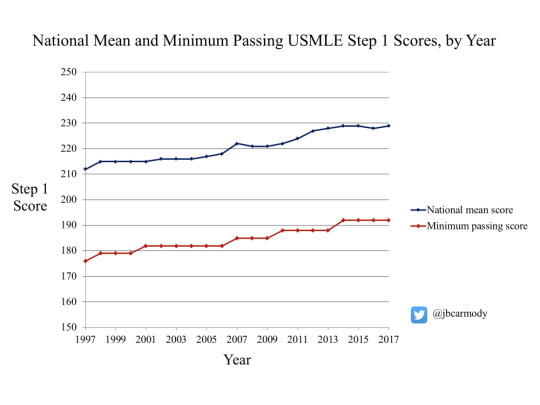
FICTION: The rise in scores reflects a change in the test or the way it’s scored.
See, the USMLE has never undergone a “recentering” like the old SAT did. Students score higher on Step 1 today than they did 25 years ago because students today answer more questions correctly than those 25 years ago.
Why? Because Step 1 scores matter more now than they used to. Accordingly, students spend more time in dedicated test prep (using more efficient studying resources) than they did back in the day. The net result? The bell curve of Step 1 curves shifts a little farther to the right each year.
Just how far the distribution has already shifted is impressive.
When the USMLE began in the early 1990s, a score of 200 was a perfectly respectable score. Matter of fact, it put you exactly at the mean for U.S. medical students.
Know what a score of 200 gets you today?
A score in the 9th percentile, and screened out of almost any residency program that uses cut scores. (And nearly two-thirds of all programs do.)
So the program director in the vignette above did pretty well for himself by scoring a 225 twenty-five years ago. A score that high (1.25 standard deviations above the mean) would have placed him around the 90th percentile for U.S. students. To hit the same percentile today, he’d need to drop a 255.
Now, can you make the argument that the type of student who scored in the 90th percentile in the past would score in the 90th percentile today? Sure. He might – but not without devoting a lot more time to test prep.
As I’ve discussed in the past, this is one of my biggest concerns with Step 1 Mania. Students are trapped in an arms race with no logical end, competing to distinguish themselves on the metric we’ve told them matters. They spend more and more time learning basic science that’s less and less clinically relevant, all at at the expense (if not outright exclusion) of material that might actually benefit them in their future careers.
(If you’re not concerned about the rising temperature in the Step 1 frog pot, just sit tight for a few years. The mean Step 1 score is rising at around 0.9 points per year. Just come on back in a while once things get hot enough for you.)
Learning Objective: Step 1 scores are rising – not because of a change in test scoring, but because of honest-to-God higher performance.
_
Question 4
Two medical students take USMLE Step 1. One scores a 220 and is screened out of his preferred residency program. The other scores a 250 and is invited for an interview.
Which of the following represents the most likely absolute difference in correctly-answered test items for this pair of examinees?
A) 5
B) 30
C) 60
D) 110
_
The correct answer is B, 30.
How many questions do you have to answer correctly to pass USMLE Step 1? What percentage do you have to get right to score a 250, or a 270? We don’t know.
See, the NBME does not disclose how it arrives at a three digit score. And I don’t have any inside information on this subject. But we can use logic and common sense to shed some light on the general processes and data involved and arrive at a pretty good guess.
First, we need to briefly review how the minimum passing score for the USMLE is set, using a modified Angoff procedure.
The Angoff procedure involves presenting items on the test to subject matter experts (SMEs). The SMEs review each question item and predict what percentage of minimally competent examinees would answer the question correctly.
Here’s an example of what Angoff data look like (the slide is from a recent lecture).

As you can see, Judge A suspected that 59% of minimally competent candidates – the bare minimum we could tolerate being gainfully engaged in the practice of medicine – would answer Item 1 correctly. Judge B thought 52% of the same group would get it right, and so on.
Now, here’s the thing about the version of the Angoff procedure used to set the USMLE’s passing standard. Judges don’t just blurt out a guess off the top of their head and call it a day. They get to review data regarding real-life examinee performance, and are permitted to use that to adjust their initial probabilities.
Here’s an example of the performance data that USMLE subject matter experts receive. This graphic shows that test-takers who were in the bottom 10% of overall USMLE scores answered a particular item correctly 63% of the time.

(As a sidenote, when judges are shown data on actual examinee performance, their predictions shift toward the data they’ve been shown. In theory, that’s a good thing. But multiple studies – including one done by the NBME – show that judges change their original probabilities even when they’re given totally fictitious data on examinee performance.)
For the moment, let’s accept the modified Angoff procedure as being valid. Because if we do, it gives us the number we need to set the minimum passing score. All we have to do is calculate the mean of all the probabilities assigned for that group of items by the subject matter experts.
In the slide above, the mean probability that a minimally competent examinee would correctly answer these 10 items was 0.653 (red box). In other words, if you took this 10 question test, you’d need to score better than 65% (i.e., 7 items correct) to pass.
And if we wanted to assign scores to examinees who performed better than the passing standard, we could. But, we’ll only have 3 questions with which to do it, since we used 7 of the 10 questions to define the minimally competent candidate.
So how many questions do we have to assign scores to examinees who pass USMLE Step 1?
Well, Step 1 includes 7 sections with up to 40 questions in each. So there are a maximum of 280 questions on the exam.
However, around 10% of these are “experimental” items. These questions do not count toward the examinee’s score – they’re on the test to generate performance data (like Figure 1 above) to present in the future to subject matter experts. Once these items have been “Angoffed”, they will become scored items on future Step 1 tests, and a new wave of experimental items will be introduced.
If we take away the 10% of items that are experimental, then we have at most 252 questions to score.
How many of these questions must be answered correctly to pass? Here, we have to use common sense to make a ballpark estimate.
After all, a candidate with no medical knowledge who just guessed answers at random might get 25% of the questions correct. Intuitively, it seems like the lower bound of knowledge to be licensed as a physician has to be north of 50% of items, right?
At the same time, we know that the USMLE doesn’t include very many creampuff questions that everyone gets right. Those questions provide no discriminatory value. Actually, I’d wager that most Step 1 questions have performance data that looks very similar to Figure 1 above (which was taken from an NBME paper).
A question like the one shown – which 82% of examinees answered correctly – has a nice spread of performance across the deciles of exam performance, ranging from 63% among low performers to 95% of high performers. That’s a question with useful discrimination for an exam like the USMLE.
Still, anyone who’s taken Step 1 knows that some questions will be much harder, and that fewer than 82% of examinees will answer correctly. If we conservatively assume that there are only a few of these “hard questions” on the exam, then we might estimate that the average Step 1 taker is probably getting around ~75% of questions right. (It’s hard to make a convincing argument that the average examinee could possibly be scoring much higher. And in fact, one of few studies that mentions this issue actually reports that the mean item difficulty was 76%.)
The minimum passing standard has to be lower than the average performance – so let’s ballpark that to be around 65%. (Bear in mind, this is just an estimate – and I think, a reasonably conservative one. But you can run the calculations with lower or higher percentages if you want. The final numbers I show below won’t be that much different than yours unless you use numbers that are implausible.)
Everyone still with me? Great.
Now, if a minimally competent examinee has to answer 65% of questions right to pass, then we have only 35% the of the ~252 scorable questions available to assign scores among all of the examinees with more than minimal competence.
In other words, we’re left with somewhere ~85 questions to help us assign scores in the passing range.
The current minimum passing score for Step 1 is 194. And while the maximum score is 300 in theory, the real world distribution goes up to around 275.

Think about that. We have ~85 questions to determine scores over around an 81 point range. That’s approximately one point per question.
Folks, this is what drives #Step1Mania.
Note, however, that the majority of Step 1 scores for U.S./Canadian students fall across a thirty point range from 220 to 250.
That means that, despite the power we give to USMLE Step 1 in residency selection, the absolute performance for most applicants is similar. In terms of raw number of questions answered, most U.S. medical student differ by fewer than 30 correctly-answered multiple choice questions. That’s around 10% of a seven hour, 280 question test administered on a single day.
And what important topics might those 30 questions test? Well, I’ve discussed that in the past.
Learning Objective: In terms of raw performance, most U.S. medical students likely differ by 30 or fewer correctly-answered questions on USMLE Step 1 (~10% of a 280 question test).
__
Question 5
A U.S. medical student takes USMLE Step 1. Her score is 191. Because the passing score is 194, she cannot seek licensure.
Which of the following reflects the probability that this examinee will pass the test if she takes it again?
A) 0%
B) 32%
C) 64%
D) 96%
–
The correct answer is C, 64%.
In 2016, 96% of first-time test takers from U.S. allopathic medical schools passed Step 1. For those who repeated the test, the pass rate was 64%. What that means is that >98% of U.S. allopathic medical students ultimately pass the exam.
I bring this up to highlight again how the Step 1 score is an estimate of knowledge at a specific point in time. And yet, we often treat Step 1 scores as if they are an immutable personality characteristic – a medical IQ, stamped on our foreheads for posterity.
But medical knowledge changes over time. I took Step 1 in 2005. If I took the test today, I would absolutely score lower than I did back then. I might even fail the test altogether.
But here’s the thing: which version of me would you want caring for your child? The 2005 version or the 2019 version?
The more I’ve thought about it, the stranger it seems that we even use this test for licensure (let alone residency selection). After all, if our goal is to evaluate competency for medical practice, shouldn’t a doctor in practice be able to pass the exam? I mean, if we gave a test of basketball competency to an NBA veteran, wouldn’t he do better than a player just starting his career? If we gave a test of musical competency to a concert pianist with a decade of professional experience, shouldn’t she score higher than a novice?
If we accept that the facts tested on Step 1 are essential for the safe and effective practice of medicine, is there really a practical difference between an examinee who doesn’t know these facts initially and one who knew them once but forgets them over time? If the exam truly tests competency, aren’t both of these examinees equally incompetent?
We have made the Step 1 score into the biggest false god in medical education.
By itself, Step 1 is neither good nor bad. It’s just a multiple choice test of medically-oriented basic science facts. It measures something – and if we appropriately interpret the measurement in context with the test’s content and limitations, it may provide some useful information, just like any other test might.
It’s our idolatry of the test that is harmful. We pretend that the test measures things that it doesn’t – because it makes life easier to do so. After all, it’s hard to thin a giant pile of residency applications with nuance and confidence intervals. An applicant with a 235 may be no better (or even, no different) than an applicant with a 230 – but by God, a 235 is higher.
It’s well beyond time to critically appraise this kind of idol worship. Whether you support a pass/fail Step 1 or not, let’s at least commit to sensible use of psychometric instruments.
Learning Objective: A Step 1 score is a measurement of knowledge at a specific point in time. But knowledge changes over time.
_
Score Report
So how’d you do?
I realize that some readers may support a pass/fail Step 1, while others may want to maintain a scored test. So to be sure everyone receives results of this test in their preferred format, I made a score report for both groups.
_
NUMERIC SCORE
Just like the real test, each question above is worth 1 point. And while some of you may say it’s non-evidence based, this is my test, and I say that one point differences in performance allow me to make broad and sweeping categorizations about you.
1 POINT – UNMATCHED
But thanks for playing. Good luck in the SOAP!
2 POINTS – ELIGIBLE FOR LICENSURE
Nice job. You’ve got what it takes to be licensed. (Or at least, you did on a particular day.)
3 POINTS – INTERVIEW OFFER!
Sure, the content of these questions may have essentially nothing to do with your chosen discipline, but your solid performance got your foot in the door. Good work.
4 POINTS – HUSAIN SATTAR, M.D.
You’re not just a high scorer – you’re a hero and a legend.
5 POINTS – NBME EXECUTIVE
Wow! You’re a USMLE expert. You should celebrate your outstanding performance with some $45 tequila shots while dancing at eye-level with the city skyline.
_
PASS/FAIL
FAIL
You regard USMLE Step 1 scores with a kind of magical thinking. They are not simply a one-time point estimate of basic science knowledge, or a tool that can somewhat usefully be applied to thin a pile of residency applications. Nay, they are a robust and reproducible glimpse into the very being of a physician, a perfectly predictive vocational aptitude test that is beyond reproach or criticism.
PASS
You realize that, whatever Step 1 measures, it is a rather imprecise in measuring that thing. You further appreciate that, when Step 1 scores are used for whatever purpose, there are certain practical and theoretical limitations on their utility. You understand – in real terms – what a Step 1 score really means.
(I only hope that the pass rate for this exam is as high as the real Step 1 pass rate.)
Dr. Carmody is a pediatric nephrologist and medical educator at Eastern Virginia Medical School. This post originally appeared on The Sheriff of Sodium here.
Another MCQ Test on the USMLE published first on https://wittooth.tumblr.com/
0 notes
Text
Another MCQ Test on the USMLE

By BRYAN CARMODY, MD
One of the most fun things about the USMLE pass/fail debate is that it’s accessible to everyone. Some controversies in medicine are discussed only by the initiated few – but if we’re talking USMLE, everyone can participate.
Simultaneously, one of the most frustrating things about the USMLE pass/fail debate is that everyone’s an expert. See, everyone in medicine has experience with the exam, and on the basis of that, we all think that we know everything there is to know about it.
Unfortunately, there’s a lot of misinformation out there – especially when we’re talking about Step 1 score interpretation. In fact, some of the loudest voices in this debate are the most likely to repeat misconceptions and outright untruths.
Hey, I’m not pointing fingers. Six months ago, I thought I knew all that I needed to know about the USMLE, too – just because I’d taken the exams in the past.
But I’ve learned a lot about the USMLE since then, and in the interest of helping you interpret Step 1 scores in an evidence-based manner, I’d like to share some of that with you here.
However…
If you think I’m just going to freely give up this information, you’re sorely mistaken. Just as I’ve done in the past, I’m going to make you work for it, one USMLE-style multiple choice question at a time._
Question 1
A 25 year old medical student takes USMLE Step 1. She scores a 240, and fears that this score will be insufficient to match at her preferred residency program. Because examinees who pass the test are not allowed to retake the examination, she constructs a time machine; travels back in time; and retakes Step 1 without any additional study or preparation.
Which of the following represents the 95% confidence interval for the examinee’s repeat score, assuming the repeat test has different questions but covers similar content?
A) 239-241
B) 237-243
C) 234-246
D) 228-252
_
The correct answer is D, 228-252.
No estimate is perfectly precise. But that’s what the USMLE (or any other test) gives us: a point estimate of the test-taker’s true knowledge.
So how precise is that estimate? That is, if we let an examinee take the test over and over, how closely would the scores cluster?
To answer that question, we need to know the standard error of measurement (SEM) for the test.
The SEM is a function of both the standard deviation and reliability of the test, and represents how much an individual examinee’s observed score might vary if he or she took the test repeatedly using different questions covering similar material.
So what’s the SEM for Step 1? According to the USMLE’s Score Interpretation Guidelines, the SEM for the USMLE is 6 points.
Around 68% of scores will fall +/- 1 SEM, and around 95% of scores fall within +/- 2 SEM. Thus, if we accept the student’s original Step 1 score as our best estimate of her true knowledge, then we’d expect a repeat score to fall between 234 and 246 around two-thirds of the time. And 95% of the time, her score would fall between 228 and 252.
Think about that range for a moment.
The +/- 1 SEM range is 12 points; the +/- 2 SEM range is 24 points. Even if you believe that Step 1 tests meaningful information that is necessary for successful participation in a selective residency program, how many people are getting screened out of those programs by random chance alone?
(To their credit, the NBME began reporting a confidence interval to examinees with the 2019 update to the USMLE score report.)
Learning Objective: Step 1 scores are not perfectly precise measures of knowledge – and that imprecision should be considered when interpreting their values.
__
Question 2
A 46 year old program director seeks to recruit only residents of the highest caliber for a selective residency training program. To accomplish this, he reviews the USMLE Step 1 scores of three pairs of applicants, shown below.
230 vs. 235
232 vs. 242
234 vs. 249
For how many of these candidate pairs can the program director conclude that there is a statistical difference in knowledge between the applicants?
A) Pairs 1, 2, and 3
B) Pairs 2 and 3
C) Pair 3 only
D) None of the above
–
The correct answer is D, none of the above.
As we learned in Question 1, Step 1 scores are not perfectly precise. In a mathematical sense, an individual’s Step 1 score on a given day represents just one sampling from the distribution centered around their true mean score (if the test were taken repeatedly).
So how far apart do two individual samples have to be for us to confidently conclude that they came from distributions with different means? In other words, how far apart do two candidates’ Step 1 scores have to be for us to know that there is really a significant difference between the knowledge of each?
We can answer this by using the standard error of difference (SED). When the two samples are >/= 2 SED apart, then we can be confident that there is a statistical difference between those samples.
So what’s the SED for Step 1? Again, according to the USMLE’s statisticians, it’s 8 points.
That means that, for us to have 95% confidence that two candidates really have a difference in knowledge, their Step 1 scores must be 16 or more points apart.
Now, is that how you hear people talking about Step 1 scores in real life? I don’t think so. I frequently hear people discussing how a 5-10 point difference in scores is a major difference that totally determines success or failure within a program or specialty.
And you know what? Mathematics aside, they’re not wrong. Because when programs use rigid cutoffs for screening, only the point estimate matters – not the confidence interval. If your dream program has a cutoff score of 235, and you show up with a 220 or a 225, your score might not be statistically different – but your dream is over.
Learning Objective: To confidently conclude that two students’ Step 1 scores really reflect a difference in knowledge, they must be >/= 16 points apart.
__
Question 3
A physician took USMLE Step 1 in 1994, and passed with a score of 225. Now he serves as program director for a selective residency program, where he routinely screens out applicants with scores lower than 230. When asked about his own Step 1 score, he explains that today’s USMLE are “inflated” from those 25 years ago, and if he took the test today, his score would be much higher.
Assuming that neither the test’s content nor the physician’s knowledge had changed since 1994, which of the following is the most likely score the physician would attain if he took Step 1 in 2019?
A) 205
B) 225
C) 245
D) 265
–
The correct answer is B, 225.
Sigh.
I hear this kind of claim all the time on Twitter. So once and for all, let’s separate fact from fiction.
FACT: Step 1 scores for U.S. medical students score are rising.
See the graphic below.

FICTION: The rise in scores reflects a change in the test or the way it’s scored.
See, the USMLE has never undergone a “recentering” like the old SAT did. Students score higher on Step 1 today than they did 25 years ago because students today answer more questions correctly than those 25 years ago.
Why? Because Step 1 scores matter more now than they used to. Accordingly, students spend more time in dedicated test prep (using more efficient studying resources) than they did back in the day. The net result? The bell curve of Step 1 curves shifts a little farther to the right each year.
Just how far the distribution has already shifted is impressive.
When the USMLE began in the early 1990s, a score of 200 was a perfectly respectable score. Matter of fact, it put you exactly at the mean for U.S. medical students.
Know what a score of 200 gets you today?
A score in the 9th percentile, and screened out of almost any residency program that uses cut scores. (And nearly two-thirds of all programs do.)
So the program director in the vignette above did pretty well for himself by scoring a 225 twenty-five years ago. A score that high (1.25 standard deviations above the mean) would have placed him around the 90th percentile for U.S. students. To hit the same percentile today, he’d need to drop a 255.
Now, can you make the argument that the type of student who scored in the 90th percentile in the past would score in the 90th percentile today? Sure. He might – but not without devoting a lot more time to test prep.
As I’ve discussed in the past, this is one of my biggest concerns with Step 1 Mania. Students are trapped in an arms race with no logical end, competing to distinguish themselves on the metric we’ve told them matters. They spend more and more time learning basic science that’s less and less clinically relevant, all at at the expense (if not outright exclusion) of material that might actually benefit them in their future careers.
(If you’re not concerned about the rising temperature in the Step 1 frog pot, just sit tight for a few years. The mean Step 1 score is rising at around 0.9 points per year. Just come on back in a while once things get hot enough for you.)
Learning Objective: Step 1 scores are rising – not because of a change in test scoring, but because of honest-to-God higher performance.
_
Question 4
Two medical students take USMLE Step 1. One scores a 220 and is screened out of his preferred residency program. The other scores a 250 and is invited for an interview.
Which of the following represents the most likely absolute difference in correctly-answered test items for this pair of examinees?
A) 5
B) 30
C) 60
D) 110
_
The correct answer is B, 30.
How many questions do you have to answer correctly to pass USMLE Step 1? What percentage do you have to get right to score a 250, or a 270? We don’t know.
See, the NBME does not disclose how it arrives at a three digit score. And I don’t have any inside information on this subject. But we can use logic and common sense to shed some light on the general processes and data involved and arrive at a pretty good guess.
First, we need to briefly review how the minimum passing score for the USMLE is set, using a modified Angoff procedure.
The Angoff procedure involves presenting items on the test to subject matter experts (SMEs). The SMEs review each question item and predict what percentage of minimally competent examinees would answer the question correctly.
Here’s an example of what Angoff data look like (the slide is from a recent lecture).

As you can see, Judge A suspected that 59% of minimally competent candidates – the bare minimum we could tolerate being gainfully engaged in the practice of medicine – would answer Item 1 correctly. Judge B thought 52% of the same group would get it right, and so on.
Now, here’s the thing about the version of the Angoff procedure used to set the USMLE’s passing standard. Judges don’t just blurt out a guess off the top of their head and call it a day. They get to review data regarding real-life examinee performance, and are permitted to use that to adjust their initial probabilities.
Here’s an example of the performance data that USMLE subject matter experts receive. This graphic shows that test-takers who were in the bottom 10% of overall USMLE scores answered a particular item correctly 63% of the time.

(As a sidenote, when judges are shown data on actual examinee performance, their predictions shift toward the data they’ve been shown. In theory, that’s a good thing. But multiple studies – including one done by the NBME – show that judges change their original probabilities even when they’re given totally fictitious data on examinee performance.)
For the moment, let’s accept the modified Angoff procedure as being valid. Because if we do, it gives us the number we need to set the minimum passing score. All we have to do is calculate the mean of all the probabilities assigned for that group of items by the subject matter experts.
In the slide above, the mean probability that a minimally competent examinee would correctly answer these 10 items was 0.653 (red box). In other words, if you took this 10 question test, you’d need to score better than 65% (i.e., 7 items correct) to pass.
And if we wanted to assign scores to examinees who performed better than the passing standard, we could. But, we’ll only have 3 questions with which to do it, since we used 7 of the 10 questions to define the minimally competent candidate.
So how many questions do we have to assign scores to examinees who pass USMLE Step 1?
Well, Step 1 includes 7 sections with up to 40 questions in each. So there are a maximum of 280 questions on the exam.
However, around 10% of these are “experimental” items. These questions do not count toward the examinee’s score – they’re on the test to generate performance data (like Figure 1 above) to present in the future to subject matter experts. Once these items have been “Angoffed”, they will become scored items on future Step 1 tests, and a new wave of experimental items will be introduced.
If we take away the 10% of items that are experimental, then we have at most 252 questions to score.
How many of these questions must be answered correctly to pass? Here, we have to use common sense to make a ballpark estimate.
After all, a candidate with no medical knowledge who just guessed answers at random might get 25% of the questions correct. Intuitively, it seems like the lower bound of knowledge to be licensed as a physician has to be north of 50% of items, right?
At the same time, we know that the USMLE doesn’t include very many creampuff questions that everyone gets right. Those questions provide no discriminatory value. Actually, I’d wager that most Step 1 questions have performance data that looks very similar to Figure 1 above (which was taken from an NBME paper).
A question like the one shown – which 82% of examinees answered correctly – has a nice spread of performance across the deciles of exam performance, ranging from 63% among low performers to 95% of high performers. That’s a question with useful discrimination for an exam like the USMLE.
Still, anyone who’s taken Step 1 knows that some questions will be much harder, and that fewer than 82% of examinees will answer correctly. If we conservatively assume that there are only a few of these “hard questions” on the exam, then we might estimate that the average Step 1 taker is probably getting around ~75% of questions right. (It’s hard to make a convincing argument that the average examinee could possibly be scoring much higher. And in fact, one of few studies that mentions this issue actually reports that the mean item difficulty was 76%.)
The minimum passing standard has to be lower than the average performance – so let’s ballpark that to be around 65%. (Bear in mind, this is just an estimate – and I think, a reasonably conservative one. But you can run the calculations with lower or higher percentages if you want. The final numbers I show below won’t be that much different than yours unless you use numbers that are implausible.)
Everyone still with me? Great.
Now, if a minimally competent examinee has to answer 65% of questions right to pass, then we have only 35% the of the ~252 scorable questions available to assign scores among all of the examinees with more than minimal competence.
In other words, we’re left with somewhere ~85 questions to help us assign scores in the passing range.
The current minimum passing score for Step 1 is 194. And while the maximum score is 300 in theory, the real world distribution goes up to around 275.

Think about that. We have ~85 questions to determine scores over around an 81 point range. That’s approximately one point per question.
Folks, this is what drives #Step1Mania.
Note, however, that the majority of Step 1 scores for U.S./Canadian students fall across a thirty point range from 220 to 250.
That means that, despite the power we give to USMLE Step 1 in residency selection, the absolute performance for most applicants is similar. In terms of raw number of questions answered, most U.S. medical student differ by fewer than 30 correctly-answered multiple choice questions. That’s around 10% of a seven hour, 280 question test administered on a single day.
And what important topics might those 30 questions test? Well, I’ve discussed that in the past.
Learning Objective: In terms of raw performance, most U.S. medical students likely differ by 30 or fewer correctly-answered questions on USMLE Step 1 (~10% of a 280 question test).
__
Question 5
A U.S. medical student takes USMLE Step 1. Her score is 191. Because the passing score is 194, she cannot seek licensure.
Which of the following reflects the probability that this examinee will pass the test if she takes it again?
A) 0%
B) 32%
C) 64%
D) 96%
–
The correct answer is C, 64%.
In 2016, 96% of first-time test takers from U.S. allopathic medical schools passed Step 1. For those who repeated the test, the pass rate was 64%. What that means is that >98% of U.S. allopathic medical students ultimately pass the exam.
I bring this up to highlight again how the Step 1 score is an estimate of knowledge at a specific point in time. And yet, we often treat Step 1 scores as if they are an immutable personality characteristic – a medical IQ, stamped on our foreheads for posterity.
But medical knowledge changes over time. I took Step 1 in 2005. If I took the test today, I would absolutely score lower than I did back then. I might even fail the test altogether.
But here’s the thing: which version of me would you want caring for your child? The 2005 version or the 2019 version?
The more I’ve thought about it, the stranger it seems that we even use this test for licensure (let alone residency selection). After all, if our goal is to evaluate competency for medical practice, shouldn’t a doctor in practice be able to pass the exam? I mean, if we gave a test of basketball competency to an NBA veteran, wouldn’t he do better than a player just starting his career? If we gave a test of musical competency to a concert pianist with a decade of professional experience, shouldn’t she score higher than a novice?
If we accept that the facts tested on Step 1 are essential for the safe and effective practice of medicine, is there really a practical difference between an examinee who doesn’t know these facts initially and one who knew them once but forgets them over time? If the exam truly tests competency, aren’t both of these examinees equally incompetent?
We have made the Step 1 score into the biggest false god in medical education.
By itself, Step 1 is neither good nor bad. It’s just a multiple choice test of medically-oriented basic science facts. It measures something – and if we appropriately interpret the measurement in context with the test’s content and limitations, it may provide some useful information, just like any other test might.
It’s our idolatry of the test that is harmful. We pretend that the test measures things that it doesn’t – because it makes life easier to do so. After all, it’s hard to thin a giant pile of residency applications with nuance and confidence intervals. An applicant with a 235 may be no better (or even, no different) than an applicant with a 230 – but by God, a 235 is higher.
It’s well beyond time to critically appraise this kind of idol worship. Whether you support a pass/fail Step 1 or not, let’s at least commit to sensible use of psychometric instruments.
Learning Objective: A Step 1 score is a measurement of knowledge at a specific point in time. But knowledge changes over time.
_
Score Report
So how’d you do?
I realize that some readers may support a pass/fail Step 1, while others may want to maintain a scored test. So to be sure everyone receives results of this test in their preferred format, I made a score report for both groups.
_
NUMERIC SCORE
Just like the real test, each question above is worth 1 point. And while some of you may say it’s non-evidence based, this is my test, and I say that one point differences in performance allow me to make broad and sweeping categorizations about you.
1 POINT – UNMATCHED
But thanks for playing. Good luck in the SOAP!
2 POINTS – ELIGIBLE FOR LICENSURE
Nice job. You’ve got what it takes to be licensed. (Or at least, you did on a particular day.)
3 POINTS – INTERVIEW OFFER!
Sure, the content of these questions may have essentially nothing to do with your chosen discipline, but your solid performance got your foot in the door. Good work.
4 POINTS – HUSAIN SATTAR, M.D.
You’re not just a high scorer – you’re a hero and a legend.
5 POINTS – NBME EXECUTIVE
Wow! You’re a USMLE expert. You should celebrate your outstanding performance with some $45 tequila shots while dancing at eye-level with the city skyline.
_
PASS/FAIL
FAIL
You regard USMLE Step 1 scores with a kind of magical thinking. They are not simply a one-time point estimate of basic science knowledge, or a tool that can somewhat usefully be applied to thin a pile of residency applications. Nay, they are a robust and reproducible glimpse into the very being of a physician, a perfectly predictive vocational aptitude test that is beyond reproach or criticism.
PASS
You realize that, whatever Step 1 measures, it is a rather imprecise in measuring that thing. You further appreciate that, when Step 1 scores are used for whatever purpose, there are certain practical and theoretical limitations on their utility. You understand – in real terms – what a Step 1 score really means.
(I only hope that the pass rate for this exam is as high as the real Step 1 pass rate.)
Dr. Carmody is a pediatric nephrologist and medical educator at Eastern Virginia Medical School. This post originally appeared on The Sheriff of Sodium here.
Another MCQ Test on the USMLE published first on https://venabeahan.tumblr.com
0 notes