#Correlation Analysis Exam Help
Explore tagged Tumblr posts
Visit Tumblr Blog
Explore Tumblr blogs with no restrictions, modern design and the best experience.
Last Seen Tumblr Blogs


Fun Fact
There were a total of 171.5 billion posts on Tumblr in 2019.
Note
Hey! This is very random, but I saw that you work in cyber security right now. I work in data science, but I'm really interested in cyber security and considering making a switch. I was wondering what kind of cybersecurity work you do, and what has been the most helpful for you to learn what you need for your job!
Hi! Cybersecurity is a really broad field, and you can do a lot of different things depending on what your interests are.
My work is mostly focused around automating things for security, since my background is in programming. Automation is really helpful for speeding up boring, monotonous tasks that need to get done, but don't necessarily need a human involved. A good example is automated phishing analysis, since phishing reports are a big chunk of the cases that security analysts have to deal with, and an analyst usually follows the same few steps at the beginning. Rather than someone having to manually check the reputation of the sender domain, check the reputation of any links, and all of that every single time, we can build tools to automatically scan for things like that and then present the info to the analyst. The whole idea here is to automate the boring data retrieval stuff, since computers are good at that, and give the analyst more time for decision-making and analysis, since humans are good at that.
If you're coming from data science, you might be interested in detection engineering. Cybersecurity is essentially a data problem - we have a ton of logs from a ton of different sources (internal logs, threat intelligence feeds, etc.) - how do we sort through that data to highlight things that we want to pay attention to, and how can we correlate events from different sources? If you're into software development or want to stay more on the data science side, maybe you could also look into roles for software development at companies that have SIEM (Security Information and Event Management) products - these are essentially the big log repositories that organizations rely on for correlation and alerting.
As for starting to learn security, my general go-to recommendation is to start looking through the material for the Security+ certification. For better or worse, certifications are pretty big in security, much more so than other tech fields (to my knowledge). I'm a bit more hesitant to recommend the Security+ now, since CompTIA (the company that offers it) was bought by a private equity company last year. Everyone is kind of expecting the prices to go up and the quality to go down. (The Security+ exam costs $404 USD as of writing this, and I think I took mine for like $135ish with a student discount in 2022). However, the Security+ is still the most well-known and comprehensive entry-level certification that I'm aware of. You can (and should) study for it completely for free - check out Professor Messer's training videos on YouTube. There are also plenty of books out there if that's more of your thing. I'd say to treat the Security+ as a way to get a broad overview of security and figure out what you don't know. (It's certainly not a magic ticket to a job, no matter what those expensive bootcamps will tell you.)
If you aren't familiar with networking, it's worth checking out Professor Messer's Network+ training videos as well. You don't need to know everything on there, but having an understanding of ports, protocols, and network components and design is super useful. I hear a lot that the best security folks are often the ones who come from IT or networking or similar and have a really solid understanding of the fundamentals and then get into security. Don't neglect the basics!
One thing that I'll also add, based on conversations I've had with folks in my network… getting a job in cybersecurity is harder now than it used to be, at least in the US (where I am). There are a ton of very well-qualified people who have been laid off who are now competing with people trying to get into the field in the first place, and with the wrecking ball that Elon is taking to the federal government (and by extension, government contractors) right now… it's hard. There's still a need for skilled folks in cyber, but you're going to run into a lot of those "5 years of experience required for this entry-level job" kind of job postings.
On a slightly happier note, another thing you should do if you want to get into cyber is to stay up to date with what's happening in the industry! I have a masterpost that has a section with some of my favorite news sources. The SANS Stormcast is a good place to start - it's a 5 minute podcast every weekday morning that covers most of the big things. Black Hills Infosec also does a weekly news livestream on YouTube that's similar (but longer and with more banter). Also, a lot of infosec folks hang out on Mastodon & in the wider fediverse. Let me know if you want some recs for folks to follow over there.
The nice thing about cybersecurity (and computer-related fields in general, I find) is that there are a ton of free resources out there to help you learn. Sometimes it's harder to find the higher-quality ones, but let me know if there are any topics you're interested in & I'll see what I can find. I have a few posts in my cybersecurity tag on here that might help.
Thank you for your patience, I know you sent this in over a week ago lol but life has been busy. Feel free to send any follow-up questions if you have any!
10 notes
·
View notes
Text

Econometrics Demystified: The Ultimate Compilation of Top 10 Study Aids
Welcome to the world of econometrics, where economic theories meet statistical methods to analyze and interpret data. If you're a student navigating through the complexities of econometrics, you know how challenging it can be to grasp the intricacies of this field. Fear not! This blog is your ultimate guide to the top 10 study aids that will demystify econometrics and make your academic journey smoother.
Economicshomeworkhelper.com – Your Go-To Destination
Let's kick off our list with the go-to destination for all your econometrics homework and exam needs – https://www.economicshomeworkhelper.com/. With a team of experienced experts, this website is dedicated to providing high-quality assistance tailored to your specific requirements. Whether you're struggling with regression analysis or hypothesis testing, the experts at Economicshomeworkhelper.com have got you covered. When in doubt, remember to visit the website and say, "Write My Econometrics Homework."
Econometrics Homework Help: Unraveling the Basics
Before delving into the intricacies, it's crucial to build a strong foundation in the basics of econometrics. Websites offering econometrics homework help, such as Khan Academy and Coursera, provide comprehensive video tutorials and interactive lessons to help you grasp fundamental concepts like linear regression, correlation, and statistical inference.
The Econometrics Academy: Online Courses for In-Depth Learning
For those seeking a more immersive learning experience, The Econometrics Academy offers online courses that cover a wide range of econometrics topics. These courses, often led by seasoned professors, provide in-depth insights into advanced econometric methods, ensuring you gain a deeper understanding of the subject.
"Mastering Metrics" by Joshua D. Angrist and Jörn-Steffen Pischke
No compilation of study aids would be complete without mentioning authoritative books, and "Mastering Metrics" is a must-read for econometrics enthusiasts. Authored by two renowned economists, Joshua D. Angrist and Jörn-Steffen Pischke, this book breaks down complex concepts into digestible chapters, making it an invaluable resource for both beginners and advanced learners.
Econometrics Forums: Join the Conversation
Engaging in discussions with fellow econometrics students and professionals can enhance your understanding of the subject. Platforms like Econometrics Stack Exchange and Reddit's econometrics community provide a space for asking questions, sharing insights, and gaining valuable perspectives. Don't hesitate to join the conversation and expand your econometrics network.
Gretl: Your Free Econometrics Software
Practical application is key in econometrics, and Gretl is the perfect tool for hands-on learning. This free and open-source software allows you to perform a wide range of econometric analyses, from simple regressions to advanced time-series modeling. Download Gretl and take your econometrics skills to the next level.
Econometrics Journal Articles: Stay Updated
Staying abreast of the latest developments in econometrics is essential for academic success. Explore journals such as the "Journal of Econometrics" and "Econometrica" to access cutting-edge research and gain insights from scholars in the field. Reading journal articles not only enriches your knowledge but also equips you with the latest methodologies and approaches.
Econometrics Bloggers: Learn from the Pros
Numerous econometrics bloggers share their expertise and experiences online, offering valuable insights and practical tips. Follow blogs like "The Unassuming Economist" and "Econometrics by Simulation" to benefit from the expertise of professionals who simplify complex econometric concepts through real-world examples and applications.
Econometrics Software Manuals: Master the Tools
While software like STATA, R, and Python are indispensable for econometric analysis, navigating through them can be challenging. Refer to comprehensive manuals and documentation provided by these software platforms to master their functionalities. Understanding the tools at your disposal will empower you to apply econometric techniques with confidence.
Econometrics Webinars and Workshops: Continuous Learning
Finally, take advantage of webinars and workshops hosted by academic institutions and industry experts. These events provide opportunities to deepen your knowledge, ask questions, and engage with professionals in the field. Check out platforms like Econometric Society and DataCamp for upcoming events tailored to econometrics enthusiasts.
Conclusion
Embarking on your econometrics journey doesn't have to be daunting. With the right study aids, you can demystify the complexities of this field and excel in your academic pursuits. Remember to leverage online resources, engage with the econometrics community, and seek assistance when needed. And when the workload becomes overwhelming, don't hesitate to visit Economicshomeworkhelper.com and say, "Write My Econometrics Homework" – your trusted partner in mastering econometrics. Happy studying!
13 notes
·
View notes
Text
Unraveling Data Mysteries: A Beginner's Guide to SPSS Exploration and Analysis
Statistics plays a pivotal role as the bedrock of empirical research, offering priceless insights into the intricate relationships that exist among variables. Within the realm of graduate-level statistical analysis, we navigate the labyrinth of data using the robust Statistical Package for the Social Sciences (SPSS). Our primary objective is to unearth patterns and relationships among variables, amplifying our comprehension of the underlying data structures. Join us as we embark on an illuminating journey through two intricate numerical questions that not only challenge but also showcase the potential of SPSS in untangling the multifaceted complexities of statistical analysis. If you are seeking assistance or struggling with your SPSS assignment, rest assured that this exploration might provide the help with SPSS assignment you need.
Question 1:
You are conducting a research study to analyze the relationship between students' hours of study and their final exam scores. You collect data from a sample of 100 graduate students using SPSS. The dataset includes two variables: "Hours_of_Study" and "Final_Exam_Score." After importing the data into SPSS, perform the following tasks:
a) Calculate the mean, median, and mode of the "Hours_of_Study" variable.
b) Determine the range of the "Final_Exam_Score" variable.
c) Generate a histogram for the "Hours_of_Study" variable with appropriate bins.
d) Conduct a descriptive analysis of the correlation between "Hours_of_Study" and "Final_Exam_Score" variables.
Answer 1:
a) The mean of the "Hours_of_Study" variable is 15.2 hours, the median is 14.5 hours, and the mode is 12 hours.
b) The range of the "Final_Exam_Score" variable is 40 points.
c) The histogram for the "Hours_of_Study" variable is attached, indicating the distribution of study hours among the graduate students.
d) The correlation analysis shows a Pearson correlation coefficient of 0.75 between "Hours_of_Study" and "Final_Exam_Score," suggesting a strong positive correlation between the two variables.
Question 2:
You are conducting a multivariate analysis using SPSS to examine the impact of three independent variables (Variable1, Variable2, Variable3) on a dependent variable (Dependent_Variable). The dataset includes 150 observations. Perform the following tasks:
a) Provide the descriptive statistics for each independent variable (mean, standard deviation, minimum, maximum).
b) Conduct a one-way ANOVA to determine if there are significant differences in the mean scores of the Dependent_Variable based on the levels of Variable1.
c) Perform a regression analysis to assess the combined effect of Variable2 and Variable3 on Dependent_Variable.
Answer 2:
a) Descriptive statistics for each independent variable are as follows:
Variable1: Mean = 25.3, SD = 3.6, Min = 20, Max = 30
Variable2: Mean = 45.8, SD = 5.2, Min = 40, Max = 50
Variable3: Mean = 60.4, SD = 7.1, Min = 55, Max = 70
b) The one-way ANOVA results indicate a significant difference in the mean scores of Dependent_Variable based on the levels of Variable1 (F(2, 147) = 4.62, p < 0.05).
c) The regression analysis reveals that Variable2 and Variable3 together account for 65% of the variance in Dependent_Variable (R² = 0.65, p < 0.001), suggesting a substantial combined effect of these variables on the dependent variable.
Conclusion:
SPSS serves as a powerful tool for unraveling the intricacies of statistical relationships. From exploring correlations between study hours and exam scores to conducting multivariate analyses, our journey through these graduate-level questions demonstrates the versatility and depth that SPSS brings to statistical exploration. As we navigate the depths of data analysis, we gain valuable insights that contribute to the ever-evolving landscape of statistical research.
#education#statistics assignment help#university#online assignment help#academic solution#academic success#do my spss assignment#spss assignment help
4 notes
·
View notes
Text
Statistics for the Curious: Understanding Key Statistical Concepts for Non-Math Majors
Why Statistics Matter
Before delving into specific concepts, let's understand why statistics are relevant in various fields:
Data Interpretation: Statistics help us make sense of large datasets, allowing us to draw meaningful conclusions.
Decision Making: In business, healthcare, social sciences, and more, data-driven decisions are crucial for success.
Research: Whether you're conducting scientific research or a market analysis, statistics play a key role in drawing reliable conclusions.
Key Statistical Concepts for Non-Math Majors
Descriptive vs. Inferential Statistics:
Descriptive statistics involve organizing and summarizing data to describe its main features. Common descriptive measures include mean (average), median (middle value), and mode (most frequent value).
Inferential statistics go beyond description and involve making predictions or inferences about a population based on a sample of data.
Probability:
Probability is the likelihood of an event occurring. It is expressed as a number between 0 (impossible) and 1 (certain). Understanding probability helps in making decisions in uncertain situations.
Normal Distribution:
The normal distribution, often referred to as a bell curve, is a common pattern in data. Many natural phenomena, like human height or exam scores, follow this distribution. It's characterized by a symmetrical shape.
Sampling and Sampling Methods:
Sampling involves selecting a subset (sample) from a larger group (population). Common sampling methods include random sampling, stratified sampling, and convenience sampling.
Hypothesis Testing:
Hypothesis testing is a method used to determine if there's a significant difference between two or more groups or conditions. It involves formulating a hypothesis, collecting data, and using statistical tests to make conclusions.
Confidence Intervals:
Confidence intervals provide a range of values within which a population parameter is likely to fall. For example, a 95% confidence interval for the average height of a population might be 160-170 cm.
Statistical Significance:
Statistical significance indicates whether an observed effect or difference in data is likely to be genuine or if it could have occurred by chance. It's commonly used in research to validate findings.
Correlation vs. Causation:
Correlation is a statistical relationship between two variables. However, it doesn't imply causation, meaning that just because two variables are correlated doesn't mean one causes the other.
Regression Analysis:
Regression analysis explores the relationship between a dependent variable and one or more independent variables. It's used for prediction and understanding relationships in data.
The Role of SpeedyPaper
Statistics coursework and assignments can be challenging, especially for non-math majors. Here's how SpeedyPaper can assist:
Statistical Analysis: Our team of experts can assist with statistical analysis, including running tests and interpreting results.
Data Interpretation: We can help you understand and interpret data, ensuring you draw meaningful conclusions.
Custom Papers: Need a research paper or essay on a statistical topic? We offer custom writing services tailored to your needs.
Conclusion: Embracing Statistics with Confidence
Statistics is a valuable tool for making informed decisions and understanding the world around us. By grasping these key statistical concepts and seeking support when needed, you can approach statistical challenges with confidence. For academic guidance, case study assistance, and support in your educational journey, consider exploring the services offered by PaperCoach. They are dedicated to helping learners excel and gain a deeper understanding of the world through case studies. Visit us at PaperCoach to learn more about how we can support your academic and professional endeavors.
#essay help online#essay help#essay helpers#write my essay#essay writers#My Homework Help#essay assignment help#Essay online#assignments#essay writing service#essay writing services#essay writing#best essay writing#essay tips#student tips#study tips#writing tips#tips and tricks#tips for writers#tips#life hacks
5 notes
·
View notes
Note
https://www.tumblr.com/askgothamshitty/786283923914342400/httpswwwtumblrcomaskgothamshitty786082651826?source=share
I hate having to send multiple messages but I refuse to expose my accounts. One thing I love about Twitter is that you can multiple accounts on one app.
But anyway. I was trying to say exactly what you said, lol. Sabrina should be criticized as a public figure and creator for how women are represented in her work. Furthermore, her content should be examined within the context of society at large. I have nothing against that. I just see a lot of people criticizing her on s very individual level, focusing more on who they think she is as a person. There are ways the engage in media criticism without devolving in bashing an individual.
People refuse to acknowledge that this is a reality for female musicians in general and if you were exam most art that is being produced these days beyond Sabrina's cover you can see a major trend in the rise of romanticized submission and sexual availability.
Too many people are invested in what Sabrina's work reflects about her personal life when they should be focused on what it says about society. Too many people are viewing her as their friend and not a public figure.
And this is not in defense of sabrina or anything as I have no interest in her or her music. This is in defense of feminism and feminist critique of art. These convos should not be focused on policing how women represent themselves in media but rather what image is being produced and how that correlates to ideologies and trends.
What does the image say about women rather than what does this image say about Sabrina.
A lot of people think these are the same conversation.
Also, there is the issue of stan Twitter influencing the conversation and narrative. Not just on the side of defending her but also criticizing her. A lot of conversations about women in pop culture on Twitter namely (and to an lesser extent tiktok) is being driven by stans and gossip bloggers adopting feminist language to add a sheen of intellectualism to their very bias and nonsense argument. Regardless of how accurate their argument is, they are known to lie and lead people astray with the intent of just turning you against the artist. Very quick to spin the narrative, and it's very dangerous.
And of course only engage with other feminist because even Christians can sound like Dworkin when they're ready
Yes, Sabrina The Artist and Sabrina The Person must be separated. Feminists that don’t understand this have the same mindset as stans where they think they truly know a celebrity for who they are. They don’t get that we only know the image Sabrina carefully constructs for us to interact with. We never have and never will know who she actually is, and that’s the point.
And people come away from this discussion thinking all of this critique is us saying that Sabrina is a bad person and those who listen to her music are bad people. It’s like they can’t understand macro- vs micro-level analysis. But the misogynist feminists that attack Sabrina’s character are not helping.
1 note
·
View note
Text
Attendance Calculator: A Comprehensive Guide
In today’s fast-paced academic and professional environments, maintaining and tracking attendance is crucial. Whether you’re a student, teacher, HR manager, or team leader, keeping accurate records of attendance can significantly impact performance evaluations, compliance, and productivity. This is where an Attendance Calculator becomes an indispensable tool.
What Is an Attendance Calculator?
An Attendance Calculator is a digital or manual tool used to determine the percentage of attendance over a specific period. It helps individuals and organizations measure how often someone is present or absent from classes, work, or events. These calculators can range from simple spreadsheet templates to advanced software integrated into attendance management systems.
Key Features of an Attendance Calculator
Automatic Percentage Calculation Calculates attendance percentage based on input data such as total working days and days attended.
User-Friendly Interface Most calculators are designed to be intuitive, requiring only basic data input.
Customizable Settings Allows users to set thresholds (e.g., 75% minimum attendance requirement).
Real-Time Updates In software versions, attendance can be updated in real-time with data sync across systems.
Data Export & Reports Generate reports for individuals or teams in formats like PDF, Excel, or CSV.
How to Use a Basic Attendance Calculator
To calculate attendance manually or with a basic calculator:
Formula:
Attendance Percentage=(Number of Days AttendedTotal Number of Working Days)×100\text{Attendance Percentage} = \left( \frac{\text{Number of Days Attended}}{\text{Total Number of Working Days}} \right) \times 100Attendance Percentage=(Total Number of Working DaysNumber of Days Attended)×100
Example: If a student attended 67 out of 80 classes:
(6780)×100=83.75%\left( \frac{67}{80} \right) \times 100 = 83.75\%(8067)×100=83.75%
This means the student has an attendance rate of 83.75%.
Why Use an Attendance Calculator?
Academic Requirements: Many institutions mandate minimum attendance for exam eligibility.
Workplace Productivity: Helps managers track absenteeism and ensure accountability.
Legal Compliance: In some sectors, maintaining attendance records is required by labor laws.
Performance Analysis: Correlates attendance with performance metrics for better evaluation.
Types of Attendance Calculators
Manual Spreadsheets: Suitable for small groups or individual tracking.
Web-Based Tools: Online calculators accessible from any device with an internet connection.
Mobile Apps: Great for on-the-go tracking, especially for field teams or remote learners.
Integrated HR or School Software: Part of a larger system with attendance, payroll, and academic records all in one platform.
Choosing the Right Attendance Calculator
When selecting an attendance calculator, consider:
Number of users or employees/students to track
Integration capabilities with existing systems
Security features for protecting sensitive data
Ease of use and customer support
Final Thoughts
An Attendance Calculator is more than just a tool — it’s a necessity in environments where accountability, discipline, and performance matter. By automating the process of attendance tracking, these calculators save time, reduce human error, and provide actionable insights.
0 notes
Text
Why does correlation not imply causation?
You’re here — which means you’ve probably come across that frustrating phrase: “correlation does not imply causation,” and now you’re thinking: “Okay smarty-pants, but what does that actually mean?” Don’t worry, you’re not alone. Let’s break it down with zero confusion and a lot more fun. —
Why Does Correlation Not Imply Causation?
Alright, picture this: Every time you bring out your umbrella, it rains. So… is your umbrella causing the rain? Of course not. That would be wild. 🌧️ But both things are related, right? You bring your umbrella because it’s going to rain — not the other way around. That’s the heart of this phrase: just because two things happen together doesn’t mean one caused the other. Let’s dive in, friend-style. — 📊 What Is Correlation? Correlation just means two things seem to happen at the same time or in a pattern. - Ice cream sales go up → Drowning incidents go up - People who eat breakfast → Often score higher on tests - Shoe size → Seems to relate to reading ability in kids But wait… does eating ice cream cause drowning? Does wearing big shoes make you smart? Nope. That’s where we have to be careful. —


💥 So What Is Causation Then? Causation is when one thing directly makes the other thing happen. - You touch a hot stove → You burn your hand - You study consistently → You usually score better on exams - You forget to water a plant → It dries up In these examples, there’s a clear link: A causes B. — 🕵️♀️ So Why Do We Mix Them Up? Because sometimes things look super related, and our brains loooove patterns. We naturally try to find meaning and links — it’s how we survive. But here’s where we get tricked. Imagine this: 📈 Graph A: The number of people who drowned by falling into a pool 📉 Graph B: The number of Nicolas Cage movies released that year They rise and fall together. So… do Nicolas Cage movies cause drowning? Of course not — it’s a coincidence. This is called a “spurious correlation” — when two things appear linked but aren’t actually connected. — 🧠 Real Talk: Why Does This Matter? Because in science, health, news, and even social media — people often show you a graph or a stat and say, “Look! This proves X causes Y!” But unless there’s solid testing (like experiments or deep analysis), that “proof” might just be two random things hanging out. Believing every correlation is causation can lead to wrong decisions, bad policies, or even fear. So the phrase “correlation does not imply causation” is like a little mental seatbelt — keeping you safe from jumping to wrong conclusions. — 🧁 Here’s a Sweet Analogy: You notice that every time there’s cake in the house, you’re happier. Does that mean cake causes happiness? Kinda yes… but maybe you buy cake when you're already in a good mood? Or maybe you’re celebrating something that made you happy? See? It’s not always clear who’s causing what — and that’s why researchers have to dig deep. — ✍️ Summary for the Win: - Correlation = two things happen together - Causation = one thing directly causes the other - Just because they’re related doesn’t mean one caused the other - You need experiments, controls, and logic to prove real causation - Be skeptical of pretty charts and wild claims — not all patterns mean something real So next time someone says, “Ice cream causes shark attacks,” you’ll know to smile and say, “Chill, that’s just correlation.” — 📌 Disclaimer: This easy version is meant to help you understand the concept better. If your exam or teacher expects a textbook explanation and you write this one instead, we’re not responsible if it affects your marks. Use this for understanding, not copy-pasting. — 🔗 Related Articles from EdgyThoughts.com: How Do Stem Cells Differentiate into Specific Cells? https://edgythoughts.com/how-do-stem-cells-differentiate-into-specific-cells/ Why Does Superconductivity Require Low Temperatures? https://edgythoughts.com/why-does-superconductivity-require-low-temperatures/ 🌐 External Resource: Want to explore funny examples of weird correlations? https://en.wikipedia.org/wiki/Correlation_does_not_imply_causation Read the full article
#causevseffectbiology#correlationmythsdebunked#correlationvscausationexplained#criticalthinkingandstats#datainterpretationbasics#differencebetweencausationandcorrelation#doescorrelationprovecausation#easycorrelationexampleforstudents#edgythoughtssciencelogic#funexplanationofcorrelation#funnysciencecorrelations#highschoolpsychology2025#logicalreasoningscience#sciencevsassumptionlearning#spuriouscorrelationexamples#statisticalfallaciesmadesimple#understandingpatternsindata#whycorrelationisnotcausation#whygraphscanbemisleading
0 notes
Text
Crack FMGE with Confidence – Choose MedNext, Delhi’s Leading FMGE Coaching Institute
For many Indian medical graduates returning from foreign universities, passing the Foreign Medical Graduate Examination (FMGE) is the final milestone before practicing medicine in India. With limited attempts and a highly competitive environment, success in FMGE requires not just hard work but also strategic coaching. That’s where MedNext comes in — a name that has become synonymous with result-oriented FMGE preparation.
What Makes MedNext the First Choice for FMGE Aspirants?
✅ Top-Notch Faculty Team
MedNext has assembled a dream team of India’s most respected medical educators. Renowned names like Dr. Rajiv Dhawan (ENT), Dr. Akhilesh Raj Jhamad (FMT), and other veterans conduct highly interactive and conceptual sessions that decode the FMGE syllabus into digestible, exam-ready content.
✅ Concept-Based Teaching, Not Rote Memorization
Unlike traditional coaching centers, MedNext focuses on building concepts from the ground up. Faculty use clinical correlations, diagrams, flowcharts, and easy-to-remember mnemonics to ensure long-term retention and conceptual clarity — a must for clearing FMGE.
✅ Updated Notes, Colour-Coded Workbooks & Question Banks
MedNext provides students with meticulously curated study material:
Fully updated notes aligned with the latest FMGE trends
Colour-coded workbooks for visual learners
Frequently tested MCQs and past-year questions
Smart revision tools to aid last-minute prep
This material is crafted to maximize learning efficiency and recall.
✅ Rigorous Testing with In-Depth Analysis
Regular assessments are a key pillar at MedNext. Students participate in:
Subject-wise tests
Full-syllabus mock exams
Real-time feedback & performance analytics
These tests not only simulate the FMGE environment but also help students track progress, improve time management, and work on weak areas.
✅ Flexible Learning Options: Offline + Online
Understanding the needs of diverse students, MedNext offers:
Offline classroom programs for immersive, face-to-face learning
Live and recorded online sessions for remote learners
A supportive digital platform for online doubt clearance and tracking
This hybrid approach ensures students from across India (and beyond) can benefit from MedNext’s resources.
✅ Personalized Mentorship
FMGE prep can be mentally and emotionally taxing. MedNext’s mentors not only teach but also inspire, motivate, and guide students through ups and downs. The institute’s small-batch strategy ensures every student gets personal attention, academic planning, and emotional support.
✅ Strong Track Record of Success
What truly sets MedNext apart is its consistent delivery of outstanding results. With a growing list of top scorers, high pass rates, and first-attempt qualifiers, MedNext has become a trusted launchpad for FMGE success.
“MedNext didn’t just help me study — it helped me believe I could succeed,” shares Md Sabir I, who scored 162 in FMGE Jan 2025.
The MedNext Edge
🧠 Structured syllabus completion
🎯 Focused revision plans
📝 Smart MCQ solving techniques
🩺 Clinical scenario training
🧑🏫 Faculty who understand what FMGE demands
Whether you’re a repeater or a first-time test-taker, MedNext helps you move forward with clarity and confidence.
Visit MedNext – Your Gateway to Medical Practice in India
Strategically located in Gautam Nagar, New Delhi, MedNext is accessible from all major transport routes and offers a peaceful academic environment. The institute attracts students from across India and even from abroad, making it a vibrant community of future doctors.
Ready to Begin Your FMGE Journey?
Join thousands of successful MedNext students who have transformed their preparation into success. Admissions are currently open for the upcoming FMGE batch.
📞 Call Now: 9144666601 / 9144666602 📍 Location: F-130/5, Gautam Nagar, Near Gurukul Gali, New Delhi - 110049 🌐 Website: www.mednextedu.com 📱 Instagram & Facebook: @mednextdelhi
#MedNext #FMGE2025 #FMGEPreparation #FMGECoachingDelhi #BestFMGEInstitute #FutureDoctorsIndia #MedicalCoaching #FMGESuccess #MedNextDelhi #FMGEClasses
Let MedNext be the difference between doubt and success in your FMGE journey.
0 notes
Text
Using a Data Analytics Institute in Pune to Unleash Data Power
Data is the backbone of every business choice in today's digital society. Maintaining competitiveness as businesses expand and diversify will need knowledge and data analysis. Anyone wishing to explore the field of data analysis should start at a Data Analytics Institute in Pune , which is a fantastic starting point. A planned curriculum, industry-relevant tools, and professional advice from these institutions help students acquire a strong knowledge of data analytics. Students can be taught how to draw insightful analysis from data with the appropriate training, hence promoting informed decision-making in many industries.
Why Select Data Analytics Training in Pune?
Known as the academic centre of India, Pune offers a really perfect place for college students wishing to improve their facts and analytics information. The Data Analytics Training in Pune objectives to empower people with the realistic expertise and equipment had to reach this area.
Training courses in Pune guarantee that students are well-prepared for the always-changing, data-driven employment market by combining theoretical knowledge with practical experience. Students not only get the technical knowledge of data analytics but also experience actual applications, hence preparing them for the industry upon graduation.
Practical Training and Industry-Relevant Curriculum
One of the main attractions of the Data Analytics Institute in Pune is its thorough programmatic fit with business needs. From machine learning to predictive analytics to data visualization, the course material is meant to give a detailed knowledge of the tools and methods employed in the data analytics scene. By including live projects and case studies in the curriculum, the colleges in Pune provide pragmatic exposure. This strategy guarantees that pupils apply theoretical ideas to address practical issues as well as understand them. Students will be competent in using well-known data analytics tools, including Python, R, SQL, and Tableau, by the end of the training.
Increasing Job Prospects in Data Analytics
Across sectors, inclusive of healthcare, banking, retail, and advertising, the want for facts analytics professionals has been continuously rising. Enrolling at a Data Analytics Institute in Pune enables human beings to qualify for an aggressive job marketplace wherein companies are actively searching out qualified facts analysts to investigate complicated information units. Graduates from reputable universities have the know-how and talents to assume positions like statistics analyst, enterprise intelligence analyst, and facts scientist. Pune, being near enormous IT centres, also provides plenty of career chances for statistics analysts.
Data Analytics' Influence on Decision-Making
Data analytics is vital for businesses if you want to make smart choices. Through the exam of sized fact sets, agencies can discover developments, patterns, and correlations that generate actionable insights. The correct Data Analytics Training in Pune enables people to apply these insights for efficient decision-making. Data-pushed methods, for example, can help agencies forecast destiny marketplace traits, decorate customer enjoyment, or maximize their advertising and marketing plans. The demand for equipped statistics employees has in no way been more crucial as groups depend increasingly more on records to fuel growth.
Busy professionals' flexible learning choices
For working professionals who want to upskill or change careers, Data Analytics Training in Pune's flexibility makes it a desirable choice. Many colleges provide online training possibilities, evening sessions, and weekend batches that fit workers with busy schedules. These flexible learning paths guarantee that people may follow their love for data analytics without sacrificing their present employment. Moreover, the accessibility of virtual labs and online materials lets students hone their abilities at their speed, hence facilitating more accessible and practical education.
Conclusion
Signing up for Data Analytics Training in Pune opens the door to a bright future in a fast-expanding sector. Pune has emerged as a centre for data analytics education in India with its industry-relevant curriculum, knowledgeable teachers, and hands-on training. Joining an institution like sevenmentor.com helps students not only acquire education but also get professional advice to enable them to find the ideal employment in this demanding sector. Pune has the tools and chances to help you thrive in the data analytics field, whether you want to improve your current abilities or launch a new career.
0 notes
Text
Limited-Time Offer: Get 10% Off on Professional Statistics Homework Assistance!

Statistics can be a challenging subject, requiring analytical skills, logical reasoning, and a deep understanding of data interpretation. If you're feeling overwhelmed with your assignments, you're not alone. At Statistics Homework Help, we provide expert assistance to students who need reliable, high-quality support with their coursework. To make our services even more accessible, we are excited to introduce a limited-time offer—get 10% off on all professional statistics homework assistance. Use Refer Code: SHHR10OFF to claim your discount and take advantage of this opportunity to excel in your statistics studies!
Why Choose Our Statistics Homework Help Service?
We understand that every student has unique learning needs and academic goals. Our service is designed to provide personalized solutions that cater to these individual requirements. Here’s why students trust us with their statistics homework:
Expert Assistance: Our team consists of highly qualified statisticians and academic professionals who are experienced in various statistical concepts, from basic probability to advanced data analysis.
Accurate and Well-Structured Solutions: We ensure that all assignments are well-organized, thoroughly researched, and properly formatted to help students achieve top grades.
Timely Delivery: Deadlines are crucial, and we guarantee on-time submission to ensure you never miss an important due date.
Plagiarism-Free Work: All assignments are written from scratch and thoroughly checked for originality.
24/7 Support: Our customer service team is available around the clock to assist you with queries and order placements.
Our Range of Statistics Homework Services
We offer comprehensive assistance in a variety of statistics topics, including but not limited to:
Descriptive Statistics: Understanding data summaries, measures of central tendency, and variability.
Inferential Statistics: Hypothesis testing, confidence intervals, and probability distributions.
Regression Analysis: Simple and multiple regression models, correlation analysis.
Probability Theory: Conditional probability, Bayes’ theorem, and probability distributions.
Statistical Software Assistance: SPSS, R, SAS, Python, Excel, and MATLAB for statistical computations.
No matter the complexity of your assignment, we have the expertise to guide you through it effectively.
How to Avail the Limited-Time 10% Discount?
Getting professional help has never been easier. Follow these simple steps to claim your 10% discount:
Submit Your Assignment: Provide us with the details of your homework, including specific instructions and deadlines.
Get a Quote: Our team will review your requirements and provide a fair price quote.
Apply the Discount Code: Use Refer Code: SHHR10OFF to get 10% off your total price.
Receive Expert Help: Our professionals will work on your assignment and deliver a well-researched, high-quality solution within the stipulated time.
Act fast! This offer is available for a limited time only—secure your discount today and experience stress-free statistics learning.
Why Timely Statistics Homework Assistance is Crucial for Academic Success
Statistics is a subject that requires continuous practice and understanding. Without timely guidance, students often struggle to grasp key concepts, leading to poor performance in exams and assignments. By seeking professional assistance, you ensure that:
You receive clear and well-explained solutions to complex problems.
You gain a deeper understanding of statistical methods and their real-world applications.
You improve your grades and academic confidence.
You manage your time more effectively by focusing on learning rather than stressing over deadlines.
Our experts are committed to making statistics easier for you. Whether you need step-by-step explanations or complete solutions, we are here to help!
Secure Your Academic Success with Statistics Homework Help
Don’t let statistics homework challenges hold you back from achieving your academic goals. With Statistics Homework Help, you can access expert guidance, well-researched solutions, and timely support—all at an affordable price. Plus, with our limited-time 10% discount, there’s no better time to invest in your education.
Get started today! Submit your assignment and use Refer Code: SHHR10OFF to claim your 10% discount. Let us help you excel in your statistics coursework and achieve the grades you deserve!
For any inquiries, our support team is available 24/7 to assist you. Reach out now and experience the best in professional statistics homework assistance.
#statistics homework help#education#statistics assignment help#university#homeworkhelp#statisticshomeworkhelp#statisticshelp#academicsuccess#assignmenthelp#statisticshomework
0 notes
Text
ICAI CA Foundation 2025: Most Important Chapters & Weightage Analysis

The CA Foundation exam is the first step for aspiring Chartered Accountants, and strategic preparation is key to clearing it on the first attempt. Understanding the most important chapters and their weightage can help students focus on high-scoring areas and improve their overall performance. With the growing popularity of CA coaching classes and CA Online Classes, students now have access to expert guidance and structured study plans.
Understanding the CA Foundation Exam Structure
The CA Foundation exam consists of four subjects:
Principles and Practice of Accounting
Business Laws and Business Correspondence and Reporting
Business Mathematics, Logical Reasoning, and Statistics
Business Economics and Business and Commercial Knowledge
Each subject carries 100 marks, and the exam is conducted in both subjective and objective formats. Effective preparation through CA coaching classes and CA Online Classes helps students grasp concepts efficiently.
Subject-Wise Important Chapters & Weightage Analysis
Principles and Practice of Accounting
This subject forms the base for advanced accounting studies and is one of the most crucial parts of the CA Foundation syllabus. Key chapters include:
Accounting Process (20-25%) – Covers journal entries, ledger posting, and trial balance preparation.
Partnership Accounts (15-20%) – Includes profit-sharing, admission, retirement, and dissolution.
Company Accounts (15%) – Essential for understanding corporate financial statements.
Final Accounts of Sole Proprietors (10-15%) – Covers preparation of trading, profit & loss accounts, and balance sheets.
Students enrolled in CA coaching classes or CA Inter Online Classes get in-depth explanations for these chapters to strengthen their accounting foundation.
Business Laws and Business Correspondence and Reporting
This subject focuses on legal frameworks and communication skills. Important chapters include:
Indian Contract Act, 1872 (20-25%) – Essential concepts like agreements, consideration, and contractual obligations.
Sale of Goods Act, 1930 (10-15%) – Covers the formation of contracts, conditions, and warranties.
Companies Act, 2013 (15-20%) – Includes company formation, MOA, AOA, and corporate compliance.
Business Correspondence (10%) – Focuses on letter writing, business communication, and drafting skills.
Business Mathematics, Logical Reasoning, and Statistics
This subject is highly scoring for students who focus on conceptual clarity. Key chapters include:
Ratio, Proportion, and Indices (10-15%) – Fundamental for financial calculations.
Time Value of Money (15-20%) – Includes simple and compound interest, annuities, and EMIs.
Permutation and Combination (10-15%) – Frequently tested in exams.
Logical Reasoning (20-25%) – Covers number series, coding-decoding, syllogisms, and direction sense.
Statistics (15-20%) – Includes measures of central tendency, probability, and correlation.
CA Foundation Classes provide problem-solving techniques to master these topics efficiently.
Business Economics and Business and Commercial Knowledge
This subject tests students’ understanding of economic principles and the business environment. Important chapters include:
Microeconomics (20-25%) – Demand, supply, elasticity, and consumer behavior.
Macroeconomics (15-20%) – National income, inflation, and economic policies.
Business Cycles (10-15%) – Covers phases of economic fluctuations.
Indian Financial System (10%) – Banking sector, financial institutions, and markets.
Enrolling in CA coaching classes helps students grasp economic concepts better and apply them in real-world scenarios.
Visit For More Info: https://ultimateca.com/
How to Utilize Weightage Analysis for Better Preparation
Understanding the weightage of each chapter allows students to create a study plan that prioritizes high-scoring topics. Here are some strategies:
Focus more on high-weightage topics such as Accounting Process, Business Laws, Logical Reasoning, and Microeconomics.
Revise frequently tested chapters multiple times to ensure retention.
Practice mock tests provided in CA Online Classes to improve speed and accuracy.
Use study materials and recorded lectures available in CA Inter Online Classes for concept clarity.
Conclusion
Preparing for the CA Foundation exam requires a well-structured approach, and knowing the important chapters and weightage helps students streamline their studies. CA coaching classes and CA Online Classes provide expert guidance, making learning more effective. With consistent effort, a strategic plan, and access to high-quality CA Foundation Classes, students can successfully clear the CA Foundation exam in 2025 and take a significant step toward a promising career in Chartered Accountancy.
#CA Online Classes#CA Foundation exam#CA coaching classes#CA Foundation Classes#CA Inter Online Classes#Ultimateca#Business Laws#Chartered Accountants#strategic plan
0 notes
Text
How Can Understanding Effect Sizes Improve Your Statistics Homework
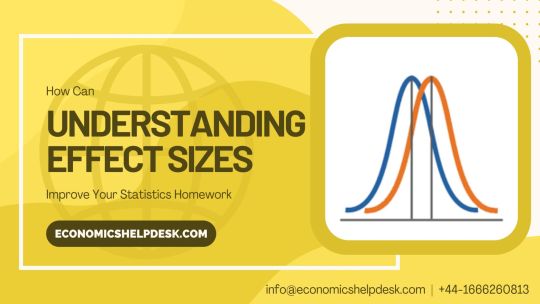
When working on your stats assignment, you’ve probably encountered situations where you’re asked to decide whether a result is significant. Maybe you ran a t-test and got a p-value of 0.03. That’s significant at the 0.05 level—but does that really tell you how big the result is?
This is where effect sizes come in. They go beyond a simple “yes or no” answer from statistical significance and give you a way to interpret results. Understanding effect sizes can not only improve your stats thinking but also make your stats homework more informative and precise.
In this article, we’ll break down effect sizes in a way that makes sense, using real-life examples. So, next time you think, “Can someone help me for statistics homework on effect sizes?”—you’ll already have the answers!
Why Effect Size Matters More Than Just Statistical Significance in Your Stats Homework
A common misconception among students is that a statistically significant result always means a big or important result. That’s just not true.
Here’s an example:
Suppose you compare the test scores of two groups of students and find that Group A scores higher than Group B, with a p-value of 0.049. Significant? Yes.
But what if the actual difference between the means of the two groups is just 0.5 points on a 100-point test? Meaningful? Not really.
Effect size tells us how big or important this difference is, not just whether it exists. This makes your stats assignments more nuanced and complete.
Types of Effect Sizes and When to Use Them in Your Stats Assignments
Depending on the type of analysis you’re doing, there are different measures of effect size you can use. Let’s go through the most common ones you’ll encounter.
1. Cohen’s d: How Much of a Difference Between Two Groups?
If you’re working with t-tests (comparing two groups), Cohen’s d is your go-to effect size measure. It tells you how far apart the two group means are in terms of standard deviations.
Formula for Cohen’s d:
d = (Mean of Group 1−Mean of Group 2)/Pooled Standard Deviation
Example:
You’re comparing the test scores of two different teaching methods:
Old Method: Mean = 75, SD = 10
New Method: Mean = 80, SD = 10
d=80−75/10=0.5
According to rules of thumb:
0.2 = Small
0.5 = Medium
0.8+ = Large
So, here we have a medium effect size, so the new method has some impact.
2. Pearson’s r: How Strong is the Relationship Between Variables
When you’re doing correlation analysis, Pearson’s r measures the strength and direction of the relationship between two variables.
Example:
If you analyze the relationship between study hours and exam scores and find r = 0.6, that means there’s a moderate to strong positive correlation—more study hours means higher scores.
But if r = 0.1, even though it’s statistically significant, the effect size is so small that studying more won’t make much of a difference.
3. R² (Coefficient of Determination): How Well Does Your Model Explain Variance
In regression analysis, R² tells you how much of the variance in the dependent variable is explained by the independent variable(s).
Example:
If you build a model predicting final exam scores based on attendance rate, and R² = 0.85, that means 85% of the variance in exam scores is explained by attendance—very strong!
If R² = 0.20, only 20% of the variance is explained, so there’s other factors to consider.
How Knowing Effect Size Helps You Score Higher on Statistics Assignments
You might be wondering—how does knowing effect sizes actually help me on my statistics assignments?
1. Helps You Interpret Results Better
Just reporting a p-value without an effect size is incomplete. Professors love when you go the extra mile to explain how big a result is, not just whether it’s statistically significant.
2. Avoids Misleading Conclusions
If you only focus on statistical significance, you might misconstrue a result. A tiny but statistically significant effect doesn’t mean it’s important in practice.
3. Strengthens Your Research and Data Analysis Skills
Effect sizes are used in real research, psychology, medicine, economics. Master them now and you’ll be ahead when dealing with real data in your future career.
Hands-On Example: Let’s Apply Effect Size to a Simple Statistics Homework
Problem: Comparing Two Study Methods
Suppose you do a study comparing two study techniques:
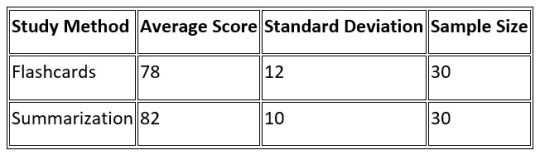
Your t-test gives a p-value = 0.04, so the difference is statistically significant. But let’s calculate the effect size (Cohen’s d):
d = (82−78)/{(12+10)/2}=411≈0.36
A d of 0.36 means small to moderate effect size. While the result is statistically significant, the actual effect of study methods isn’t big.
This extra layer of explanation will impress your professor and help you shine in your statistics homework!
Conclusion: Next Time You Think “Help Me for Statistics Homework,” Remember Effect Sizes
Effect sizes add depth to your statistical analysis. They go beyond “significant vs. not significant” and help you understand the practical impact of your results. So next time you work on a statistical problem or look for someone who can help you with statistics assignment, don’t just stop at the p-value—calculate the effect size and make your analysis more meaningful!
#statistics homework help#stats assignment#Statistical Significance#p-value#t-tests#correlation analysis#misconstrue#Data Analysis
0 notes
Text
Fortinet NSE 8: Mastering Advanced Threat Protection and Network Security

1 . Introduction to Advanced Threat Protection in Fortinet NSE 8
The Fortinet NSE 8 (fcx) certification is the pinnacle of network security expertise, focusing on mastering advanced threat protection strategies and network security protocols. As cybersecurity threats evolve, professionals equipped with NSE 8 skills are essential in defending critical infrastructures. This certification provides a deep dive into Fortinet’s security solutions, including FortiGate, FortiSIEM, and intrusion prevention systems, enabling experts to safeguard networks effectively. Additionally, the FCX Certification in cybersecurity complements the knowledge gained from NSE 8, offering a well-rounded approach to securing modern data centers and networks. This guide will help you prepare for the NSE 8 exam and succeed in mastering advanced security practices.
2 . Key Threats and Attack Vectors Covered in NSE 8
Fortinet NSE 8 delves into a variety of cyber threats and attack vectors that enterprises face:
Advanced Persistent Threats (APTs): These long-term, targeted attacks often evade detection and require continuous vigilance.
Distributed Denial of Service (DDoS) Attacks: Aimed at overwhelming systems, these attacks can cripple services without proper protection.
Ransomware: A growing threat where malicious actors demand payment after locking down critical systems.
Zero-Day Vulnerabilities: Attacks exploiting unknown vulnerabilities in software or hardware before fixes are available.
Botnets: Networks of compromised devices used to execute large-scale attacks such as DDoS.
Phishing and Social Engineering: Techniques used by cybercriminals to trick individuals into providing confidential information.
3 . Fortinet’s Approach to Threat Protection
Fortinet provides a multi-layered approach to network security, offering several tools and systems to counter evolving threats:
FortiGate Firewalls: These devices are integral to network security, protecting against unauthorized access while supporting deep packet inspection (DPI).
FortiSandbox: An advanced tool that isolates potential threats in a controlled environment to assess their behavior before they can affect the network.
FortiAnalyzer: Provides detailed analytics and forensics to aid in threat detection and response.
FortiWeb: Specialized protection against web application attacks, such as SQL injection and cross-site scripting (XSS).
FortiMail: Protects against email-based threats like spam and phishing.
4 .Mastering Intrusion Prevention and Detection Systems (IPS/IDS) with Fortinet
Intrusion Prevention Systems (IPS) and Intrusion Detection Systems (IDS) are crucial components in defending against threats:
IPS actively prevents malicious activities by blocking suspicious traffic.
IDS detects threats by monitoring network traffic and alerts administrators when abnormal behavior is detected.
Signature-Based Detection: Detects known threats by comparing traffic to a database of known attack signatures.
Anomaly-Based Detection: Identifies new or unknown attacks by recognizing deviations from established traffic patterns.
5 . Leveraging FortiSIEM for Real-Time Threat Intelligence
FortiSIEM integrates security information and event management with real-time threat intelligence. It provides a centralized platform for monitoring and correlating events across your network:
Real-time monitoring of security events.
Automated incident responses.
In-depth analysis for better decision-making.
Correlation and Analytics: Combining data from multiple sources to identify and analyze potential threats.
Compliance Monitoring: Helps meet industry-specific security and regulatory standards.
6 . Network Segmentation and Micro-Segmentation in Fortinet Security
Network segmentation is a critical technique in limiting the spread of attacks. Fortinet’s FortiGate solutions enable micro-segmentation and network isolation to prevent lateral movement by attackers:
Network Segmentation: Dividing the network into smaller, manageable segments for improved security.
Micro-Segmentation: A granular approach that isolates individual workloads, ensuring that even if a threat breaches one segment, it cannot spread to others.
Virtual LANs (VLANs): A method for logically dividing a network into sub-networks to reduce the attack surface.
Security Zones: Fortinet’s approach to separating traffic and controlling access to specific areas of the network.
7 . Automation and Orchestration in Fortinet’s Threat Protection
Fortinet solutions incorporate automation and orchestration to streamline security operations:
FortiManager: Manages security policies and configurations across multiple FortiGate devices, automating updates and management tasks.
FortiOS Automation: Automates responses to security events, helping to reduce human error and response times.
Playbooks: Custom workflows that automate the handling of security events from detection to remediation.
Centralized Management: Offers a unified interface for managing security infrastructure, reducing administrative overhead.
8 . Best Practices for Network Security in Enterprise Environments
Fortinet emphasizes best practices for securing enterprise networks:
Regular Vulnerability Scanning: Identify potential weaknesses before attackers can exploit them.
Multi-Factor Authentication (MFA): Strengthen access control by requiring multiple forms of authentication.
Zero Trust Architecture: Assume no one inside or outside the network is trusted, and verify all requests.
Encryption: Protect sensitive data both in transit and at rest, ensuring compliance with security regulations.
Patch Management: Regularly update software and hardware to close known vulnerabilities.
9 . Case Studies: Real-World Applications of Fortinet’s Advanced Threat Protection
Understanding how Fortinet's security tools are used in real-world scenarios helps solidify theoretical knowledge. In NSE 8, you’ll explore case studies, including:
Financial Institutions: Protecting against fraud, securing transactions, and ensuring compliance.
Healthcare: Safeguarding patient data with encryption, firewalls, and segmentation.
Retail: Securing e-commerce platforms from data breaches and DDoS attacks.
Education: Securing campus networks from internal and external threats.
Government Agencies: Ensuring compliance with regulatory standards while defending against sophisticated attacks.
10 . Preparing for the NSE 8 Exam: Focus Areas for Threat Protection and Security Mastery
To excel in the Fortinet NSE 8 exam, focus on mastering these critical areas:
Advanced Threat Protection: Study how to mitigate complex threats such as APTs and ransomware.
Intrusion Detection & Prevention: Learn the fine details of configuring IPS and IDS for optimal protection.
FortiSIEM: Understand how to leverage FortiSIEM for enhanced visibility and incident response.
Network Segmentation: Master segmentation strategies to protect critical resources.
Automation: Understand how to automate security tasks to enhance operational efficiency.
Conclusion
In conclusion, achieving Fortinet NSE 8 certification is a significant milestone for any network security professional. By mastering advanced threat protection strategies, leveraging tools like FortiSIEM, and applying best practices in network segmentation and automation, you'll be equipped to handle the most complex security challenges.
The knowledge and skills gained through Fortinet NSE 8 training will not only prepare you for the certification exam but also empower you to implement robust, scalable security solutions in any enterprise environment. Pursuing this certification is a powerful step toward becoming a trusted expert in the ever-evolving world of cybersecurity.
0 notes
Text
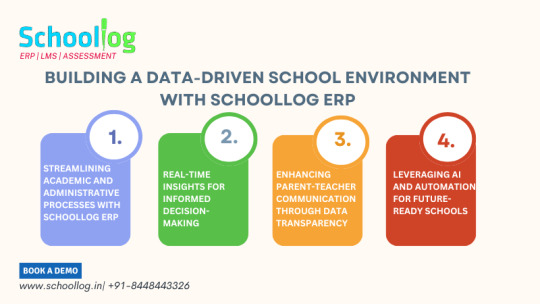
Building a Data-Driven School Environment with Schoollog ERP
In today's fast-evolving educational landscape, data-driven decision-making has become inevitable for schools that want to achieve operational efficiency and academic excellence. A data-driven school environment takes the actionable insights derived from the collected data to administer the process, improve student results, and enhance overall institutional performance. Schoollog ERP is a robust solution to enable schools to build just such an environment seamlessly.
Importance of Data-Driven Approach in Education
Education involves decisions with a consequence on students, teachers, and a larger school community. Information-driven decisions ensure that facts regarding the making of those decisions are accurate and as current as possible, and not based on assumptions with guesswork and speculation. Schools can have their trends followed, track, and have areas of concern identified with a proactive approach in culture within learning and development.
It includes data, from tracking academic performances and attendance to financial planning and resource allocation. But the management and analysis of all this manually sometimes becomes too overwhelming. This is where Schoollog Best ERP Software comes in to streamline such processes and provide valuable insights.
How Schoollog ERP Transforms Schools
Centralized Data Management
Schoollog ERP is an all-inclusive platform for the storage and handling of all data regarding schools. From student and staff record-keeping to academic reports and financial details, the system centralizes information and presents it easily accessible. Thereby, the silos created by disparate tools are avoided to provide a holistic view of the performance of the institution.
Real-Time Analytics and Reporting
Another excellent feature of Schoollog ERP is that it provides real-time analytics and detailed reports. The administrator can view the KPIs related to student attendance, exam results, and teacher performance. All this can help in taking timely interventions either on declining grades or on classroom engagement.
Academic Planning Improves
With data on how the students are doing and what kind of learning trends are apparent, teachers are better equipped to craft better lesson plans for fitting diverse student needs and teach more effectively.
Schoollog ERP also supports curriculum mapping and can track the journey of a student. Thus, academic targets will correlate with the child's ability and institutional benchmark.
Improved Communication and Collaboration
There must be efficient communication among the stakeholders in the data-driven school. Schoollog ERP has a wide gap with the administrators, teachers, students, and parents bridged through the integrated tools of communication. Parents receive real-time updates on the performance of their child while teachers and administrators can effectively collaborate to address issues or plan activities.
Resource Allocation
Schoollog ERP provides insights into data to allow the schools to utilize their resources in the most effective way possible. It can range from budgeting to staffing and infrastructure development; with this platform, it allows resources to be channeled where they are actually needed, and not wastefully spent.
Advantages of a Data-Driven School Environment
The advantages that Schoollog ERP could offer to schools are numerous and include:
Improved Decision Making: The accuracy and time sensitivity of data provided mean proper decision making.
Increased Transparency: Stakeholders are able to view processes and outcomes clearly.
Improved Student Outcomes: Personalized learning strategies, based on data, result in better academic performance.
Operational Efficiency: Automating and centralizing many systems reduce administrative burdens.
Conclusion
A data-driven school environment is not an option but a requirement for schools to remain competitive and provide quality education. Schoollog ERP is the tool and technology needed to change the way schools function and ensure that data forms the core of decision-making. The introduction of Schoollog ERP enables schools to empower their staff, engage their students, and achieve academic and administrative goals effectively.
#Best erp software#school management system#school software#erp for schools#school management software
0 notes
Text
Mastering SAS: A Comprehensive Guide to Certification Training
In today’s data-driven world, SAS (Statistical Analysis System) has become one of the most widely used programming languages and software platforms for statistical analysis and data management. Organizations across industries, including healthcare, finance, and research, rely on SAS for its powerful data analysis capabilities, making it an essential tool for professionals looking to advance their careers in analytics and data science.
For those interested in mastering SAS, obtaining a SAS certification can significantly boost one’s credentials and open doors to new career opportunities. Whether you’re an aspiring data scientist, a statistician, or a clinical researcher, SAS certification training is a key step in achieving proficiency in the software and demonstrating your expertise to employers. In this comprehensive guide, we will explore the benefits of SAS certification, essential topics covered in the training, and how to successfully navigate the certification process.
Why Get SAS Certified?
SAS certification is a globally recognized credential that demonstrates your proficiency in using SAS software for data management, statistical analysis, and reporting. As businesses and organizations increasingly rely on data to drive decision-making, the demand for professionals skilled in SAS programming continues to grow. Here are a few reasons why getting SAS certified can benefit your career:
1. Career Advancement: SAS-certified professionals are highly sought after by employers in industries such as pharmaceuticals, healthcare, finance, and marketing. Certification is often a requirement for roles like data analyst, clinical data manager, and business intelligence analyst.
2. Increased Earning Potential: Many SAS-certified professionals enjoy higher salaries compared to their non-certified peers. Employers are willing to pay a premium for individuals who can effectively leverage SAS tools to analyze complex data and generate valuable insights.
3. Industry Recognition: Earning a SAS certification demonstrates your commitment to professional development and your ability to apply SAS tools in real-world scenarios. It can help you stand out in a competitive job market.
4. Skill Mastery: Certification training helps you develop a deep understanding of SAS software, from basic programming to advanced statistical procedures. By the end of the training, you’ll have a solid grasp of data manipulation, statistical analysis, and report generation.
Key Topics Covered in SAS Certification Training
The SAS certification training program covers a wide range of topics, from fundamental programming skills to advanced statistical methods. Here are the essential areas you’ll need to master to pass the certification exams:
1. Introduction to SAS Programming
- Overview: This foundational topic covers the basic syntax and structure of SAS programs. You’ll learn how to write and execute SAS code, work with data steps and procedures, and import/export data from different file formats.
- Key Skills: Data manipulation, working with SAS libraries, and using basic SAS functions for data processing and reporting.
2. Data Management and Manipulation
- Overview: This topic focuses on managing large datasets efficiently using SAS. You’ll learn techniques for merging, appending, sorting, and filtering data, as well as handling missing values.
- Key Skills: Data sorting, merging datasets, creating new variables, and transforming data for analysis.
3. Statistical Analysis with SAS
- Overview: SAS is widely used for statistical analysis, and this section of the training introduces you to the various statistical methods you can apply using SAS tools.
- Key Skills: Descriptive statistics, regression analysis, hypothesis testing, ANOVA (Analysis of Variance), and correlation analysis.
4. Advanced Statistical Procedures
- Overview: Building on the basic statistical techniques, this advanced topic covers more complex analysis, including time-series analysis, logistic regression, survival analysis, and other specialized methods.
- Key Skills: Running advanced SAS procedures (e.g., PROC REG, PROC GLM, PROC LIFETEST) and interpreting the results.
5. SAS Macro Programming
- Overview: SAS macros allow you to automate repetitive tasks, making your code more efficient and reusable. This section covers how to create and debug SAS macros.
- Key Skills: Macro variables, conditional logic in macros, and debugging techniques.
6. Data Visualization and Reporting
- Overview: SAS offers powerful tools for creating reports and visualizations to present data findings clearly. You’ll learn how to generate tables, graphs, and charts using procedures like `PROC REPORT`, `PROC TABULATE`, and `PROC SGPLOT`.
- Key Skills: Creating professional reports, visualizing data with graphs and charts, and presenting complex data in an easy-to-understand format.
The Path to SAS Certification
1. Choose the Right Certification Exam: SAS offers several certification exams based on your skill level and area of focus. Some of the most popular exams include:
- SAS Certified Base Programmer
- SAS Certified Advanced Programmer
- SAS Certified Clinical Trials Programmer
- SAS Certified Statistical Business Analyst
2. Prepare for the Exam: Proper preparation is key to success. You can enroll in online training courses, attend workshops, or use SAS’s official study materials and practice exams. It’s also a good idea to engage with online communities, such as forums and social media groups, to exchange tips and advice with fellow exam candidates.
3. Take the Exam: SAS certification exams are typically conducted at Pearson VUE test centers or online through remote proctoring. The exams are multiple-choice and typically last between 2 and 3 hours. Be sure to review the exam objectives and sample questions before the exam.
4. Maintain Your Certification: After earning your certification, you’ll need to keep your skills up to date. SAS offers recertification options, and you may need to take additional exams or courses to maintain your certified status.
Conclusion
Mastering SAS and earning your SAS certification can significantly enhance your career prospects, opening doors to a wide range of opportunities in data analytics, statistical analysis, and clinical research. Whether you’re just starting out in the field or are looking to advance your skills, SAS certification training offers the knowledge and hands-on experience you need to succeed.
With comprehensive training covering essential topics like data management, statistical analysis, macro programming, and reporting, you’ll be well-equipped to pass the SAS certification exam and demonstrate your expertise in the field. So, if you’re ready to take your career to the next level, mastering SAS is the first step towards becoming a recognized expert in the world of data analytics.
0 notes
Text
CUET PG Statistics Question Paper: Your Gateway to Success in CUET PG 2025
Preparing for the CUET PG 2025? If you’re aiming to ace the Statistics section, you’ve landed at the right place. Accessing the CUET PG Statistics Question Paper, especially previous year’s papers, is an invaluable step toward effective preparation. This article dives deep into how these resources can give you an edge and ensure success in the competitive exam.
Why Focus on CUET PG Statistics Question Paper?
The CUET PG Statistics Question Papers serve as a blueprint of what to expect in the actual exam. They help students:
Understand Exam Patterns: Previous year question papers (PYQs) showcase the types of questions, distribution of marks, and key topics.
Identify Important Topics: By analyzing PYQs, you can pinpoint the recurring concepts and focus your studies effectively.
Practice Time Management: Solving past papers under timed conditions improves speed and accuracy.
Boost Confidence: Familiarity with the format and difficulty level reduces exam anxiety.
Key Benefits of CUET PG Statistics PYQs
1. Insight into Core Topics PYQs are a treasure trove of information. They often highlight key topics like:
Descriptive Statistics
Probability Distributions
Hypothesis Testing
Regression and Correlation Analysis
Sampling Techniques
Knowing these areas ensures your preparation aligns with the syllabus’s core demands.
2. Understanding Question Types PYQs allow students to practice various question types, including:
Multiple-choice questions (MCQs)
Numerical problems
Conceptual questions
By solving these, students develop a better grip on both theory and application.
3. Tailored Preparation for CUET PG 2025 The CUET PG Statistics PYQs help students anticipate what could appear in the upcoming exam. Revisiting the 2024 and earlier question papers provides insights into changing trends and patterns.
Where to Find CUET PG Statistics Question Papers
Accessing authentic CUET PG Statistics Question Papers is crucial. Here are reliable sources:
Official CUET Website: The official portal frequently updates previous year’s question papers.
Educational Platforms: Websites and apps dedicated to competitive exams often provide curated PYQs with solutions.
Coaching Institutes: Many coaching centers offer comprehensive study materials, including past year question papers.
Tips for Using CUET PG Statistics PYQs Effectively
Start Early: Begin solving question papers as soon as you complete key portions of the syllabus.
Simulate Exam Conditions: Attempt papers in a timed setting to mimic the real exam.
Analyze Mistakes: Review incorrect answers and revisit those concepts to strengthen your understanding.
Track Progress: Compare your performance across multiple papers to monitor improvement.
CUET PG 2025: Your Preparation Strategy
To maximize your performance in CUET PG Statistics:
Combine PYQs with Mock Tests: Use question papers alongside full-length mock tests for comprehensive practice.
Focus on Weak Areas: PYQs highlight gaps in your preparation, allowing you to target weaker sections.
Stay Consistent: Solve at least one CUET PG Statistics Question Paper weekly for consistent progress.
Final Thoughts
The CUET PG Statistics Previous Year Question Papers are a goldmine for aspirants aiming for top scores in CUET PG 2025. They provide clarity, build confidence, and sharpen your exam strategy. By integrating PYQs into your study plan, you can significantly enhance your chances of cracking the exam with flying colors.
Make the most of these resources today and set the stage for your success in the CUET PG 2025 Statistics exam!
0 notes