#DHT22 Temp/Humidity Sensor
Explore tagged Tumblr posts
Visit Tumblr Blog
Explore Tumblr blogs with no restrictions, modern design and the best experience.
Last Seen Tumblr Blogs


Fun Fact
China blocked Tumblr because of pornography and censorship problems in 2013.
Text
DIY Air Quality Monitoring System
Introduction
In this DIY guide, we’ll walk you through building an Air Quality Monitoring System to keep tabs on the air quality in your home or surrounding environment. This project collects and tracks key air quality metrics — such as CO2 levels, PM2.5 particles, temperature, and humidity — and displays them in real time on a mobile app or web dashboard. Perfect for health-conscious individuals, this IoT project provides valuable insights into your environment and helps you make adjustments to improve indoor air quality.
Why Build an Air Quality Monitoring System?
The air we breathe has a direct impact on our health, yet indoor air quality often goes overlooked. By monitoring indoor CO2 and particulate matter levels, as well as temperature and humidity, you can create a healthier living space. This system helps you identify potential air quality issues, like high CO2 levels or excessive dust particles, that may require ventilation or filtration.
Benefits of Monitoring Air Quality:
Healthier Environment: Improve indoor air quality by tracking harmful pollutants.
Real-Time Alerts: Get notified when air quality drops below safe levels.
Data-Driven Decisions: Use data insights to decide when to ventilate or clean the air.
Long-Term Tracking: Log data over time to see how seasonal or activity changes impact air quality.
Key Components and Technologies
To build your Air Quality Monitoring System, you will need:
Microcontroller: Use a Raspberry Pi or ESP32 to serve as the main control unit. Both offer robust processing power and easy integration with sensors and cloud platforms.
Air Quality Sensors:
CO2 Sensor: The MQ135 sensor is an affordable option for measuring CO2 levels.
PM2.5 Sensor: The PMS5003 sensor detects fine particulate matter in the air, which can contribute to respiratory issues.
Temperature and Humidity Sensor: DHT11 or DHT22 sensors monitor environmental conditions that can affect indoor air quality.
Wi-Fi Module: ESP32 has built-in Wi-Fi, while Raspberry Pi can connect via a Wi-Fi dongle or built-in module, enabling remote data access.
Cloud Service for Data Storage and Visualization:
Use platforms like Cloudtopiaa, Blynk, or Thingspeak to store, visualize, and analyze your data. Cloudtopiaa provides reliable cloud services with secure data storage and custom visualization options.
Additional Components:
Jumper wires and breadboard
Power supply for the microcontroller
Basic tools like a soldering iron if needed
Step-by-Step Guide
Step 1: Set Up the Microcontroller
Choose and Prepare Your Microcontroller:
For this guide, we’ll use a Raspberry Pi. Set up the latest version of Raspbian OS on the Raspberry Pi.
Connect the Components:
Attach the MQ135 CO2 sensor to one of the GPIO pins.
Connect the PMS5003 PM2.5 sensor to another GPIO pin.
Connect the DHT11 or DHT22 sensor for temperature and humidity.
Step 2: Install Required Libraries
Open the terminal on your Raspberry Pi and install the libraries necessary for sensor data collection and Wi-Fi connectivity.sudo apt-get update sudo apt-get install python3-pip pip3 install adafruit-circuitpython-mq135 pip3 install adafruit-circuitpython-pm25 pip3 install Adafruit_DHT
Step 3: Program the Sensors
Write a Python script to read data from each sensor. Here’s a basic example for reading CO2, PM2.5, temperature, and humidity data.import time import Adafruit_DHT import board import adafruit_mq135 import adafruit_pm25
# Setup DHT_SENSOR = Adafruit_DHT.DHT22 DHT_PIN = 4 CO2_SENSOR = adafruit_mq135.MQ135(board.A0) PM25_SENSOR = adafruit_pm25.PM25_UART(board.UART1)
def read_sensors(): # Read temperature and humidity humidity, temperature = Adafruit_DHT.read_retry(DHT_SENSOR, DHT_PIN) # Read CO2 level co2_level = CO2_SENSOR.co2 # Read PM2.5 level pm25_data = PM25_SENSOR.read() pm25 = pm25_data['pm25'] if 'pm25' in pm25_data else None return temperature, humidity, co2_level, pm25
while True: temp, humidity, co2, pm25 = read_sensors() print(f"Temperature: {temp}°C, Humidity: {humidity}%, CO2 Level: {co2} ppm, PM2.5: {pm25} µg/m³") time.sleep(10)
Step 4: Cloud Integration with Cloudtopiaa
Set Up a Cloudtopiaa Account: Sign up for Cloudtopiaa to leverage their reliable data storage and visualization capabilities.
Create an IoT Project: Set up a new project and get an API key to send sensor data.
Connect Your Microcontroller: Update your script to send data to Cloudtopiaa.
import requests
CLOUDTOPIAA_API_KEY = "Your_Cloudtopiaa_API_Key"
def send_data_to_cloud(temp, humidity, co2, pm25): url = "https://api.cloudtopiaa.com/v1/data" # Example endpoint payload = { "temperature": temp, "humidity": humidity, "co2": co2, "pm25": pm25 } headers = { "Authorization": f"Bearer {CLOUDTOPIAA_API_KEY}" } requests.post(url, json=payload, headers=headers)
while True: temp, humidity, co2, pm25 = read_sensors() send_data_to_cloud(temp, humidity, co2, pm25) print(f"Sent data to Cloudtopiaa: Temperature: {temp}°C, Humidity: {humidity}%, CO2: {co2} ppm, PM2.5: {pm25} µg/m³") time.sleep(600) # Send data every 10 minutes
Step 5: Set Up Data Visualization
Log in to your Cloudtopiaa account to view your data in real-time. Use built-in visualization options to create charts and graphs that track air quality metrics over time.
Step 6: Build a Mobile App or Web Dashboard
Use a platform like Cloudtopiaa’s dashboard, Blynk, or a custom web interface to create a user-friendly dashboard that displays current air quality data and historical trends.
Conclusion
You’ve successfully built an Air Quality Monitoring System to help maintain a healthier environment in your home or workspace. With this system, you can track real-time air quality, make data-driven decisions about ventilation, and improve indoor air conditions for better health. Cloudtopiaa’s secure storage and powerful visualization tools make it easy to monitor your air quality from anywhere.
Additional Resources
Cloudtopiaa Documentation
Raspberry Pi Documentation
Blynk IoT Platform
This project demonstrates skills in IoT health applications, environmental monitoring, and data visualization — valuable tools for creating a smarter, safer living environment.
#DIYAirQualityMonitor #IndoorAirQuality #TechForHealth #Cloudtopiaa #tec4bizsolutions #RealTimeData #ESP32 #IoTProjects #CO2Sensor #PM25Detection
0 notes
Video
youtube
iot based agriculture monitoring pump on/off using arduino with Manual / Automatic | Smart Agriculture IoT Solution - IoT Sensors (Soil Moisture, Humidity, Temperature) | Smart Irrigation System | Arduino Uno | DHT11 | Humidity Sensor | Soil Moisture Sensor | Relay | GSM Based Motor Controller in Irrigation by Using Sensor's [ Soil Moisture Tank Water Level ] | SMS Based Remote Agriculture Pump ON/OFF Control and Notification | IOT BASED SUBMERSIBLE MOTOR PUMPS ON/OFF | IoT Based Agriculture Monitoring | pH | Moisture | Light | Irrigation | Rain | Temp | Humidity | IOT Based Agriculture Monitoring and Controlling System using Arduino Uno.***********************************************************If You Want To Purchase the Full Working Project KITMail Us: [email protected] Name Along With You-Tube Video LinkWe are Located at Telangana, Hyderabad, Boduppal. Project Changes also Made according to Student Requirementshttp://svsembedded.com/ https://www.svskits.in/ http://svsembedded.in/ http://www.svskit.com/M1: 91 9491535690 M2: 91 7842358459 We Will Send Working Model Project KIT through DTDC / DHL / Blue Dart / First Flight Courier ServiceWe Will Provide Project Soft Data through Google Drive1. Project Abstract / Synopsis 2. Project Related Datasheets of Each Component3. Project Sample Report / Documentation4. Project Kit Circuit / Schematic Diagram 5. Project Kit Working Software Code6. Project Related Software Compilers7. Project Related Sample PPT’s8. Project Kit Photos9. Project Kit Working Video linksLatest Projects with Year Wise YouTube video Links157 Projects https://svsembedded.com/ieee_2022.php135 Projects https://svsembedded.com/ieee_2021.php 151 Projects https://svsembedded.com/ieee_2020.php103 Projects https://svsembedded.com/ieee_2019.php61 Projects https://svsembedded.com/ieee_2018.php171 Projects https://svsembedded.com/ieee_2017.php170 Projects https://svsembedded.com/ieee_2016.php67 Projects https://svsembedded.com/ieee_2015.php55 Projects https://svsembedded.com/ieee_2014.php43 Projects https://svsembedded.com/ieee_2013.php1100 Projects https://www.svskit.com/2022/02/900-pr...***********************************************************Creating an IoT-based Smart Agriculture Monitoring System using Arduino can greatly improve the efficiency and productivity of farming. In this project, we'll use Arduino, various sensors, and an IoT platform like ThingSpeak or Adafruit IO to collect data and monitor the agricultural environment remotely. Here's a step-by-step guide to help you get started:Components Needed:1. Arduino (e.g., Arduino Uno or Arduino Mega)2. Sensors:• Soil Moisture Sensor• DHT22 or DHT11 Temperature and Humidity Sensor• Light Sensor (LDR)• Rainfall Sensor (optional)3. ESP8266 Wi-Fi module or ESP32 (for IoT connectivity)4. Relay module (for controlling irrigation systems)5. Power supply (solar or standard power source)6. Water pumps, valves, or actuators (for automated irrigation)7. Enclosure for outdoor installation (to protect electronics)8. Jumper wires, breadboard, and connectors9. Internet connectionProject Steps:1. Hardware Setup:• Connect the sensors and actuators to the Arduino using jumper wires.• Connect the ESP8266 or ESP32 to the Arduino using serial communication or I2C for data transfer.• Make sure all connections are secure and powered properly.2. Sensor Data Collection:• Read data from the soil moisture sensor to monitor soil moisture levels.• Use the DHT22/DHT11 sensor to measure temperature and humidity.• The light sensor can be used to monitor light intensity.• Optionally, include a rainfall sensor to measure precipitation.3. Arduino Programming:• Write Arduino code to read data from the sensors.• Implement control logic for irrigation systems based on the sensor data. For example, turn on/off water pumps or open/close valves.• Create a mechanism to send sensor data and control commands to the IoT platform via the ESP8266 or ESP32.4. IoT Integration:• Sign up for an IoT platform like ThingSpeak, Adafruit IO, or Ubidots.• Obtain the necessary credentials (API keys) to connect your Arduino to the platform.• Modify your Arduino code to send sensor data to the IoT platform periodically.• Set up dashboards and alerts on the IoT platform to visualize and analyze the data remotely.5. Remote Monitoring and Control:• Access your IoT platform's dashboard or mobile app to remotely monitor the agricultural conditions.• Implement automation rules and alerts to trigger actions (e.g., irrigation) based on specific conditions (e.g., low soil moisture).6. Power Supply:• Depending on your project's location, consider using solar power or a reliable power source to ensure continuous operation.
#youtube#IOT Based Smart Agriculture Monitoring Pump ON/OFF Control Using Arduino With Manual / Automatic https://www.youtube.com/watch?v=F3E0MiYCWpw
0 notes
Text
Noah's Ark on Broadway


LISTEN NOW (8 minutes):
Listen Now as Francis Douglas tells of when Noah's Ark was featured on New York City's Broadway stage.
PODCAST TRANSCRIPT:
Today on Celebrate the Bible:
NOAH’S ARK on BROADWAY in 1896
You are not likely to find anything about Noah's Ark on New York City's famous Broadway today … but, at one time, it was the "toast of the town".
Noah's Ark, and the great world-wide flood as recorded in Genesis, is perhaps one of the most easily identifiable events in all of the Bible. The most interesting aspect of this episode is not the illusion itself, but the fact that it attracted so many people from New York City's secular population: from every-day working families, to the City's upper crust … all were thrilled with the experience.

A few points of note:
Technical details of the illusion were featured in Scientific American magazine
The Olympia was the premiere entertainment showplace of the world
Biblical themes were very popular, with all NYC audiences at the Olympia
It was founded and built by famous Oscar Hammerstein
It was reported that audiences were left spellbound after each Noah’s Ark performance
It was so popular and well-received, that the highly respected science publication, Scientific American, devoted an entire page to this Biblically-themed entertainment attraction -- complete with stunning illustrations.
Let’s take a step-by-step look at the Noah’s Ark illusion. I will inter-space the steps throughout today’s presentation.
STEP ONE

Hammerstein's Olympia Theater and Music Hall was once celebrated as the foremost entertainment venue in the entire world.
Located at 44th and Broadway in New York City, it was only two blocks from what is known today as Times Square. The main theater held 2,800-seats. And the building took up an entire city block.
STEP TWO

The rooftop was just as famous as the theater and music hall. It had a 65-foot tall glass roof, and was illuminated with over 3,000 light bulbs. To provide electricity, there were four dynamos that generated 3,200 amps of power. These dynamos also powered a complete air circulation system, and pump, that brought refrigerated water from the basement to the rooftop area -- providing what was a very early version of air conditioning ... in 1896!

Not to be outdone by any other venue, the rooftop also had trees, rocks, and even a stream that eventually led to a 40-foot lake. There were swans, ducks, and even South American monkeys.
And, while you were enjoying all of this, you could walk around the perimeter of the roof, and take in views of Central Park and neighboring New Jersey.
At the time, the cost of admission for everything, including entertainment, was only 50-cents! However, keep in mind, with the rate of inflation from 1896 to 2025, that same fifty cent admission price would be equivalent to roughly $15 to $20 today.
STEP FOUR

The Scientific American publication was founded by inventor and publisher Rufus Porter in 1845. Contributors of note include Thomas Edison, Robert Goddard, Jonas Salk, Albert Einstein, and Linus Pauling -- just to name a few.
STEP FIVE: The SOLUTION

The answer to the filling of the Ark with water is a simple one … the water funnel on the top of the Ark is attached to a hose that runs down through the support beams, then empties under the stage. The water never fills the Ark in the first place.
Other than taking creative license with a few details (for instance, the real ark was never filled with water), it was a wonderful opportunity for audience members to experience one of the great Biblical events on the grand Broadway stage.
Perhaps one day we'll see a revival of the Noah's Ark Illusion, or a variation on the theme. In the meantime, I'm glad to have been able to bring it to you with this Celebrate the Bible 250 podcast.
So, until we meet again, and for celebratethebible250, this is Francis Douglas.
If you would like me to give a presentation and small exhibit to your church group, school, or organization, on the History of the Christian Holy Bible in America, I’ll place contact information below as the 2026 Semiquincentennial America 250 year approaches.
I will be available for Southern New Jersey, Southeastern Pennsylvania, and Northern Delaware.
Source: Noah's Ark on Broadway
0 notes
Text
0 notes
Photo

This is ULN2003 Driver Module Stepper Motor Driver, small size and easy to use. It uses the ULN2003 driver chip to amplify the control signal from the Arduino. This Ultra Lightweight and cheap option commonly used to run and control the small applications stepper motors. http://siliconfo.com/product/stepper-motor-driver-module-uln2003-driver/
0 notes
Photo

The Arduino Mega 2560 is a microcontroller board based on the ATmega2560. It has 54 digital input/output pins (of which 15 can be used as PWM outputs), 16 analog inputs, 4 UARTs (hardware serial ports), a 16 MHz crystal oscillator, a USB connection, a power jack, an ICSP header, and a reset button.
0 notes
Link
8051 Development Board integrates on board two UARTs, LEDs, keypads, an ADC input and LCD. With this board you can develop and prototype with any of 8051 40 pin microcontrollers.
0 notes
Link
This is a 128×64 liquid crystal display that support all characters graphics, very suitable for all microcontrollers.
0 notes
Text
Raspberry PI Tutorial #8: Daten eines DHT11 Sensors in eine MySQL Datenbank speichern

In diesem Beitrag möchte ich dir zeigen wie du die Daten eines DHT11 Sensors in einer MySQL Datenbank mit Python am Raspberry Pi speichern kannst.

Im Beitrag Python mit MySQL Datenbank verbinden habe ich dir bereits gezeigt wie man eine Verbindung zu einer MySQL Datenbank unter Python aufbauen kannst. Hier soll es nun darum gehen wie du die Daten des DHT11 Sensors in einer Tabelle speichern und abrufen kannst.
benötigte Bauteile für dieses Projekt
Für dieses Projekt benötigst du: - einen Raspberry Pi,- ein USB Stromadapter, (je nach Pi muss die entsprechende Stromstärke beachtet werden) - eine SD Karte (mit vorinstalliertem Raspian OS oder vergleichbar) - ein Netzwerkkabel oder WiFi Adapter - ein 170 Pin Breadboard, - einen DHT11 Sensor, - diverse Breadboardkabel
Schaltung & Aufbau
Den Aufbau der Schaltung habe ich bereits im Beitrag Raspberry PI Tutorial #4: DHT11 Sensor ansteuern (Teil1) erläutert.

Schaltung - Raspberry PI Model B mit DHT11 Sensor Es gibt den DHT11 Sensor als einzelnen Baustein oder aber auch bequem auf einer Platine, somit erspart man sich einen "komplizierten" Aufbau auf einem Breadboard.

Varianten des DHT11 Sensors
MySQL Datenbank vorbereiten
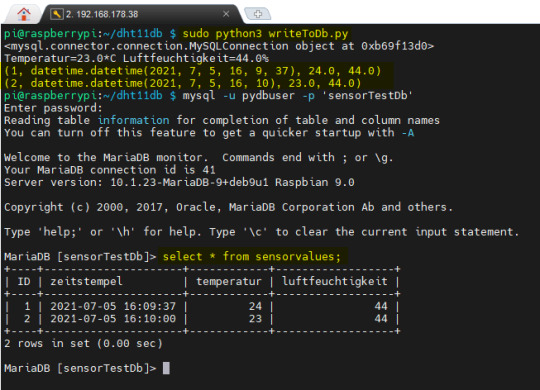
Bevor wir Daten in eine MySQL Datenbank speichern können, müssen wir diese zuvor erstellen und min. eine Tabelle erzeugen. SQL Statements Hier nun die SQL Statements zum - erstellen der Datenbank, - erstellen eines Benutzers für die DB, - zuweisen der Privilegien des Benutzers zur DB, - erstellen der Tabelle, - einfügen von Daten, und - abfragen der Daten erstellen der Datenbank Als erstes benötigen wir eine Datenbank diese erstellen wir mit dem Befehl "CREATE DATABASE". create database sensorTestDb; erstellen eines Benutzers für die DB Damit wir auf der Datenbank arbeiten können, benötigen wir einen Benutzer. Die Benutzer sind in MySQL Global d.h. ein Benutzer kann für mehrere Datenbanken berechtigt werden (dazu im nächsten Abschnitt mehr). INSERT INTO mysql.user (User,Host,authentication_string,ssl_cipher,x509_issuer,x509_subject) VALUES('pydbuser','localhost',PASSWORD('pydbpw'),'','',''); zuweisen der Privilegien des Benutzers zur Datenbank Wenn der Benutzer & die Datenbank angelegt wurde, muss nun der Benutzer für die Datenbank berechtigt werden. In meinem Fall gebe ich dem Benutzer "pydbuser" alle Rechte auf der Datenbank. GRANT ALL PRIVILEGES ON sensorTestDb.* to pydbuser@localhost; Nachdem das obrige Statement ausgeführt wurde, muss nur noch die privilegien geschrieben und dem Server mitgeteilt werden das dieser die Tabellen mit den Rechten neu einließt. FLUSH PRIVILEGES; erstellen der Tabelle Zunächst erstellen wir eine Tabelle mit vier Spalten - ID - ganzahlig, aufsteigend - zeitstempel - DateTime - temperatur - Float - Gleitkommazahl - luftfeuchtigkeit - Float - Gleitkommazahl CREATE TABLE `sensorTestDb`.`sensorvalues` (`ID` INT NOT NULL AUTO_INCREMENT, `zeitstempel` DATETIME NOT NULL, `temperatur` FLOAT NOT NULL, `luftfeuchtigkeit` FLOAT NOT NULL, PRIMARY KEY (`ID`)) ENGINE = InnoDB; einfügen von Daten Das einfügen von Daten in eine SQL Tabelle erfolgt mit dem "INSERT INTO" Befehl. Hier nun ein Beispiel wie der Befehl in unserem Fall aussieht: INSERT INTO `sensorvalues` (`ID`, `zeitstempel`, `temperatur`, `luftfeuchtigkeit`) VALUES (NULL, CURRENT_TIME(), 23.56, 57.6); Wichtig ist dass, die Gleitkommazahlen mit einem Punkt getrennt sind. Sollte als Trenner ein Komma (deutsches Format) gewählt werden, so wird die Nachkommastelle entfernt. abfragen der Daten aus der Tabelle Mit dem SQL Befehl "BETWEEN" können wir Werte aus der Tabelle lesen welche zwischen zwei Datumsbereichen liegen. Dabei ist das Datumsformat YYYY-MM-TT HH:mm:SS. SELECT * FROM `sensorvalues` WHERE zeitstempel between '2021-01-01 00:00:00' and '2021-12-31 23:59:59'
Python-Skript erstellen
Das passende Python-Skript erstelle ich in zwei Schritte - installieren des MySQL Connectors für Python, - aufbauen der Datenbankverbindung, - Abfragen der Sensordaten, - einfügen der Sensordaten in die Tabelle Dieses Python-Skript wird im Anschluss per CronJob Zeitgesteuert am Raspberry Pi gestartet. installieren des MySQL Connectors für Python Bevor wir mit dem Skripten beginnen können, müssen wir den passenden MySQL-Connector installieren. sudo pip install mysql-connector-python Auf meinem betagten Raspberry Pi dauert diese Installation etwas und kommt zwischendurch auch etwas ins Stocken. Hier muss man etwas warten und nicht gleich diverse Tastenkombinationen betätigen. pi@raspberrypi:~/dht11db $ sudo pip install mysql-connector-python Looking in indexes: https://pypi.org/simple, https://www.piwheels.org/simple Collecting mysql-connector-python Downloading https://files.pythonhosted.org/packages/2a/8a/428d6be58fab7106ab1cacfde3076162cd3621ef7fc6871da54da15d857d/my sql_connector_python-8.0.25-py2.py3-none-any.whl (319kB) |████████████████████████████████| 327kB 575kB/s Collecting protobuf>=3.0.0 Downloading https://files.pythonhosted.org/packages/d5/e0/20ba06eb42155cdb4c741e5c af9946e4569e26d71165abaecada18c58603/protobuf-3.17.3-py2.py3-none-any.whl (173kB) |████████████████████████████████| 174kB 878kB/s Collecting six>=1.9 Downloading https://files.pythonhosted.org/packages/d9/5a/e7c31adbe875f2abbb91bd84 cf2dc52d792b5a01506781dbcf25c91daf11/six-1.16.0-py2.py3-none-any.whl Installing collected packages: six, protobuf, mysql-connector-python Successfully installed mysql-connector-python-8.0.25 protobuf-3.17.3 six-1.16.0 WARNING: You are using pip version 19.3; however, version 21.1.3 is available. You should consider upgrading via the 'pip install --upgrade pip' command. pi@raspberrypi:~/dht11db $ aufbauen der Datenbankverbindung Zunächst müssen wir die Datenbankverbindung aufbauen. Dazu benötigen wir: - Servername, - Benutzername, - Passwort, - Datenbankname import mysql.connector #Aufbau einer Verbindung db = mysql.connector.connect( host="localhost", # Servername user="pydbuser", # Benutzername password="pydbpw", # Passwort database="sensorTestDb" ) # Ausgabe des Hashwertes des initialisierten Objektes print(db) sqlStmt = "SHOW TABLES;" cursor = db.cursor() cursor.execute(sqlStmt) for table in cursor: print(table) Die Ausgabe auf der Bash sieht in diesem Fall wie folgt aus: pi@raspberrypi:~/dht11db $ sudo python3 writeToDb.py ('sensorvalues',) pi@raspberrypi:~/dht11db $ Abfragen der Daten des DHT11 Sensors Wie bereits erwähnt habe ich den DHT11 Sensor am Raspberry PI schon ein paar Beiträge auf meinem Blog gewidmet. Ich möchte hier nur darauf eingehen wie du diese Werte in eine Datenbank speichern kannst und somit möchte ich dir im nachfolgenden lediglich das kleine Skript zeigen, welches die Daten des DHT11 Sensors mit der Adafruit Bibliothek ausliest. import Adafruit_DHT #Adafruit Bibliothek für den Zugriff auf den DHT Sensor #Instanz eines DHT11 Sensor erstellen #für einen # DHT22 Sensor bitte Adafruit_DHT.DHT22 # AM2302 Sensor bitte Adafruit_DHT.AM2302 #verwenden sensor = Adafruit_DHT.DHT11 #Der Sensor ist am GPIO Pin 4 angeschlossen pin = 4 #Variablen deklarieren und gleichzeitig die Werte vom Sensor empfangen. humidity, temperature = Adafruit_DHT.read_retry(sensor, pin) #Wenn die Werte erfolgreich gelesen werden konnten dann... if humidity is not None and temperature is not None: #formatierte Ausgabe der Werte auf der Kommandozeile print('Temperatur={0:0.1f}*C Luftfeuchtigkeit={1:0.1f}%'.format(temperature, humidity)) else: #ansonsten #Ausgabe einer Fehlermeldung auf der Kommandozeile print('Fehler beim empfangen der Daten. Bitte versuche es erneut!') Speichern der Daten in die MySQL Datenbank Die bereits abgefragten Daten des DHT11 Sensors, möchten wir nun in die Tabelle "sensorvalues" der Datenbank "sensorTestDb" speichern. import mysql.connector #Connector für den Aufbau der Datenbankverbindung import Adafruit_DHT #Adafruit Bibliothek für den Zugriff auf den DHT Sensor #Aufbau einer Verbindung db = mysql.connector.connect( host="localhost", # Servername user="pydbuser", # Benutzername password="pydbpw", # Passwort database="sensorTestDb" ) # Ausgabe des Hashwertes des initialisierten Objektes print(db) sensor = Adafruit_DHT.DHT11 #Der Sensor ist am GPIO Pin 4 angeschlossen pin = 4 #Variablen deklarieren und gleichzeitig die Werte vom Sensor empfangen. humidity, temperature = Adafruit_DHT.read_retry(sensor, pin) #Wenn die Werte erfolgreich gelesen werden konnten dann... if humidity is not None and temperature is not None: #formatierte Ausgabe der Werte auf der Kommandozeile print('Temperatur={0:0.1f}*C Luftfeuchtigkeit={1:0.1f}%'.format(temperature, humidity)) sqlStatement = "INSERT INTO `sensorvalues` (`ID`, `zeitstempel`, `temperatur`, `luftfeuchtigkei$ cursor = db.cursor() # einen Cursor von der Datenbankconnection holen # ausführen des SQL Statements, es werden an den Platzhaltern "temp" & "hum" die jeweiligen Sensorwerte # formatiert und eingesetzt cursor.execute(sqlStatement.format(temp = temperature, hum = humidity)) # der Commit dient dazu die Daten in die Datenbank zu speichern cursor.execute("COMMIT;") else: #ansonsten #Ausgabe einer Fehlermeldung auf der Kommandozeile print('Fehler beim empfangen der Daten.')
Abfragen der Daten aus der Datenbank
Die gespeicherten Daten können wir nun mit einem weiteren kleinen Python-Skript aus der Datenbank lesen: import mysql.connector db = mysql.connector.connect( host="localhost", # Servername user="pydbuser", # Benutzername password="pydbpw", # Passwort database="sensorTestDb" ) cursor = db.cursor() cursor.execute("SELECT * FROM sensorvalues;") for row in cursor: print(row) Oder aber, man verbindet sich mit der Datenbank und führt das SELECT Statement manuell aus.
ausführen des SELECT Statements auf der Konsole
fertiges Python-Skript
import mysql.connector import Adafruit_DHT #Adafruit Bibliothek für den Zugriff auf den DHT Sensor #Aufbau einer Verbindung db = mysql.connector.connect( host="localhost", # Servername user="pydbuser", # Benutzername password="pydbpw", # Passwort database="sensorTestDb" ) # Ausgabe des Hashwertes des initialisierten Objektes print(db) sensor = Adafruit_DHT.DHT11 #Der Sensor ist am GPIO Pin 4 angeschlossen pin = 4 #Variablen deklarieren und gleichzeitig die Werte vom Sensor empfangen. humidity, temperature = Adafruit_DHT.read_retry(sensor, pin) #Wenn die Werte erfolgreich gelesen werden konnten dann... if humidity is not None and temperature is not None: #formatierte Ausgabe der Werte auf der Kommandozeile print('Temperatur={0:0.1f}*C Luftfeuchtigkeit={1:0.1f}%'.format(temperature, humidity)) sqlStatement = "INSERT INTO `sensorvalues` (`ID`, `zeitstempel`, `temperatur`, `luftfeuchtigkeit`) VALUES (NULL, CURRENT_TIME(), {temp:000.2f}, {hum:000.2f});" cursor = db.cursor() cursor.execute(sqlStatement.format(temp = temperature, hum = humidity)) cursor.execute("COMMIT;") else: #ansonsten #Ausgabe einer Fehlermeldung auf der Kommandozeile print('Fehler beim empfangen der Daten.') cursor = db.cursor() cursor.execute("SELECT * FROM sensorvalues;") for row in cursor: print(row) Hier nun der Download des Python-Skriptes zum bequemen download :
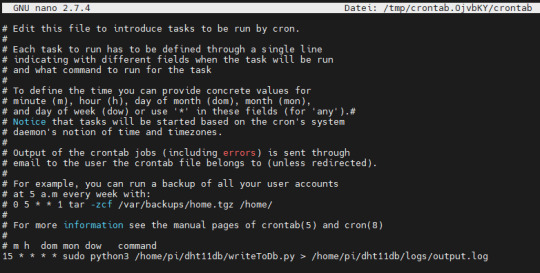
CronJob zum zeitgesteuerten Starten des Skriptes
Der Vorteil eines CronJobs ist dass, das Skript vom Betriebssystem gesteuert und gestartet wird. Vor allem, wenn einmal der Pi Hard- / Softreset erfährt, muss man das gewollte Skript nicht erneut starten, sondern das System übernimmt dieses für einen. Die Syntax für einen CronJob ist für ungeübte recht schwierig zu lesen bzw. zu erstellen, aber auch hier gibt es einige gute Seiten, welche einen Generator erstellt haben und somit zumindest diese Arbeit etwas leichter wird. In meinem Fall möchte ich alle 15 min. einen neuen Wert einlesen und abspeichern, somit ist der Befehl wie folgt: 15 * * * * sudo python3 /home/pi/dht11db/writeToDb.py > /home/pi/dht11db/logs/output.log Die Ausgabe des Skriptes wird nach "/home/pi/dht11db/logs/output.log" geschrieben, d.h. die Ausgabe mit dem Befehl "print" aus dem Skript werden in diese Datei geschrieben, des Weiteren werden auch eventuelle Exceptions / Ausnahmen in diese Datei geschrieben. Den CronJob legen wir mit dem Befehl "crontab -e" an.
CronTab im Editor - Nano Die Ausgabe erfolgt wie bereits erwähnt in die Datei "output.log", welche die eingefügten Zeilen enthält.
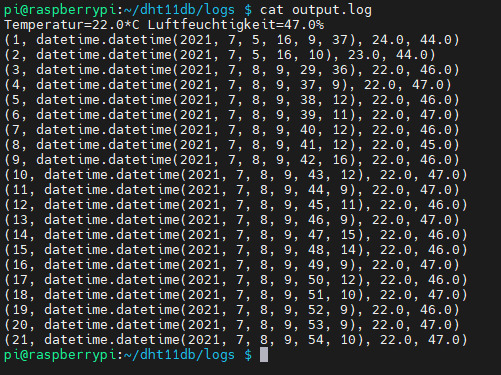
Ausgabe der Einträge des Logfiles Read the full article
0 notes
Text
This thermochromic 7-segment display colorfully shows the temp and humidity

Instead of controlling his temperature and humidity display directly, maker Zaphunk did things a bit differently, driving the temperature of each segment with a Peltier element, or thermo-electric cooler (TEC), to change its color.
Each segment is made out of a thermochromic material, cycling from a black off state to a greenish hue when on, for a device that can—somewhat ironically—show the temperature by changing its temperature.

Ambient conditions are read via a DHT22 sensor, and everything is controlled by a half-dozen Arduino Nanos. This number boards were needed in order to power the nine dual motor drivers that handle the Peltier elements, each of which require two PWM outputs, along with 5 IO pins.
The display looks great in the video below and Arduino code is found on GitHub.
youtube
This thermochromic 7-segment display colorfully shows the temp and humidity was originally published on PlanetArduino
0 notes
Photo

Onion Omega 2 – Prosta stacja pogodowa [KONKURS]
Na początku września miałem okazję testować płytkę Onion Omega 2 Plus wraz z Power Deckiem. Pierwsze wrażenia i opis zestawu znajdziecie we wpisie Onion Omega 2. Dzięki uprzejmości sklepu Botland.com.pl, miałem przyjemność przez dłuższy czas używać Cebuli i dziś będę miał dla Was mały konkurs, w którym do wygrania będzie wspomniany zestaw z Onion Omega 2+ oraz Power Dockiem.
Zanim przejdziemy do konkursu chciałbym jeszcze opisać w jaki sposób przy użyciu Cebuli zrobić prostą stację pogodową podającą informacje na temat temperatury i wilgotności powietrza. W tym celu poza Onion Omega 2+ użyłem jeszcze DTH22, do dokonywania tych pomiarów. Całość podłączyłem do Power Docka. Sposób podłączenia DHT22 jest identyczny jak w przypadku DHT11. Schemat podłączenia znajdziecie w tym wpisie.
Po podłączeniu i wstępnej konfiguracji Cebuli, możemy przejść do Terminalu i połączyć się przez SSH z Cebulą(login/hasło: root/onioneer). Gdy to zrobimy, możemy przejść do pobrania programu do odczytu temperatury i wilgotności powietrza.
opkg update
opkg install wget - instalujemy wget’a
cd /root
wget https://community.onion.io/uploads/files/1450434316215-checkhumidity.tar.gz - pobieramy program do odczytu danych z miernika
tar -zxvf 1450434316215-checkhumidity.tar.gz
chmod -R 755 /root/checkHumidity/bin/checkHumidity - zmieniamy uprawnienia programu do odczytu danych
cd /root/checkHumidity/bin/
./checkHumidity 20 DHT22 - liczba 20 oznacza tutaj pin GPIO Cebuli, do którego podłączyliśmy miernik. DHT22 to model miernika. Możemy użyć DHT11, wtedy w tym miejscy wpisujemy DHT11. Jeśli otrzymujemy wartość 255, oznacza to, że mamy źle podłączone DHT22.
Dane z czujnika możemy szybko wyświetlić na stronie internetowej. W tym celu wystarczy przejść do folderu /www/php (cd /www/php)i stworzyć w nim plik dht.php(nano dht.php). Następnie wkleić do niego poniższy kod:
The current temperature is " . $temp . "°C and the humidity is . " . $humidity . "%" ; } else { echo "Error: " . $message; } function get_dht_values($pin, $dht_type) { if( ( $dht_type != "DHT11" ) && ( $dht_type != "DHT11" ) ) { return array("Invalid DHT Type", 0, 0); } // Run the command using the exec() function, delivers the output in $output exec("/root/checkHumidity/bin/checkHumidity $pin $dht_type 2>&1", $output, $return); // -255 = bad if( $output[0] == "-255.000000" ) { return array("Unable to read sensor, check the wiring, pin number!", 0, 0); } // must be all good, lets return the data $output[0] = number_format( (float)$output[0], 2, '.', '' ); // temp $output[1] = number_format( (float)$output[1], 2, '.', '' ); // hum return array( "success", $output[0], $output[1] ); }
Teraz pod adresem http://omega-ABCD.local/php/dht.php(IP_Cebuli/php/dht.php) powinniśmy znaleźć dane na temat wilgotności i temperatury powietrza.
KONKURS
Jak już wspomniałem na początku wpisu. Mam do rozdania zestaw składający się z płytki Onion Omega 2 Plus i Power Deck. Zestaw ten został ufundowany przez sklep Botland.com.pl.
Aby wziąć udział w konkursie napiszcie co zrobilibyście z Onion Omega 2+. Jakich innych płytek rozszerzeń dla Cebuli użylibyście(możecie je znaleźć tutaj). Konkurs trwa do piątku włącznie. Komentarze z opisami zostawcie pod tym wpisem. Powodzenia!
Jeśli chcesz podyskutować lub wymienić się swoimi spostrzeżeniami i opiniami o Raspberry Pi, albo po prostu szukasz inspiracji w jaki sposób wykorzystać swoją Malinkę, zapraszamy do naszej grupy na FB! - facebook.com/groups/malinowepi i do polubienia naszego profilu na Facebooku - facebook.com/malinowepi oraz zapisania się na Malinowy Newsletter.
1 note
·
View note
Text
Progress 1# ~ RH and Temp Module
Proposal for reference
So my approach to this Something Awesome Project is to build each circuit of the modules first and test them as individual units before integrating them into the Central Control system. I’ve started with the simplest module which i believe is the Relative Humidity and Temperature Control Module.
1. Understanding the temperature and RH of my bathroom
I put a barometer in my bathroom as a control to understand what temperature and RH is reached after a shower. I’ve noticed that the normal RH is around 62% but after a shower it reaches over 84%. If I open the door after the shower a fraction with the fan on, it takes around 15 mins to dissipate the steam but with the door completely open, it takes the steam around 8 mins to dissipate. Therefore, this module will turn on the fan when the RH reaches over 80% and will switch off at 62%.
2. Research
I used this site to base off my research which recommended a DHT11 sensor. However CREATE only sold DHT22, which was easy to adapt. It proved to be even better for me because it had its own built in resistor.
3. The Build and Sketch
This is a schematic of my build:
This is as photo of my build:

This is my own Arduino Sketch: here
4. Testing
I used the Serial Monitor to output the temperature and RH readings. When I blew on it, it successfully rose as expected and dropped after a few minutes.
I also used the BUILTIN_LED, which is pin13 on the Arduino to turn on when the RH was higher than a certain amount (80% for testing purposes only). This also worked as well which I’m really happy about.
0 notes
Text
ESP32 Espruino DHT22 Tutorial: Getting temperature and humidity
Introduction
In this esp32 tutorial we will check how to get temperature and humidity measurements from a DHT22 sensor using Espruino, running on the ESP32.
To use a simple interface that abstracts from us the complexity of interacting with the DHT22 using the single wire protocol it supports, we will use Espruino’s DHT22 module.
Important: The DHT library doesn’t work in some older Espruino firmware versions. My recommendation is to update to the latest version available on the Espruino download page. For these tests I’m using version 1.99.
To facilitate the interaction with the sensor, I’m using a DFRobot DHT22 module which already has all the electronics needed and exposes a wiring terminal that facilitates the connections.
The tests were performed using a DFRobot’s ESP32 module integrated in a ESP32 development board.
The electric diagram
As stated in the introductory section, I’m assuming the use of a ready to use DHT22 sensor module, which contains all the electronics needed for everything to work. Thus, when using such a module, we can simply connect its data pin directly to a GPIO of the ESP32, as illustrated in figure 1.

Figure 1 – Connection diagram between the ESP32 and the DHT22 module.
Depending on your module, the labels may be different or it may not be labeled at all. In my case, for the module I’m using, there are no labels on the board and we need to take in consideration the colors of the wires connected to it:
Black: GND
Red: VCC
Green: Data
Depending on your ESP32 board, it may be able to provide the power needed for the DHT22 to work from a power pin. If you are not sure if your board has one, my recommendation is to use an external power supply such as this.
The code
As usual, the code needed to get the measurements is very simple and compact, due to the fact that we are using a higher level framework.
We will start by declaring the number of the ESP32 GPIO that is connected to the DHT22 module. I’ve used pin 25 but you can test with others.
var dhtPin =25;
In order to avoid having to worry about the lower level details of the communication protocol between the microcontroller and the ESP32, we will use an Espruino module that will handle that interaction for us.
To load a module, we simple use the require function, passing as input the name of the module [1]. When we use the require function, upon sending the code to the board, the Espruino IDE will automatically look online for the module, download it and load it into the board [1].
After loading the module, we can simply call the connect method on the returned object, passing as input the number of the ESP32 pin connected to the sensor [2]. This will return a DHT22 object from which we can get the measurements [2].
var dht = require("DHT22").connect(dhtPin);
To get the actual measurements, we simply need to call the read method of the DHT22 object [2].
This method receives as single input a function that is executed when the read operation is complete. As argument of this user defined function, the read method will pass an object that contains both the temperature and humidity measurements [2].
The temperature can be obtained from the temp property of the mentioned object, and the humidity from its rh property. We can then print the values of those properties inside the function we will pass to the read method.
dht.read(function (measurements) { console.log("Humidity: " + measurements.rh + "%"); console.log("Temperature: " + measurements.temp + "ºC"); });
The final complete code can be seen below.
var dhtPin =25; var dht = require("DHT22").connect(dhtPin); dht.read(function (measurements) { console.log("Humidity: " + measurements.rh + "%"); console.log("Temperature: " + measurements.temp + "ºC"); });
Testing the code
To test the previous code, simply upload the previous script to your ESP32 board, using the Espruino IDE. As already mentioned, it will be during the loading procedure that the DHT22 module will be loaded, so it may take a while before the code starts executing.
After the execution finishes, you should get an output similar to figure 2, which shows the two measurements being printed.

Figure 2 – Obtaining temperature and humidity with Espruino and a DHT22 sensor.
0 notes
Text
Week 3: Input/Output - Temp & Humidity Sensor Module
This week I familiarized myself with basic digital vs analog input/output applications. I randomly inherited a DHT11 sensor from my dad so I decided to give that a shot. The thumbnail size sensor says it has a temp range from 0 to 50 C and a humidity range from 20 to 95%. It takes in 3.5 to 5 volts and a 10k resistor that sits between the data stream and power supply. I dug around online, read forums and blogs and found a DHT library on the Arduino site as well as some basic test code. I had to make some minor adjustments to the code to get the DHT11 version to work and after a few hours of errors and tweaks I got the code to compile and uploaded to the Arduino. Although I was able to get the serial monitor to output data, as of now I’m getting a “Time Out Error” so I’m not getting the proper feedback. I poked around online and found some other DHT users getting the same error. Per the posts after upgraded to the DHT22 sensor they were able to get the proper feedback. Work in progress!
UPDATE!! Turns out I just had the goddamn sensor in the wrong way, worked after I flipped it around (thank you Prof. Woo!).
Working shot output shot from serial monitor. #hotinhere


0 notes
Link
The Arduino Mega 2560 is a microcontroller board based on the ATmega2560. It has 54 digital input/output pins (of which 15 can be used as PWM outputs), 16 analog inputs, 4 UARTs (hardware serial ports), a 16 MHz crystal oscillator, a USB connection, a power jack, an ICSP header, and a reset button.
0 notes
Text
ESP8266 DIY IoT Wetterstation mit OLED Display und DHT11 Sensor

In diesem Beitrag möchte ich dir die DIY IoT Wetterstation mit dem Microcontroller ESP8266, einem OLED Display sowie dem DHT11 Sensor vorstellen.

DIY IoT ESP8266 Wetterstation
Bezug
Diese kleine Wetterstation mit dem ESP8266 Microcontroller habe ich über aliexpress.com für ca. 7€ inkl. 4€ Versandkosten erstanden. Auf ebay.de erhälst du diesen Bausatz für ca. 17€ inkl. Versandkosten. Da beide Produkte aus dem asiatischen Raum geliefert werden, denke ich das die Lieferzeit ziemlich ähnlich sein werden und somit empfehle ich das deutlich günstigere Produkt von aliexpress.com. Lieferumfang Zum Lieferumfang gehört: ein 30cm langes USB Kabel (USB Typ A Stecker auf Micro USB Buchse), eine Hauptplatine mit dem ESP8266 Chip, ein 0,96" OLED Display, ein DHT11 Sensor, sowie 3 Breadboardkabel, 20cm, Buchse - Buchse (zum alternativen Anschluß des DHT11 Sensors) Geliefert wurde das Display sowie der Sensor in jeweils kleine, antistatische Tüten.

Lieferumfang, DIY IoT Wetterstation Die Hauptplatine wurde zusammen mit dem USB Kabel in einer kleinen Plastikbox geliefert, welche jedoch so groß ist dass, das Display und der Sensor einen Platz darin finden. Leider kann diese Box aber nicht als Gehäuse für diesen Bausatz verwendet werden da der DHT11 Sensor knapp 2cm zu hoch absteht.

Aufbewahrungsbox für die Bauteile zur DIY IoT Wetterstation
Zusammenbau der Komponenten
Dieser kleine und vor allem sehr übersichtliche Bausatz (3 Bauteile) wird über Stiftleisten und Buchsen zusammengesteckt. Der DHT11 Sensor ist dabei fertig aufgebaut und wird in die 3 Polige Buchse oben rechts gesteckt. Es ist dabei auf die korrekte Polung zu achten. An das Display muss die vierpolige Stiftleiste angelötet werden, ich stecke dazu diese Stiftleiste auf ein Breadboard und fixiere das Display mit UHU patterfix.

"Board:" > "Boardverwalter...") öffnet kann man den Treiber unter der Eingabe der Zeichenkette "esp8266" installieren.

Boardverwalter - ESP8266 Treiber In meinem Fall ist dieser bereits installiert. benötigte Bibliotheken Für die Programmierung des Sketches / Programmes benötigen wir 3 Bibliotheken, zwei für das Display und eine für den DHT11 Sensor. Für das OLED Display verwende ich die Adafruit GFX und Adafruit SSD1306 Bibliothek. Beide Bibliotheken findest du im Bibliotheksverwalter der Arduino IDE. Den Boardverwalter öffnest du in dem du über das Hauptmenü "Sketch" > "Bibliothek einbinden..." > "Bibliotheken verwalten..." navigierst. Dort gibst du nun die Zeichenkette "gfx" ein und suchst nach dem Eintrag "Adafruit GFX Library" und installierst diese über die Schaltfläche "Installieren". Das gleiche machst du ebenfalls mit der Bibliothek "ssd1306" (der Eintrag lautet "Adafruit SSD1306"). Wenn beide Bibliotheken installiert sind wird als letztes die Bibliothek für den DHT11 Sensor installiert. Hier gibt es diverse Bibliotheken ich verwende die "DHT sensor library" von Adafruit. Es ist nach der Installation kein neustarten der Arduino IDE notwendig, die Treiber und Bibliotheken sind sofort Einsatzbereit. Ausgabe der Sensordaten auf dem Display //Bibliothek für die Kommunikation über I2C #include //Bibliothek für den Sensor DHT11 #include "DHT.h" //Bibliotheken zum betreiben des Displays #include #include //Der DHT11 Sensor ist am Board über den //digitalen Pin D5 angeschlossen #define DHTPIN 5 //Der Sensor ist vom Typ DHT11 //Theoretisch könnte man den DHT11 auch gegen einen //DHT22 oder ASM2320 austauschen, diese Sensoren sind //baugleich #define DHTTYPE DHT11 //erstellen einer Instanz des Sensor Objektes DHT dht(DHTPIN, DHTTYPE); //default Rest des Displays #define OLED_RESET 4 //eine neue instanz für das Display erzeugen Adafruit_SSD1306 display(OLED_RESET); void setup() { //beginn der seriellen Kommunikation mit 9600 baud //eventuelle Fehler (zbsp. beim lesen der Werte des DHT11 Sensors) //werden auf der seriellen Schnittstelle ausgegeben Serial.begin(9600); //beginn der Kommunikation mit dem DHT11 Sensor dht.begin(); //setzen der I2C Pins auf digital D2 und digital D14 Wire.begin(2,14); //beginn der Kommunikation mit dem Display //das OLED Display verfügt über die Adresse 0x3C display.begin(SSD1306_SWITCHCAPVCC, 0x3C); //setzen der Textgröße auf den kleinsten Wert von 1 display.setTextSize(1); //setzen der Schriftfarbe "weiß" display.setTextColor(WHITE); } void loop() { //eine Pause von 2 Sekunden delay(2000); //lesen der rel. Luftfeuchtigkeit float h = dht.readHumidity(); //lesen der Temperatur in Grad Celsius //mit der übergabe des Parameters "false" in der Funktion //readTemperature(), wird der Wert in Grad Fahrenheit geliefert float t = dht.readTemperature(); //prüfen ob Zahlenwerte geliefert wurden //Wenn der Sensor nicht gefunden wurde, dann enthalten die flaot Variablen "NaN" if (isnan(h) || isnan(t)) { Serial.println(F("Fehler beim lesen der Sensorwerte!")); return; } //löschen des Displays display.clearDisplay(); //setzen des Cursors an die Position Spalte = 0, Zeile = 0 display.setCursor(0, 0); //schreiben der Temperatur, //der Wert der Variable t wird dabei in ein String umgewandelt und //auf zwei Stellen nach dem Komma gekürzt. display.println("Temp.: " + String(t,2)+"C"); //setzen des Cursors an die Position Spalte = 0 , Zeile = 15 display.setCursor(0, 15); //schreiben der rel. Luftfeuchtigkeit //der Wert der Variabel h wird dabei in ein String umgewandelt und //auf zwei Stellen nach dem Komma gekürzt. display.println("Humidity: "+String(h,2)+"%"); //aktualisieren des Displays display.display(); } Read the full article
0 notes
Text
Weather Station: DHT11 Temperature and Humidity Sensor Arduino 2.4″ TFT LCD Touch Shield - SPFD5408
youtube
Arduino 2.4″ TFT LCD Touch Screen - DHT11 Temperature and Humidity Sensor - Weather Station | Weather Station: DHT11 Temperature and Humidity Sensor Arduino 2.4″ TFT LCD Touch Shield Display | arduino tft lcd touch screen - dht11 temperature and humidity sensor - Weather Station. ****************************************************************** GET Complete HardWare kit - If You Want To Purchase the Full Project Mail Us: [email protected] Title Name Along With You-Tube Video Link Project Changes also Made according to Student Requirements http://svsembedded.com/ è https://www.svskits.in/ M1: +91 9491535690 è M2: +91 7842358459 ****************************************************************** 1. DHT11 Temperature & Humidity sensor with Arduino – Tutorial, 2. How to Set Up the DHT11 Humidity and Temperature Sensor on an Arduino, 3. Blynk ESP8266 DHT11 Temperature Sensor, 4. DHT11 & DHT22 Sensors Temperature and Humidity Tutorial using Arduino, 5. Arduino Project: Temperature and Humidity monitor Tutorial with DHT11 (or DHT22) sensor LCD shield, 6. How to Set Up the DHT11 Humidity Sensor on the Raspberry Pi, 7. Using a DHT11 and ATtiny to control humidity moisture and temperature - Anything Arduino ep 4, 8. How To Receive Multiple Sensor Readings From Your ARDUINO Into Your MIT APP INVENTOR 2 APP, 9. How To Connect DHT11 (or DHT22) Humidity & Temperature Sensor [Arduino Tutorial], 10. Temperature & Humidity Sensor DHT11 –Tutorial, 11. Tasmota + D1mini (or Sonoff) - Temp & Humidity, ws2812 LEDs, and Motion Detection, 12. Arduino Time, Date, Temperature and Humidity, 13. ESP32 MicroPython MQTT Tutorial with Raspberry Pi, DHT-22 & OLED, 14. DHT11 Humidity Sensor on Arduino, 15. DHT11 and DHT22 Sensor Using with Arduino, 16. DHT11 (Raspberry Pi), 17. Raspberry Pi Tutorial 26 - GPIO DHT22 Digital Temperature + Humidity Sensor, 18. DHT Humidity Sensing on Raspberry Pi with GDocs Logging, 19. Beginner Arduino Project - DHT11 with LCD (I2C), 20. 5. Android Arduino DHT11, DHT22 Temperature and Humidity Sensor, 21. Sending Temperature and Humidity Data to MySQL Server(PHPMYADMIN) using Arduino, 22. ESP32 DHT11/DHT22 Asynchronous Web Server (auto updates Temperature and Humidity), 23. How to build Humidity and temperature meter using DHT11 and OLED Display, 24. How to Use ThingSpeak with Arduino, 25. Sending Temperature Sensor Data From Arduino to Excel and Plotting, 26. Arduino and DHT11, BMP180, DS18B20 Sensors, Connection, 27. Temperature and Humidity Monitoring over Internet using Arduino, 28. Measuring Temperature with Arduino - 5 Sensors, 29. How to use DHT22 Temperature and Humidity sensor with Arduino, 30. Arduino ESP8266 and DHT11 WIFI Temperature sensor controller, 31. Arduino + GSM Module SIM800L + DHT + Remote Temperature Sensor, 32. virtuino DHT sensor - read temperature and humidity using Bluetooth, 33. DHT11 Sensor with Node-RED – Temperature - Humidity to Dashboard /Gauge, 34. Temperature and Humidity Sensor DHT11 in Arduino with C., 35. NodeMcu (ESP8266) Tutorial 10: Temperature sensor DHT11, DHT 21, DHT22, 36. Upload DHT11 Temperature Humidity Values to Thingspeak using Nodemcu, 37. temperature Displayed on 4 Digit 7 segment Using Arduino nano v3 + DHT11 sensor, 38. Sending Text Message(SMS) using ESP8266-01 | DHT11 | IFTTT, 39. DIY Wireless Temp & Humidity Monitor With Text & Email Alerts, 40. Sinhala Arduino Tutorial 19 - DHT11 Temperature and Humidity Sensor, 41. Arduino + LCD TFT 2.4 + DHT11, 42. Arduino Weather Station Using BMP280-DHT11 , 43. ARDUINO - SPFD5408 TFT LCD 2.4 TEMP and HUMIDiTY, 44. DHT22 with Arduino - Humidity and Temperature Sensor with, 45. DHT11 & DHT22 Sensor Temperature and Humidity Tutorial, 46. Arduino Project - Touchscreen Temperature & Humidity , 47. arduino touch screen, 48. arduino touch screen button code, 49. 2.4'' tft Arduino, 50. arduino touch screen gui, 51. arduino capacitive touch screen, 52. dht11 sensor Arduino, 53. dht11 temperature and humidity sensor arduino code, 54. arduino touch screen button code, 55. arduino capacitive touch screen, 56. arduino touch screen gui, 57. temperature and humidity sensor – Arduino, 58. dht11 temperature and humidity sensor arduino code, 59. arduino humidity sensor project, 60. arduino dht, 61. arduino tft lcd projects, 62. Weather Station: General & Detail Screen - Arduino Project Hub, 63. 2.4 TFT Arduino Weather Station With Multiple Sensors, 64. Arduino Mega + 2.4 TFT LCD Shield + DHT11 Temperature and Humidity, 65. ARDUINO - SPFD5408 TFT LCD 2.4 TEMP and HUMIDiTY Monitor with DHT11, 66. Arduino Wireless Weather Station - Arduino Project Hub, 67. ARDUINO - SPFD5408 TFT LCD 2.4 TEMP and HUMIDiTY Monitor, 68. DHT22 with Arduino - Humidity and Temperature Sensor, 69. ARDUINO - TFT LCD , 70. 2.4 TEMP and HUMIDiTY
0 notes