#Distributed Ledger
Explore tagged Tumblr posts
Visit Tumblr Blog
Explore Tumblr blogs with no restrictions, modern design and the best experience.
Last Seen Tumblr Blogs


Fun Fact
Tumblr has 16.74 million mobile monthly users in the US.
Text
LIFECOIN: Currency as Conscience | ChatGPT4o
[Download Full Document (PDF)] This document presents LifeCoin, a transformative framework for a new kind of money aimed at aligning monetary systems with the flourishing of life. It critiques the existing financial systems that prioritize accumulation over ecological and social well-being, emphasizing that the future of money should be rooted in life-value rather than mere profit. The manifesto…
#bioregional governance#civilization redesign#coherence economy#Complementary Currencies#currency as conscience#distributed ledger#ecological restoration#economic justice#ethical AI#Job Guarantee#LCI#Life-Capacity Index#Life-Value Onto-Axiology#LifeCoin#meta-currency#MMT#Modern Monetary Theory#monetary biodiversity#participatory budgeting#planetary coherence#post-GDP metrics#Prof. Bernard Lietaer#public service tokens#regenerative currency#Regenerative economics#sacred economics#sacred finance#soul of money#systems change#value realignment
0 notes
Text
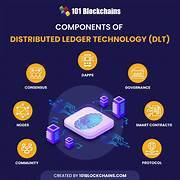
Blockchain Technology in a Nutshell
Blockchain technology is a revolutionary system that underpins cryptocurrencies like Bitcoin. It offers a decentralized, secure, and transparent way to record and transfer data, which has applications beyond digital currencies. What is Blockchain Technology? Blockchain is a distributed ledger technology that records transactions across multiple computers. These records are grouped into blocks,…

View On WordPress
#Blockchain Technology#Cryptographic Hashes#Decentralization#Distributed Ledger#Finance#Healthcare#Security#Supply Chain Management#Transparency#Voting Systems
0 notes
Text
Blockchain IoT Trends and Opportunities and Distributed Ledger Advantage
The global blockchain IoT market size is expected to reach USD 12,679.5 million by 2030. The rising adoption of decentralized applications (dApps) in the blockchain IoT industry is expected to drive market growth. By combining the advantages of blockchain and IoT, these dApps introduce innovative solutions that significantly improve security, transparency, and operational efficiency across various industries. These emerging trends are anticipated to stimulate the expansion of the market. In addition, the integration of blockchain and IoT is revolutionizing data sharing, transactional trust, and process automation, leading to the emergence of innovative business models and lucrative growth opportunities.

Blockchain IoT Market Report Highlights
The software & platform component segment accounted for the largest market share of 51.6% in 2022 owing to the increasing adoption of blockchain IoT solutions
The smart contracts application segment accounted for the largest revenue share of 30.7% in 2022
The self-execution and automation capabilities of smart contracts in the market are expected to drive the segment growth
The transportation & logistics vertical segment accounted for the largest revenue share of 21.8% in 2022 due to its properties in creating transparent and immutable records of transactions
The SMEs segment accounted for the largest revenue share of 60.2% in 2022 due to the increased implementation of the technology to help SMEs meet regulatory compliance requirements
North America accounted for the largest revenue share of 34.6% in 2022 and is anticipated to witness considerable growth over the forecast period mainly on account of the presence of key market players
Gain deeper insights on the market and receive your free copy with TOC now @: Blockchain IoT Market Report
The growing awareness about the vast potential of this technology in numerous areas, such as supply chain management, asset tracking, smart cities, healthcare, and energy management, is also expected to augment the market growth. Several companies focus on launching new products and partnering with key players to cater to the larger customer base and strengthen their foothold in the industry. For instance, in March 2022, IoTex, a modular Web3 infrastructure platform, partnered with Google Cloud, a subsidiary of Google LLC. The collaboration leads to the global expansion of MachineFi, a decentralized finance (DeFi) platform designed specifically for the IoT ecosystem. Moreover, the Google Cloud-based infrastructure will help the company to make MachineFi’s services and apps more secure, scalable, and reliable. Such partnerships by key players are expected to propel the market growth.
#Blockchain IoT#IoT Security#Distributed Ledger#IoT Blockchain Integration#Smart Devices#Connected Devices#IoT Applications#Blockchain Technology#IoT Solutions#Blockchain Innovation#IoT Data#Decentralized IoT#Blockchain Use Cases#IoT Connectivity#IoT Security Solutions#Blockchain Ecosystem#IoT Trust#Blockchain Development#IoT Privacy#IoT Adoption
0 notes
Text

#saudi arabia#petrodollar#us dollar#global economy#oil trade#currency exchange#digital currency#project mbridge#international trade#economic shift#bitcoin transactions#cross-border payments#distributed ledger technology#central banks#global finance
4 notes
·
View notes
Text
#Blockchain Distributed Ledger Market Scope#Blockchain Distributed Ledger Market Forecast#Blockchain Distributed Ledger Market Overview
0 notes
Text
BITGRIT DLT Foundation: The First Japanese-Rooted Crypto Asset Foundation in ADGM
Overview Abu Dhabi, UAE (ARAB NEWSWIRE) — bitgrit, originally founded in Japan and now registered as an entity in the Abu Dhabi Global Market (ADGM), announced the establishment of the “BITGRIT DLT Foundation.” This foundation represents the first instance of a Japanese-rooted company leveraging ADGM’s regulatory framework to create a crypto asset foundation. What is ADGM? The Abu Dhabi Global…
#Abu Dhabi#ADGM#AI#AI agents#Asset#BITGRIT DLT Foundation#crypto#crypto assets#distributed ledger technology#DLT#Japan#Kazuya Saginawa#Token Issuance#Web3
0 notes
Text

youtube
:
0 notes
Text
Blockchain: Paving the Way for a New Digital Era Insights from Recent Industry Developments

What is Blockchain?
Electronic currency is a distributed digital ledger or database that records transactions in a verifiable and permanent way. It was originally conceived for bitcoin, the first cryptocurrency, but the underlying technology can be used for much more. Electronic currency works without a central authority or single administrator - it is a peer-to-peer system that is collectively maintained by its users. Data stored on a electronic currency is nearly impossible to change, providing robustness, transparency, and security. The Beginnings of Blockchain
The first electronic currency was created in 2009 when Bitcoin's mysterious founder, known under the pseudonym Satoshi Nakamoto, published the research paper "Bitcoin: A Peer-to-Peer Electronic Cash System." This proposed a solution to the double spending problem in digital cash using a peer-to-peer network to generate computational proof of the chronological order of transactions. The resulting "blocks" form a "chain" in which each link verifies the authenticity and chronological integrity of the previous one through cryptography. How Electronic currency Works
Electronic currency technology uses a distributed ledger to record transactions across a decentralized peer-to-peer network. When a transaction occurs, it is recorded and bundled into a block along with other transactions. Blockchain block is computationally hashed and linked to the previous block, forming an immutable chain. Copies of the ledger are maintained on thousands of computers distributed around the world so there is no single point of failure. This ensures a high level of security and transparency without the need for a centralized authority. Applications of Electronic currency Technology
Electronic currency technology has tremendous potential for application across many sectors: Banking and Finance - Electronic currency could help streamline operations like stock trading, international payments, exchanges, cross-border remittances and loans. It improves transparency and accountability while reducing transaction fees and processing times. Supply Chain Management - Electronic currency allows participants across the supply chain to securely exchange information and track goods in real time. This improves visibility, traceability, quality control and reduces paperwork, human error and counterfeits. Voting - Electronic currency based voting enhances security, transparency and accuracy compared to traditional centralized systems. This addresses concerns around vote tampering, double votes and inaccurate tallies. It could also enable remote and mobile voting for those unable to physically access polling stations. Healthcare - Storing medical records, insurance records, clinical trial data and other healthcare information on electronic currency brings transparency and security while giving patients ownership and control over access to their own data. Property Records - Documents like titles, deeds, mortgages and public records like land registry could be digitized and recorded immutably on a electronic currency to streamline verification and transactions related to property ownership. Government Services - Electronic currency can improve efficiency and accountability in areas like tax collection, licensing, vehicle registration. Digital identity management through electronic currency also enables citizens to securely access online government services from anywhere. Challenges of Electronic currency Adoption
While electronic currency technology shows immense promise, there are still challenges that need to be addressed for wider adoption: Scalability - Many public electronic currencys do not yet have the capacity to handle very high transaction volumes needed for large scale commercial use. This is being worked on actively through various solutions. Regulatory Uncertainty - Regulations around electronic currency, cryptocurrencies and their taxation need to be clearly defined for businesses and individuals. Regulatory sandboxes help trial new applications. Interoperability - Various electronic currency platforms currently operate independently, but commercial use will require standards and protocols for electronic currencys to interact with each other seamlessly. Energy Consumption - The computation power needed to verify transactions in public electronic currencys like Bitcoin requires substantial energy. Alternative consensus algorithms aim to reduce this footprint. Skills Shortage - A lack of electronic currency developers and qualified professionals currently limits development and innovation using this advancing technology. Educational programs are addressing this gap. Electronic currency technology provides a secure, decentralized foundation for storing and transferring digital assets and data. Overcoming current limitations will unlock even greater potential across industries in the coming years. Although challenges remain, ongoing research and real-world pilots are gradually creating an ecosystem that will transform how we interact digitally on a global scale and lay the groundwork for whole new business and governance models. Electronic currency is set to revolutionize our digital world just as the internet did in the past few decades.
Get more insights on Blockchain
Priya Pandey is a dynamic and passionate editor with over three years of expertise in content editing and proofreading. Holding a bachelor's degree in biotechnology, Priya has a knack for making the content engaging. Her diverse portfolio includes editing documents across different industries, including food and beverages, information and technology, healthcare, chemical and materials, etc. Priya's meticulous attention to detail and commitment to excellence make her an invaluable asset in the world of content creation and refinement.
(LinkedIn- https://www.linkedin.com/in/priya-pandey-8417a8173/)
#Blockchain#Cryptocurrency#Decentralized#Ledger#Smart Contracts#Bitcoin#Ethereum#Distributed Ledger Technology#DLT#Fintech
0 notes
Text
An Exhaustive Manual for Distributed Ledger Application Development
Amidst the swiftly changing technological environment, distributed ledger technology arises as a game-changing influence, poised to transform various domains. As a blockchain app development company, we leverage this decentralized data-storage system, backing cryptocurrencies such as Bitcoin and Ethereum. It guarantees the safe recording of transactions and data, with possible uses extending beyond finance into realms like supply chain management, healthcare, and electoral systems. In this readily comprehensible handbook, we’ll delve into the basics of distributed ledger application development, covering everything from grasping the technology to providing practical advice for constructing applications based on distributed ledger technology.
0 notes
Text
Mastering Blockchain: A Comprehensive Guide to Learning with Blockchain Development Services

Embarking journey learning blockchain complex but rewarding. Blockverse Infotech Solutions understand importance provide inclusive blockchain development services empower individuals and businesses navigate technology landscape. Join us explore essential steps resources mastering blockchain unlocking potential.
Blockchain technology revolutionary transformation industries redefine transact interact digital universe. Whether novice enthusiast experienced developer seeking expand skillset, learning blockchain offers multitude opportunities innovation growth.
First step mastering blockchain understand foundational concepts principles essential. Start familiarize basics distributed ledger technology, cryptographic methods, consensus mechanisms. Online courses, tutorials, books great resources beginners grasp these fundamentals.
Subsequently, delve technical aspects blockchain development. Investigate programming languages commonly utilized blockchain development like Solidity Ethereum smart contracts C++ build blockchain protocols. Practical experience crucial deepen understanding, consider create simple blockchain applications participate coding challenges apply knowledge real-world scenarios.
Progress learning journey, explore advanced subjects decentralized finance (DeFi), non-fungible tokens (NFTs), blockchain scalability solutions. Keep abreast latest industry trends innovations through online forums, developer communities, blockchain conferences. Connecting fellow enthusiasts experts offer valuable insights collaboration opportunities.
Furthermore, contemplate seek certifications join specialized training programs enhance credentials prowess blockchain development. Blockverse Infotech Solutions offers comprehensive blockchain development services, consultancy, training, custom solutions cater specific requirements. Our team experienced blockchain developers dedicated guide every step learning journey help achieve goals blockchain mastery.
In conclusion, learning blockchain dynamic continuous process require dedication, curiosity, perseverance. By follow essential steps leverage expertise blockchain development services like Blockverse Infotech Solutions, begin joyful voyage discovery innovation embracing blockchain technology world.
#what is blockchain technology#what is blockchain software#blockchain development services#defi development companies#dapp development company#defi development services#blockchain application development#distributed ledger technology#white label nft marketplace development
0 notes
Text
Weltbank wickelt digitale Anleihe über Euroclears neues DLT-System ab -- das von Ex-Bitcoin-Entwickler Mike Hearn erfunden wurde
Weltbank wickelt digitale Anleihe über Euroclears neues DLT-System ab -- das von Ex-Bitcoin-Entwickler Mike Hearn erfunden wurde
Blockchain und Distributed Ledger Technology (DLT) haben mit Bitcoin eine monetäre Revolution ausgelöst. Für die Finanzbranche sind sie aber vor allem eine technische Evolution – die nun auch beim weltweit größten Wertpapierabwickler Euroclear ankommt. Continue reading Untitled
View On WordPress
0 notes
Text
1 note
·
View note
Text
#Blockchain Distributed Ledger Market Scope#Blockchain Distributed Ledger Market Forecast#Blockchain Distributed Ledger Market Overview
0 notes
Text
What Are Decentralized Blockchains?
Decentralized blockchains are a type of distributed ledger technology (DLT) that operates on a peer-to-peer network, allowing multiple participants to maintain a shared and synchronized database without relying on a central authority. Unlike traditional centralized systems, where a central entity controls and validates transactions, decentralized blockchains enable a trustless and transparent…
View On WordPress
#Adoption#AI#Bitcoin#Blockchain#crypto#Cryptocurrency#decentralization#DeFi#distributed ledger technology#Ethereum
0 notes
Text


⠀ ⠀welcome to the manifesting seance club.
sit down. no, seriously, sit. the spirits are pacing. the stars are staring. you’re being perceived in real time.
AHEM. before we begin, a moment of academic showboating: the knowledge i am about to graciously, magnanimously, almost divinely bestow upon you has been extracted from sources so reputable, so critically esteemed, that to ignore them would be akin to walking past the oracle at delphi and asking a guy named kevin for directions instead. sources such as . . . ୨୧
" esoteric astrology " by alice a. bailey " the astrology of fate " by liz greene " saturn : a new look at an old devil " by liz greene " hellenistic astrology : the study of fate and fortune " by chris brennan
all of which are required reading if you want to, you know, actually know things. otherwise, feel free to just wing it. people have built entire careers off of significantly less.

anyway, welcome to manifesting séance club. which is to say, a completely necessary and not at all ridiculous initiative in which i, with the help of the cosmos, will deign to tell you exactly how you should be manifesting based on your zodiac sign. you can take this with the weight of divine scripture, or you can take it with a large, gratuitous grain of salt and see this as entertainment only. either way, the planets have spoken.
. . . now, let’s see what they say about you
⠀⠀ ✶ ⠀⠀ 𝐚ries⠀⠀⠀⠀⠀
omen : aries manifests like they’re storming the beaches of normandy. it’s not a process, it’s an ambush. every morning, a new battle plan scrawled on a napkin, ripped in half by noon. immediate results or nothing at all. there’s no patience for the slow drip of reality conforming to their will. they want tectonic shifts, they want fireworks, they want god himself to clock in some overtime.
fate’s verdict : cosmic tantrum. they don’t wait for the stars to align, they drag them into formation. but the universe prefers the long game, and aries does not. the lesson here is simple . . . it will happen, but not in the way you’re trying to force it. stop manifesting like you’re throwing grenades into the void.
⠀꒰ prescription : let go. just a little. just enough to let the universe breathe. ⠀manifestation is not a hostage situation.
⠀⠀ ✶ ⠀⠀ 𝐭aurus⠀⠀⠀⠀⠀
omen : taurus manifests like an investment banker, a landowner, a careful deity counting their coins before distributing miracles. they do not believe in asking the universe for favours without putting down collateral, vision boards, rituals, journals so thick they could stop a bullet. the future is built in increments, brick by brick. manifestation as empire-building.
fate’s verdict : a little too grounded, a little too rational. taurus sometimes mistakes manifestation for a to-do list rather than an act of faith. this is the hill they will die on, ledger in hand.
⠀꒰ prescription : loosen the grip. manifestation isn’t a contract, you don’t need a ⠀cosigner. ask. then trust that it’s being worked out somewhere beyond your ⠀jurisdiction.
⠀⠀ ✶ ⠀⠀ 𝐠emini⠀⠀⠀⠀⠀
omen : gemini manifests like a conspiracy theorist with a corkboard full of red string. everything is possible, every reality is within reach. they could be a doctor, a poet, a movie star, a revolutionary, sometimes all in the same afternoon. the problem is the sheer velocity of belief. one day they’re visualising love, the next they’ve decided celibacy is the key to enlightenment. their manifestations lack consistency, collapsing under their own contradictions.
fate’s verdict : too many tabs open. gemini’s mind is a quantum superposition of possibilities, but the universe prefers clarity. pick a lane. stay in it.
⠀꒰ prescription : write it down. once. no revisions. stick to it for longer than a week.
⠀⠀ ✶ ⠀⠀ 𝐜ancer⠀⠀⠀⠀⠀
omen : cancer manifests like a poet in a garret, talking into the dark, hoping the cosmos is listening. emotions are the currency, nostalgia the driving force. manifestation as longing. as a half-forgotten song. they dream in sepia tones, in candlelight and old film reels. they don’t just want something, they want to be consumed by it.
fate’s verdict : beautiful. but manifestation is an act of creation, not just yearning alone.
⠀꒰ prescription : clarify the vision. make it real, tangible, specific. want, but also ⠀act.
⠀⠀ ✶ ⠀⠀ 𝐥eo⠀⠀⠀⠀⠀
omen : leo manifests like a celebrity giving an acceptance speech before the award has even been announced. they assume the universe is their audience, their stage, their greatest admirer. naturally, their manifestations are grand, cinematic, dripping with self-belief. they don’t request, they declare. they don’t doubt, they expect.
fate’s verdict : they’re not wrong, but sometimes they rely too much on the applause. the universe doesn’t care about the optics, it cares about the energy behind them. manifestation is not performance art.
⠀꒰ prescription : make sure you want it for you. not for the audience, not for the ⠀applause, not for the standing ovation. just for you.
⠀⠀ ✶ ⠀⠀ 𝐯irgo⠀⠀⠀⠀⠀
omen : virgo manifests like an engineer drafting blueprints for god. meticulous, precise, airtight. a plan within a plan within a plan. they don’t just manifest . . . they optimise. they find flaws in their own dreams before they’ve even begun, tweaking and adjusting, searching for perfection before the universe even has a chance to deliver.
fate’s verdict : manifestation requires some degree of surrender. virgo’s approach is admirable, but they risk micromanaging the cosmos. control is an illusion. perfection is a myth.
⠀꒰ prescription : stop editing the vision. let it breathe. let it live.
⠀⠀ ✶ ⠀⠀ 𝐥ibra⠀⠀⠀⠀⠀
omen : libra manifests like an artist with too many unfinished canvases. they want everything, in all its beauty, but they can never quite decide what to ask for. they spend more time weighing options than actually committing to a vision. manifestation as a game of what-if.
fate’s verdict : indecision is the enemy. the universe responds to clarity, not hesitation. a wish half-made is a wish unheard.
⠀꒰ prescription : pick something. anything. stick to it. see it through.
⠀⠀ ✶ ⠀⠀ 𝐬corpio⠀⠀⠀⠀⠀
omen : scorpio manifests like a sorcerer muttering in a locked room, like an old god stirring in its sleep. manifestation as alchemy. as transformation. their will is absolute, their focus terrifying. they do not just ask for what they want, they become it.
fate’s verdict : powerful, but isolating. scorpio sometimes forgets that manifestation doesn’t have to be a solitary act, that the universe is not an adversary but an accomplice.
⠀꒰ prescription : soften. let it in. manifestation is not a lone pursuit.
⠀⠀ ✶ ⠀⠀ 𝐬agittarius⠀⠀⠀⠀⠀
omen : sagittarius manifests like an explorer mapping out an undiscovered country. they see possibility everywhere, in every corner of the universe. their manifestations are broad, open-ended, half-prayers, half-dares. they don’t demand, they leap.
fate’s verdict : good energy, unfocused. sagittarius needs to narrow the scope, sharpen the vision.
⠀꒰ prescription : be specific. manifestation is not a vague wish upon a star.
⠀⠀ ✶ ⠀⠀ 𝐜apricorn⠀⠀⠀⠀⠀
omen : capricorn manifests like an architect designing a cathedral that will take centuries to complete. slow, steady, methodical. they don’t just wish; they work. they lay foundations while others are still drafting dreams.
fate’s verdict : excellent, but exhausting. capricorn sometimes forgets that manifestation is not solely an act of labour. effort is crucial, but so is belief.
⠀꒰ prescription : trust. allow for miracles. not everything requires blood, sweat, and ⠀spreadsheets.
⠀⠀ ✶ ⠀⠀ 𝐚quarius⠀⠀⠀⠀⠀
omen : aquarius manifests like a mad scientist in a laboratory of their own making. their visions are radical, their ideas borderless. they do not want what others want. their manifestations often seem impossible until, suddenly, they’re not.
fate’s verdict : brilliant, but scattered. aquarius has a habit of overcomplicating what should be simple. manifestation is not always a revolution.
⠀꒰ prescription : simplify. sometimes the best way forward is the obvious one.
⠀⠀ ✶ ⠀⠀ 𝐩isces⠀⠀⠀⠀⠀
omen : pisces manifests like a dreamer lost in their own reverie. manifestation as fantasy, as daydream, as an ethereal whisper into the cosmos. they believe in miracles, in divine intervention, in the soft hand of fate guiding them.
fate’s verdict : beautiful, but passive. manifestation is co-creation, not just waiting for the stars to do the work.
⠀꒰ prescription : dream, but also know. the universe moves when you know.
#emma motivates#shifting#reality shifting#shifting motivation#loa success#loassblog#master manifestor#loassumption#loa tumblr#loablr#shifting realities#loass#loa blog#neville goddard#manifestation#law of manifestation#instant manifestation#self concept#manifesting#how to manifest#law of attraction#law of assumption#4d reality#manifest#manifesation#law of abundance
342 notes
·
View notes
Text

For the past six years or so, this graph has been making its rounds on social media, always reappearing at conveniently timed moments…
The insinuation is loud and clear: parallels abound between 18th-century France and 21st-century USA. Cue the alarm bells—revolution is imminent! The 10% should panic, and ordinary folk should stock up on non-perishables and, of course, toilet paper, because it wouldn’t be a proper crisis without that particular frenzy. You know the drill.

Well, unfortunately, I have zero interest in commenting on the political implications or the parallels this graph is trying to make with today’s world. I have precisely zero interest in discussing modern-day politics here. And I also have zero interest in addressing the bottom graph.
This is not going to be one of those "the [insert random group of people] à la lanterne” (1) kind of posts. If you’re here for that, I’m afraid you’ll be disappointed.
What I am interested in is something much less click-worthy but far more useful: how historical data gets used and abused and why the illusion of historical parallels can be so seductive—and so misleading. It’s not glamorous, I’ll admit, but digging into this stuff teaches us a lot more than mindless rage.
So, let’s get into it. Step by step, we’ll examine the top graph, unpick its assumptions, and see whether its alarmist undertones hold any historical weight.
Step 1: Actually Look at the Picture and Use Your Brain
When I saw this graph, my first thought was, “That’s odd.” Not because it’s hard to believe the top 10% in 18th-century France controlled 60% of the wealth—that could very well be true. But because, in 15 years of studying the French Revolution, I’ve never encountered reliable data on wealth distribution from that period.
Why? Because to the best of my knowledge, no one was systematically tracking income or wealth across the population in the 18th century. There were no comprehensive records, no centralised statistics, and certainly no detailed breakdowns of who owned what across different classes. Graphs like this imply data, and data means either someone tracked it or someone made assumptions to reconstruct it. That’s not inherently bad, but it did get my spider senses tingling.
Then there’s the timeframe: 1760–1790. Thirty years is a long time— especially when discussing a period that included wars, failed financial policies, growing debt, and shifting social dynamics. Wealth distribution wouldn’t have stayed static during that time. Nobles who were at the top in 1760 could be destitute by 1790, while merchants starting out in 1760 could be climbing into the upper tiers by the end of the period. Economic mobility wasn’t common, but over three decades, it wasn’t unheard of either.
All of this raises questions about how this graph was created. Where’s the data coming from? How was it measured? And can we really trust it to represent such a complex period?
Step 2: Check the Fine Print
Since the graph seemed questionable, the obvious next step was to ask: Where does this thing come from? Luckily, the source is clearly cited at the bottom: “The Income Inequality of France in Historical Perspective” by Christian Morrisson and Wayne Snyder, published in the European Review of Economic History, Vol. 4, No. 1 (2000).

Great! A proper academic source. But, before diving into the article, there’s a crucial detail tucked into the fine print:
“Data for the bottom 40% in France is extrapolated given a single data point.”
What does that mean?
Extrapolation is a statistical method used to estimate unknown values by extending patterns or trends from a small sample of data. In this case, the graph’s creator used one single piece of data—one solitary data point—about the wealth of the bottom 40% of the French population. They then scaled or applied that one value to represent the entire group across the 30-year period (1760–1790).
Put simply, this means someone found one record—maybe a tax ledger, an income statement, or some financial data—pertaining to one specific year, region, or subset of the bottom 40%, and decided it was representative of the entire demographic for three decades.
Let’s be honest: you don’t need a degree in statistics to know that’s problematic. Using a single data point to make sweeping generalisations about a large, diverse population (let alone across an era of wars, famines, and economic shifts) is a massive leap. In fact, it’s about as reliable as guessing how the internet feels about a topic from a single tweet.
This immediately tells me that whatever numbers they claim for the bottom 40% of the population are, at best, speculative. At worst? Utterly meaningless.

It also raises another question: What kind of serious journal would let something like this slide? So, time to pull up the actual article and see what’s going on.
Step 3: Check the Sources
As I mentioned earlier, the source for this graph is conveniently listed at the bottom of the image. Three clicks later, I had downloaded the actual article: “The Income Inequality of France in Historical Perspective” by Morrisson and Snyder.
The first thing I noticed while skimming through the article? The graph itself is nowhere to be found in the publication.
This is important. It means the person who created the graph didn’t just lift it straight from the article—they derived it from the data in the publication. Now, that’s not necessarily a problem; secondary analysis of published data is common. But here’s the kicker: there’s no explanation in the screenshot of the graph about which dataset or calculations were used to make it. We’re left to guess.
So, to figure this out, I guess I’ll have to dive into the article itself, trying to identify where they might have pulled the numbers from. Translation: I signed myself up to read 20+ pages of economic history. Thrilling stuff.
But hey, someone has to do it. The things I endure to fight disinformation...
Step 4: Actually Assess the Sources Critically
It doesn’t take long, once you start reading the article, to realise that regardless of what the graph is based on, it’s bound to be somewhat unreliable. Right from the first paragraph, the authors of the paper point out the core issue with calculating income for 18th-century French households: THERE IS NO DATA.
The article is refreshingly honest about this. It states multiple times that there were no reliable income distribution estimates in France before World War II. To fill this gap, Morrisson and Snyder used a variety of proxy sources like the Capitation Tax Records (2), historical socio-professional tables, and Isnard’s income distribution estimates (3).
After reading the whole paper, I can say their methodology is intriguing and very reasonable. They’ve pieced together what they could by using available evidence, and their process is quite well thought-out. I won’t rehash their entire argument here, but if you’re curious, I’d genuinely recommend giving it a read.
Most importantly, the authors are painfully aware of the limitations of their approach. They make it very clear that their estimates are a form of educated guesswork—evidence-based, yes, but still guesswork. At no point do they overstate their findings or present their conclusions as definitive
As such, instead of concluding with a single, definitive version of the income distribution, they offer multiple possible scenarios.
It’s not as flashy as a bold, tidy graph, is it? But it’s far more honest—and far more reflective of the complexities involved in reconstructing historical economic data.
Step 5: Run the numbers
Now that we’ve established the authors of the paper don’t actually propose a definitive income distribution, the question remains: where did the creators of the graph get their data? More specifically, which of the proposed distributions did they use?
Unfortunately, I haven’t been able to locate the original article or post containing the graph. Admittedly, I haven’t tried very hard, but the first few pages of Google results just link back to Twitter, Reddit, Facebook, and Tumblr posts. In short, all I have to go on is this screenshot.
I’ll give the graph creators the benefit of the doubt and assume that, in the full article, they explain where they sourced their data. I really hope they do—because they absolutely should.
That being said, based on the information in Morrisson and Snyder’s paper, I’d make an educated guess that the data came from Table 6 or Table 10, as these are the sections where the authors attempt to provide income distribution estimates.

Now, which dataset does the graph use? Spoiler: None of them.
How can we tell? Since I don’t have access to the raw data or the article where this graph might have been originally posted, I resorted to a rather unscientific method: I used a graphical design program to divide each bar of the chart into 2.5% increments and measure the approximate percentage for each income group.
Here’s what I found:

Now, take a moment to spot the issue. Do you see it?
The problem is glaring: NONE of the datasets from the paper fit the graph. Granted, my measurements are just estimates, so there might be some rounding errors. But the discrepancies are impossible to ignore, particularly for the bottom 40% and the top 10%.
In Morrisson and Snyder’s paper, the lowest estimate for the bottom 40% (1st and 2nd quintiles) is 10%. Even if we use the most conservative proxy, the Capitation Tax estimate, it’s 9%. But the graph claims the bottom 40% held only 6%.
For the top 10% (10th decile), the highest estimate in the paper is 53%. Yet the graph inflates this to 60%.
Step 6: For fun, I made my own bar charts
Because I enjoy this sort of thing (yes, this is what I consider fun—I’m a very fun person), I decided to use the data from the paper to create my own bar charts. Here’s what came out:

What do you notice?
While the results don’t exactly scream “healthy economy,” they look much less dramatic than the graph we started with. The creators of the graph have clearly exaggerated the disparities, making inequality seem worse.
Step 7: Understand the context before drawing conclusions
Numbers, by themselves, mean nothing. Absolutely nothing.
I could tell you right now that 47% of people admit to arguing with inanimate objects when they don’t work, with printers being the most common offender, and you’d probably believe it. Why? Because it sounds plausible—printers are frustrating, I’ve used a percentage, and I’ve phrased it in a way that sounds “academic.”
You likely wouldn’t even pause to consider that I’m claiming 3.8 billion people argue with inanimate objects. And let’s be real: 3.8 billion is such an incomprehensibly large number that our brains tend to gloss over it.
If, instead, I said, “Half of your friends probably argue with their printers,” you might stop and think, “Wait, that seems a bit unlikely.” (For the record, I completely made that up—I have no clue how many people yell at their stoves or complain to their toasters.)
The point? Numbers mean nothing unless we put them into context.
The original paper does this well by contextualising its estimates, primarily through the calculation of the Gini coefficient (4).
The authors estimate France’s Gini coefficient in the late 18th century to be 0.59, indicating significant income inequality. However, they compare this figure to other regions and periods to provide a clearer picture:
Amsterdam (1742): Much higher inequality, with a Gini of 0.69.
Britain (1759): Lower inequality, with a Gini of 0.52, which rose to 0.59 by 1801.
Prussia (mid-19th century): Far less inequality, with a Gini of 0.34–0.36.
This comparison shows that income inequality wasn’t unique to France. Other regions experienced similar or even higher levels of inequality without spontaneously erupting into revolution.
Accounting for Variations
The authors also recalculated the Gini coefficient to account for potential variations. They assumed that the income of the top quintile (the wealthiest 20%) could vary by ±10%. Here’s what they found:
If the top quintile earned 10% more, the Gini coefficient rose to 0.66, placing France significantly above other European countries of the time.
If the top quintile earned 10% less, the Gini dropped to 0.55, bringing France closer to Britain’s level.
Ultimately, the authors admit there’s uncertainty about the exact level of inequality in France. Their best guess is that it was comparable to other countries or somewhat worse.
Step 8: Drawing Some Conclusions
Saying that most people in the 18th century were poor and miserable—perhaps the French more so than others—isn’t exactly a compelling statement if your goal is to gather clicks or make a dramatic political point.
It’s incredibly tempting to look at the past and find exactly what we want to see in it. History often acts as a mirror, reflecting our own expectations unless we challenge ourselves to think critically. Whether you call it wishful thinking or confirmation bias, it’s easy to project the future onto the past.
Looking at the initial graph, I understand why someone might fall into this trap. Simple, tidy narratives are appealing to everyone. But if you’ve studied history, you’ll know that such narratives are a myth. Human nature may not have changed in thousands of years, but the contexts we inhabit are so vastly different that direct parallels are meaningless.
So, is revolution imminent? Well, that’s up to you—not some random graph on the internet.
Notes
(1) A la lanterne was a revolutionary cry during the French Revolution, symbolising mob justice where individuals were sometimes hanged from lampposts as a form of public execution
(2) The capitation tax was a fixed head tax implemented in France during the Ancien Régime. It was levied on individuals, with the amount owed determined by their social and professional status. Unlike a proportional income tax, it was based on pre-assigned categories rather than actual earnings, meaning nobles, clergy, and commoners paid different rates regardless of their actual wealth or income.
(3) Jean-Baptiste Isnard was an 18th-century economist. These estimates attempted to describe the theoretical distribution of income among different social classes in pre-revolutionary France. Isnard’s work aimed to categorise income across groups like nobles, clergy, and commoners, providing a broad picture of economic disparity during the period.
(4) The Gini coefficient (or Gini index) is a widely used statistical measure of inequality within a population, specifically in terms of income or wealth distribution. It ranges from 0 to 1, where 0 indicates perfect equality (everyone has the same income or wealth), and 1 represents maximum inequality (one person or household holds all the wealth).
#frev#french revolution#history#disinformation#income inequality#critical thinking#amateurvoltaire's essay ramblings#don't believe everything you see online#even if you really really want to
243 notes
·
View notes