#NOAA weather radar
Text
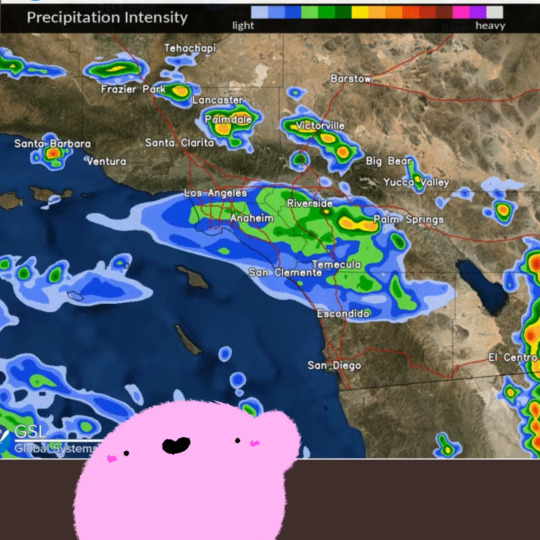
#kirby#daily kirby#my art#digital#hal laboratory#nintendo#radar prediction provided by NOAA#(this was actually a prediction for yesterday but he looked like he should be pointing at Weather)#(and southern california does not have Weather to point at very often)#(coulda just picked somewhere else I guess had there not been Recent Weather)#(did you know there are hurricanes in the pacific too?? I thought they were pretty exclusive to the atlantic)#(but I've never lived this far south before so they never made it up to us either way)#(except possibly one time.)
107 notes
·
View notes
Photo
108 notes
·
View notes
Text
encouraging
Last night I got very mildly high (a really great thing about being middle-aged in this new era of legal weed is that it's really easy to get very consistent and reliable gummies with very consistent and reliable doses of THC so you can get yourself very mildly stoned, not enough to freak out or like lose time or anything, just enough to be Altered and take a little mini-vacation from your own brainweasels, and wake up refreshed the next day instead of hung-over) and scrolled Tumblr until I saw that post about multi-vortex "dead man walking" tornadoes again, and that got me to go search up the one they mentioned by name and then go into a wikipedia spiral about destructive multi-vortex tornadoes. (The post, shockingly, isn't totally accurate, but isn't like. wrong-wrong. For the record though the dead man walking bit of the tornado wasn't as deadly as the just wall-of-black that came later.)
And actually while it was terrifying to see what kind of destruction the weather can wreak, it was kind of... encouraging. Reading the accounts of historical storms and more recent ones, there's this throughline of learning, of new regulations and guidelines, of science being done. The old historic tornadoes, not only were the casualties high, but the aftermath horrible, people missing, fires wiping out survivors, local economies irrevocably destroyed. The newer tornadoes, often the weather itself was more severe, but there are fewer and fewer casualties, better warnings and advice from meteorologists, better government response. I didn't track any of my sources on this and I've closed the window so I'd stop reading about it, but I read with interest about how in 1991 a news team sheltered under an overpass during a scary but relatively weak tornado, and broadcast footage of this, and then in a much stronger early-2000s tornado, a number of people were killed sheltering under highway overpasses, and then by the 2010s the advice to avoid highway overpasses had become common knowledge, and people are no longer being killed this way. (Also I finally had my question answered, having been on the Thruway during a tornado warning: why not shelter under an overpass? Well! Because of fluid dynamics. Just as water pressure intensifies when going through a sudden narrowing in a pipe, so too does wind going through a narrower space, so if you're hiding in that narrow space you are gonna get sucked out of it. So if you find yourself out in the open, do not shelter under a bridge or overpass! Shelter instead in a ditch if you can find one, or a hollow in the ground, something open to the sky so the wind will not intensify passing through it. Now You Know. ok fine I reopened the tab to cite this: NOAA's page on this topic)
Another one was a storm in the 20s where several of the casualties were farmers out in their fields, taken unawares. Normally farmers are weather-savvy, the article said, and would know to shelter from storms, but this tornado had an unusual appearance, and took them by surprise. Contrast that to later storms, where mobile radars were deployed, where meterologists and broadcasters had protocols already in place, where local inhabitants knew to listen and knew how to respond-- there are still instances of bad advice, like an Oklahoma TV weatherman telling people to get in their cars and evacuate which led to gridlock on the local highway which would have resulted in hundreds of casualties save for the tornado missing that area, but mostly people know now what to do. The casualties are much sparser, and many of them now are, instead of people making fatal mistakes, instead people doing the right thing but the storm just being too powerful. (No less tragic, but I suppose it's slightly less heartbreaking to know it was just bad luck and not also poor information.)
And you see examples like in 2011 the 12 oil rig workers, who sheltered in the change house, which due to new information about tornadoes had been built with tie-downs, which nearly failed but did not and all twelve souls were spared, and the company improved construction of future change houses as tornado shelters based on this information.
Anyway, it was a weird thing to fixate on for the evening but in the end it did leave me with a feeling of hopefulness. Like, this is a thing where science and good government actually can concretely improve outcomes.
Let's not extend our worry into climate change making all this worse, just yet, and leave it at this.
LOL this is so poorly cited I'm turning reblogs off, and hopefully I'm done obsessing about tornadoes for a lil bit now. Well, we'll see if that resolution sticks, I reopened tabs to put in at least minimal citations here and haven't closed them yet.
39 notes
·
View notes
Text
NOAA finally has a predictive map to show how water levels in Michigan/the great lakes region could adjust with climate change. (Having a hell of a time finding the link to the actual tool, but i think its this one.) I'm really interested in this bc for YEARS everyone has said "coastal regions will be the most affected" but also that "the great lakes will be relatively protected" in the same breath. Really, the only prediction I've seen is that we will get hella climate refugees from the drought-ridden areas. In fact, some people I've spoken with have had an outright blase attitude about how climate change is going to hit Michigan.
I've been trying to find info about the coastlines and weather changing for four YEARS and haven't been able to find anything other than "no one knows, but NOAA is watching it." NOAA has a fuckton of really interesting sea vessels and research initiatives around here btw! I follow their aurora forecast religiously, they have all kinds of ROVs that explore the formations and sinkholes ans shipwrecks at the bottoms of the lakes, and now this, which I've obviously been waiting for someone to address.
If you live in the coastal region of Michigan you can SEE it happening in real time. Cliffs eroding, homes spilling into the sea, the shoreline and water levels changing dramatically between seasons. When I was a kid, there were yards and yards worth of beach and dunes to walk across to get to the water. Like easily half a block or more. When I came back in 2020, there was about 6 feet of beach. In just 4 years, the water levels have gone back and forth so much that it goes from being like this- so flooded there's no more beach- to Hamlin Lake this spring, following the extreme lack of snowfall:
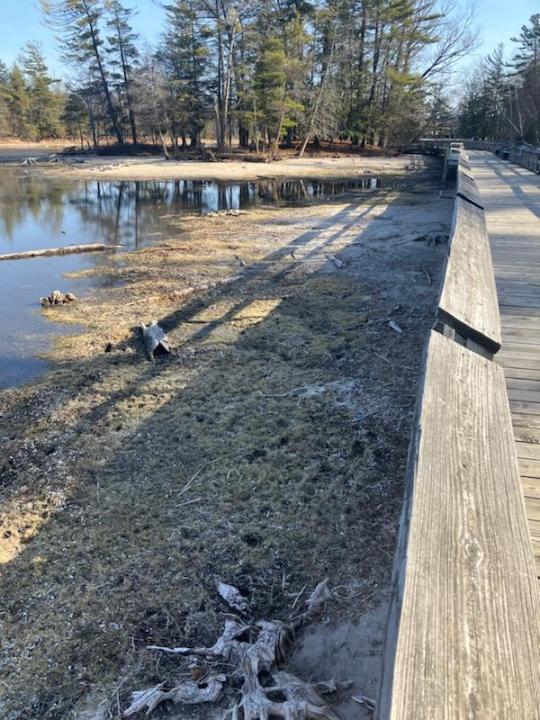
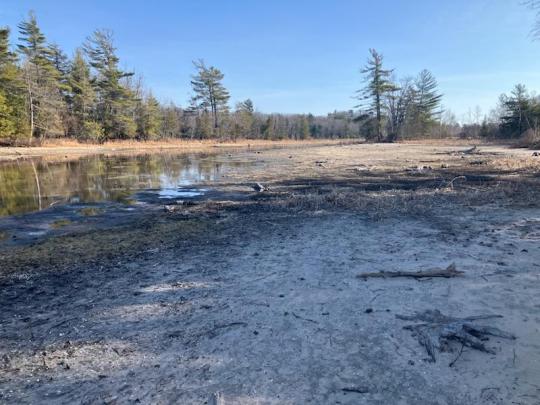
My parents took these a few weeks ago. This is a lake, not a river or a creek. This is typically a BEACH. There is a dam on the far side of this lake. There are boardwalks to walk across the water and places where usually, you'd be able to kayak or canoe under the bridge. This campground is one of the most sought after, highest rated campgrounds in the entire United States. You have to reserve on New Years the minute they open registration to get a site.
Tbf Hamlin Lake is enormous, but the part that's dry.... is also not small, and its THE spot, right at the campsite. I highlighted it here.
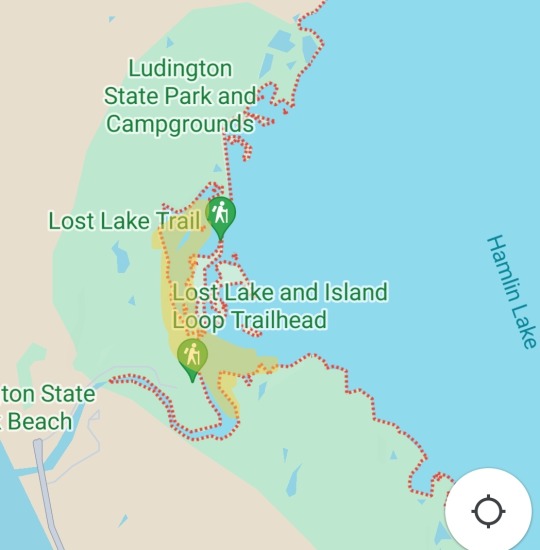
Seeing it this dry is at least as shocking as going to lake michigan and seeing the water level randomly get so high you can't even put a towel down. It's at least as shocking as how unbelievably violent the wind and weather has gotten, how common gale force winds strong enough to shake houses and tear off siding are, the way they cannot reliably predict even normal weather on the coast anymore. The way the popup storms loom, undetected on the radar. It's at least as shocking as watching the dunes get smaller and smaller and cleave apart the more erosion they undergo, the more people that walk on them, watching the dunegrass and the scraggly beach trees straining at the roots to hold the earth together. It's at least as shocking as every time I've seen they clear cut a new swath of national forest for cabin rentals. We can't keep doing this. We can't keep doing this we can't keep doing this.
Anyway, this is just your friendly reminder that the Great Lakes ARE, in fact, part of America's coastal region. they are inland, freshwater seas rather than "lakes" as the names imply, and they, too, cannot remain unchanged by global warming.
Remember this when you think about the six YEARS it took for Flint to get clean water.
Just some food for thought.
#me#home#climate change#us politics#it was colonizers calling them lakes. do you think those guys knew fuck shit about anything.#the french ones no less.#pere marquette had his filthy little hands all OVER this region#michigan
2 notes
·
View notes
Video
International Sea Level Satellite Spots Early Signs of El Niño Kelvin waves, a potential precursor of El Niño conditions in the ocean, are rolling across the equatorial Pacific toward the coast of South America. The most recent sea level data from the U.S.-European satellite Sentinel-6 Michael Freilich indicates early signs of a developing El Niño across the equatorial Pacific Ocean. The data shows Kelvin waves – which are roughly 2 to 4 inches (5 to 10 centimeters) high at the ocean surface and hundreds of miles wide – moving from west to east along the equator toward the west coast of South America. When they form at the equator, Kelvin waves bring warm water, which is associated with higher sea levels, from the western Pacific to the eastern Pacific. A series of Kelvin waves starting in spring is a well-known precursor to an El Niño, a periodic climate phenomenon that can affect weather patterns around the world. It is characterized by higher sea levels and warmer-than-average ocean temperatures along the western coasts of the Americas. Water expands as it warms, so sea levels tend to be higher in places with warmer water. El Niño is also associated with a weakening of the trade winds. The condition can bring cooler, wetter conditions to the U.S. Southwest and drought to countries in the western Pacific, such as Indonesia and Australia. The Sentinel-6 Michael Freilich satellite data shown here covers the period between the beginning of March and the end of April 2023. By April 24, Kelvin waves had piled up warmer water and higher sea levels (shown in red and white) off the coasts of Peru, Ecuador, and Colombia. Satellites like Sentinel-6 Michael Freilich can detect Kelvin waves with a radar altimeter, which uses microwave signals to measure the height of the ocean’s surface. When an altimeter passes over areas that are warmer than others, the data will show higher sea levels. “We’ll be watching this El Niño like a hawk,” said Josh Willis, Sentinel-6 Michael Freilich project scientist at NASA’s Jet Propulsion Laboratory in Southern California. “If it’s a big one, the globe will see record warming, but here in the Southwest U.S. we could be looking at another wet winter, right on the heels of the soaking we got last winter.” Both the U.S. National Oceanic and Atmospheric Administration (NOAA) and the World Meteorological Organization have recently reported increased chances that El Niño will develop by the end of the summer. Continued monitoring of ocean conditions in the Pacific by instruments and satellites such as Sentinel-6 Michael Freilich should help to clarify in the coming months how strong it could become. “When we measure sea level from space using satellite altimeters, we know not only the shape and height of water, but also its movement, like Kelvin and other waves,” said Nadya Vinogradova Shiffer, NASA program scientist and manager for Sentinel-6 Michael Freilich in Washington. “Ocean waves slosh heat around the planet, bringing heat and moisture to our coasts and changing our weather.” More About the Mission Sentinel-6 Michael Freilich, named after former NASA Earth Science Division Director Michael Freilich, is one of two satellites that compose the Copernicus Sentinel-6/Jason-CS (Continuity of Service) mission. Sentinel-6/Jason-CS was jointly developed by ESA (European Space Agency), the European Organisation for the Exploitation of Meteorological Satellites (EUMETSAT), NASA, and NOAA, with funding support from the European Commission and technical support on performance from the French space agency CNES (Centre National d’Études Spatiales). Spacecraft monitoring and control, as well as the processing of all the altimeter science data, is carried out by EUMETSAT on behalf of the European Union’s Copernicus programme, with the support of all partner agencies. JPL, a division of Caltech in Pasadena, contributed three science instruments for each Sentinel-6 satellite: the Advanced Microwave Radiometer, the Global Navigation Satellite System - Radio Occultation, and the Laser Retroreflector Array. NASA also contributed launch services, ground systems supporting operation of the NASA science instruments, the science data processors for two of these instruments, and support for the U.S. members of the international Ocean Surface Topography Science Team. IMAGE....This animation shows a series of waves, called Kelvin waves, moving warm water across the equatorial Pacific Ocean from west to east during March and April. The signals can be an early sign of a developing El Niño, and were detected by the Sentinel-6 Michael Freilich sea level satellite. Credit: NASA/JPL-Caltech
5 notes
·
View notes
Text

I’m officially obsessed with this puppet show ARG, so here’s my OC.
Fun Fact: R.F.D. is inspired by RFD (rear flank downdraft), which means "A region of dry air subsiding on the back side of, and wrapping around, a mesocyclone. It often is visible as a clear slot wrapping around the wall cloud. Scattered large precipitation particles (rain and hail) at the interface between the clear slot and wall cloud may show up on radar as a hook or pendant; thus the presence of a hook or pendant may indicate the presence of an RFD" (Glossary - NOAA's National Weather Service).
https://forecast.weather.gov/glossary.php?word=rear%20flank%20downdraft
#welcome home#welcome home arg#welcome home oc#welcome home fanart#welcome home fan character#cw: mention of natural disasters#welcome home puppet show#autistic illustrator#illustrators on tumblr#graphic designer#graphic designers on tumblr#procreate art#adobe illustrator#nostalgic woodwind’s art
6 notes
·
View notes
Text
The U.S. experiences about 80% to 90% of all of the tornadoes that occur across the world.
About 1,200 tornadoes hit the U.S. each year, the National Severe Storms Laboratory said.
Tornadoes are rated from EF-0 (light damage) to EF-5 (incredible damage) based on a list of damage indicators.
. . .
However, the peak tornado season for the southern Plains (Texas, Oklahoma and Kansas) is from May into early June, NOAA said. And along the Gulf Coast, it is earlier in the spring. In the northern Plains and upper Midwest (North and South Dakota, Nebraska, Iowa and Minnesota), tornado season is in June or July.
Overall, there is a general northward shift in tornado season in the U.S. from late winter through midsummer.
Tornadoes can also happen at any time of day or night, but most tornadoes occur from 4–9 p.m.
. . .
If you are at home during a tornado warning, go to your basement, safe room or an interior room away from windows. If you're outside, seek shelter inside a sturdy building immediately if a tornado is approaching.
If you're in a vehicle, the best course of action is to drive to the closest shelter. If you are unable to make it to a safe shelter, either get down in your car and cover your head or abandon your car and seek shelter in a low-lying area such as a ditch or ravine.
. . .
A tornado watch means weather conditions are ripe for tornadoes to form. A warning means one has been spotted or indicated on radar.
-----
Do not get under an overpass during a tornado! They became a popular after video of a news team hiding under one made the rounds. In reality, winds increase under overpasses during tornadoes. The tornado in the video was weak, and the people were just lucky.
1 note
·
View note
Link
NASA high-end computing plays a key role in taking many agency missions from concept to application in the real world. From increasing accuracy of global weather forecasts for forecast entities (like NOAA) to warn of severe storms, to designs for future air taxis to safely fly people around urban areas, to parachute design tests for landing spacecraft on the Moon and other planets, our supercomputing resources and experts are driving science and engineering advances for the benefit of humanity. These projects and much more will be on display in the agency’s hybrid exhibit during SC23, the International Conference for High Performance Computing, Networking, Storage and Analysis. This year’s conference is being held in Denver, Nov. 12–17. 1. Simulating Air Taxi Safety Near the Ground With the development of urban air mobility (UAM) vehicles, in the near future people might be hailing rides in air taxis. Researchers studying the aerodynamics performance of multiple UAM designs are focusing this year on simulations to analyze how these vehicles perform close to the ground. Many of the agency’s UAM aircraft concepts have rotors, just like helicopters. Supercomputers at the NASA Advanced Supercomputing (NAS) facility at NASA’s Ames Research Center in California’s Silicon Valley run complex, high-fidelity computational fluid dynamics simulations that capture in detail the interaction between rotors, other vehicle components, and the ground surface. These simulations enable scientists to better understand the vehicle aerodynamics and the rotor-induced flow around the vehicles to detect potentially dangerous areas with high winds and gusts. Simulation data allows the team to predict changes in how UAMs handle close to the ground and to provide guidelines for safe crew and passenger movement near the vehicles. NASA’s six-passenger air taxi quadcopter in hover (out of ground effect). Q-criterion — a measure of the amount of vorticity in the aerodynamic flow — isosurfaces colored with the vorticity magnitude show the vortex wake, where blue is low and magenta is high. In the background, the pressure coefficient is shown, where black is low and white is high. Understanding the complex flow and aerodynamic interactions of multi-rotor vehicles is key to design the future air taxis.NASA/Patricia Ventura Diaz 2. Predicting the Strongest Storms within a Global Computer Model The common fuel for severe thunderstorms, tornadoes, and hurricanes is convection – vigorous up-and-down motions of the atmosphere that vertically transport heat and moisture. Operational weather forecasting centers typically predict convective-scale weather using regional, limited-area computer models because global models at convection resolving resolution need too much computing power. Researchers at NASA’s Goddard Space Flight Center in Greenbelt, Maryland, have adapted their global Goddard Earth Observing System (GEOS) model to apply finer grid resolutions of 2 to 4 kilometers (about 1.25 to 2.5 miles) over the continental United States. GEOS forecasts running on the NASA Center for Climate Simulation’s (NCCS’s) Discover supercomputer and NAS’s Aitken supercomputer are extending the predictability of the strongest storms beyond two days while better representing local impacts from intense precipitation, winds, and heat. Ongoing simulations accurately tracked extreme weather events of 2023 including hurricanes Idalia and Lee and tropical storm Ophelia. Hurricane Idalia made landfall along Florida’s northern Gulf Coast on August 30, 2023. Radar reflectivity from observations (left) and simulations by the Goddard Earth Observing System (GEOS) model at 4-kilometer (2.5-mile) (center) and 12-kilometer (7.5-mile) (right) resolution visualize Idalia’s internal structure. While both GEOS forecasts captured Idalia’s landfall within miles of the actual landfall days in advance, the 4- kilometer forecast improved representations of central pressure values, near-surface wind speeds, a very compact eye, and banding convection spiraling inwards from the southeast.NASA/William Putman 3. Protecting Space Capsules During Planetary Entry, Descent, and Landing NASA space capsules are designed to survive entering planetary atmospheres at hypersonic speeds and protect their payloads – or their crew – from the extreme temperatures that occur during entry. In addition to heat, the spacecraft can also encounter dynamic instabilities as they are slowed down by aerodynamic drag during descent. To quantify and understand this additional hazard, researchers at NASA Ames used the agency’s Pleiades and Electra supercomputers to simulate the free-flight conditions of capsules during the full trajectory of planetary entry. These complex simulations are used to analyze capsule flight dynamics and identify any risks the instabilities may pose during the later stage of the flight trajectory. The resulting analyses help engineers design entry vehicles for planetary exploration, helping ensure the success of NASA programs including Artemis and the upcoming Dragonfly mission to Saturn’s largest moon, Titan. Free-flight simulation of the Adaptable Deployable Entry and Placement Technology vehicle showing Q-criterion, which is a measure of the amount of vorticity in the aerodynamic flow. The iso-contours indicate vortex structure, indicating lower vorticity in blue and higher vorticity in red.NASA/Joseph Brock 4. Transforming and Depicting Earth Science Data From the agency’s founding in 1958, NASA has been tasked with widely disseminating information about its activities and results. One new NASA public communication effort is the Earth Information Center (EIC), which presents visualizations of raw observational and model data across a set of dashboards arranged like a NASA Mission Control Center for our planet. The EIC installation at NASA Headquarters in Washington includes a multi-panel hyperwall for displaying large-format animations surrounded by smaller portals depicting a number of “vital signs” of the Earth. The diverse data sources include simulations run on the NCCS Discover supercomputer and observations from satellites and ground instruments maintained by NASA and partners. Since opening in late June 2023, the EIC has drawn a great variety of visitors, from dignitaries to elementary school students. In addition, EIC information is aiding policy makers, scientists, and NASA data users such as farmers, business owners, and researchers. The Earth Information Center (EIC) dashboards include (left) visualizations generated by simulations run on the NASA Center for Climate Simulation’s Discover supercomputer and (right) an “Image of the Day” and “Vital Signs” of the planet compiled from NASA and partner agency observations. NASA/Brenda Lopez Silva, Michael Chyatte 5. Using Autonomous Onboard Science Agents for Planetary Exploration Researchers in NASA Goddard’s Distributed Systems Missions initiative are working to enable deep-space missions that are adaptable and can autonomously interpret and respond to newly-collected science data using an onboard software “agent” rather than waiting for new instructions from Earth at each phase of the mission. To test this new, autonomous mission design, they chose Enceladus, an icy ocean moon of Saturn and one of the most promising targets to search for life in our solar system. In a simulated mission scenario, the scientists modeled various trajectories and orbits of eight small spacecraft to produce what would be the first stable constellation around Enceladus to provide global coverage of the moon for collecting science observations. The team deployed their autonomous onboard science agent to analyze simulated data in “real-time.” The agent uses multiple machine learning models to process and interpret the relative amounts of various compounds detected in Europa’s icy plumes – indicators of the possibility of life – autonomously interprets those data, then makes decisions impacting follow-on analysis or prioritized data transmission based on pre-programmed mission goals. With its steady plume of subsurface liquid water jetting out into space, Saturn’s moon Enceladus is a likely candidate for an astrobiology study on a future NASA mission using autonomous spacecraft. In this visualization of that mission, the onboard system (science agent) tracks all eight spacecraft in the constellation (top center window). When the ground track lights up (shows white), the animation in the left window shows a close-up view of the position of that spacecraft. The spacecraft field of view is shown by a green cone (representing a volume of space) and corresponding green rectangle (on the surface). These spacecraft positions could be altered if strongly recommended by the science data results, and these changes can be safely executed autonomously.NASA/Pavel Galchenko, NASA’s Scientific Visualization Studio For more information about supercomputers run by NASA High-End Computing, visit: https://hec.nasa.gov/ For news media: Members of the news media interested in covering this topic should reach out to the NASA Ames newsroom. Authors: Jill Dunbar and Michelle Moyer, NASA’s Ames Research Center, and Jarrett Cohen and Sean Keefe, NASA’s Goddard Space Flight Center
0 notes
Text
MetNet-3: A state-of-the-art neural weather model available in Google products
New Post has been published on https://thedigitalinsider.com/metnet-3-a-state-of-the-art-neural-weather-model-available-in-google-products/
MetNet-3: A state-of-the-art neural weather model available in Google products
Posted by Samier Merchant, Google Research, and Nal Kalchbrenner, Google DeepMind
Forecasting weather variables such as precipitation, temperature, and wind is key to numerous aspects of society, from daily planning and transportation to energy production. As we continue to see more extreme weather events such as floods, droughts, and heat waves, accurate forecasts can be essential to preparing for and mitigating their effects. The first 24 hours into the future are especially important as they are both highly predictable and actionable, which can help people make informed decisions in a timely manner and stay safe.
Today we present a new weather model called MetNet-3, developed by Google Research and Google DeepMind. Building on the earlier MetNet and MetNet-2 models, MetNet-3 provides high resolution predictions up to 24 hours ahead for a larger set of core variables, including precipitation, surface temperature, wind speed and direction, and dew point. MetNet-3 creates a temporally smooth and highly granular forecast, with lead time intervals of 2 minutes and spatial resolutions of 1 to 4 kilometers. MetNet-3 achieves strong performance compared to traditional methods, outperforming the best single- and multi-member physics-based numerical weather prediction (NWP) models — such as High-Resolution Rapid Refresh (HRRR) and ensemble forecast suite (ENS) — for multiple regions up to 24 hours ahead.
Finally, we’ve integrated MetNet-3’s capabilities across various Google products and technologies where weather is relevant. Currently available in the contiguous United States and parts of Europe with a focus on 12 hour precipitation forecasts, MetNet-3 is helping bring accurate and reliable weather information to people in multiple countries and languages.
MetNet-3 precipitation output summarized into actionable forecasts in Google Search on mobile.
Densification of sparse observations
Many recent machine learning weather models use the atmospheric state generated by traditional methods (e.g., data assimilation from NWPs) as the primary starting point to build forecasts. In contrast, a defining feature of the MetNet models has been to use direct observations of the atmosphere for training and evaluation. The advantage of direct observations is that they often have higher fidelity and resolution. However, direct observations come from a large variety of sensors at different altitudes, including weather stations at the surface level and satellites in orbit, and can be of varying degrees of sparsity. For example, precipitation estimates derived from radar such as NOAA’s Multi-Radar/Multi-Sensor System (MRMS) are relatively dense images, whereas weather stations located on the ground that provide measurements for variables such as temperature and wind are mere points spread over a region.
In addition to the data sources used in previous MetNet models, MetNet-3 includes point measurements from weather stations as both inputs and targets with the goal of making a forecast at all locations. To this end, MetNet-3’s key innovation is a technique called densification, which merges the traditional two-step process of data assimilation and simulation found in physics-based models into a single pass through the neural network. The main components of densification are illustrated below. Although the densification technique applies to a specific stream of data individually, the resulting densified forecast benefits from all the other input streams that go into MetNet-3, including topographical, satellite, radar, and NWP analysis features. No NWP forecasts are included in MetNet-3’s default inputs.
A) During training, a fraction of the weather stations are masked out from the input while kept in the target. B) To evaluate generalization to untrained locations, a set of weather stations represented by squares is never used for training and is only used for evaluation. C) Data from these held out weather stations with sparse coverage is included during evaluation to determine prediction quality in these areas. D) The final forecasts use the full set of training weather stations as input and produce fully dense forecasts aided by spatial parameter sharing.
High resolution in space and time
A central advantage of using direct observations is their high spatial and temporal resolution. For example, weather stations and ground radar stations provide measurements every few minutes at specific points and at 1 km resolutions, respectively; this is in stark contrast with the assimilation state from the state-of-the-art model ENS, which is generated every 6 hours at a resolution of 9 km with hour-by-hour forecasts. To handle such a high resolution, MetNet-3 preserves another of the defining features of this series of models, lead time conditioning. The lead time of the forecast in minutes is directly given as input to the neural network. This allows MetNet-3 to efficiently model the high temporal frequency of the observations for intervals as brief as 2 minutes. Densification combined with lead time conditioning and high resolution direct observations produces a fully dense 24 hour forecast with a temporal resolution of 2 minutes, while learning from just 1,000 points from the One Minute Observation (OMO) network of weather stations spread across the United States.
MetNet-3 predicts a marginal multinomial probability distribution for each output variable and each location that provides rich information beyond just the mean. This allows us to compare the probabilistic outputs of MetNet-3 with the outputs of advanced probabilistic ensemble NWP models, including the ensemble forecast ENS from the European Centre for Medium-Range Weather Forecasts and the High Resolution Ensemble Forecast (HREF) from the National Oceanic and Atmospheric Administration of the US. Due to the probabilistic nature of the outputs of both models, we are able to compute scores such as the Continuous Ranked Probability Score (CRPS). The following graphics highlight densification results and illustrate that MetNet’s forecasts are not only of much higher resolution, but are also more accurate when evaluated at the overlapping lead times.
Top: MetNet-3’s forecast of wind speed for each 2 minutes over the future 24 hours with a spatial resolution of 4km. Bottom: ENS’s hourly forecast with a spatial resolution of 18 km.
The two distinct regimes in spatial structure are primarily driven by the presence of the Colorado mountain ranges. Darker corresponds to higher wind speed. More samples available here: 1, 2, 3, 4.
Performance comparison between MetNet-3 and NWP baseline for wind speed based on CRPS (lower is better). In the hyperlocal setting, values of the test weather stations are given as input to the network during evaluation; the results improve further especially in the early lead times.
In contrast to weather station variables, precipitation estimates are more dense as they come from ground radar. MetNet-3’s modeling of precipitation is similar to that of MetNet-1 and 2, but extends the high resolution precipitation forecasts with a 1km spatial granularity to the same 24 hours of lead time as the other variables, as shown in the animation below. MetNet-3’s performance on precipitation achieves a better CRPS value than ENS’s throughout the 24 hour range.
Case study for Thu Jan 17 2019 00:00 UTC showing the probability of instantaneous precipitation rate being above 1 mm/h on CONUS. Darker corresponds to a higher probability value. The maps also show the prediction threshold when optimized towards Critical Success Index CSI (dark blue contours). This specific case study shows the formation of a new large precipitation pattern in the central US; it is not just forecasting of existing patterns.
Top: ENS’s hourly forecast. Center: Ground truth, source NOAA’s MRMS. Bottom: Probability map as predicted by MetNet-3. Native resolution available here.
Performance comparison between MetNet-3 and NWP baseline for instantaneous precipitation rate on CRPS (lower is better).
Delivering realtime ML forecasts
Training and evaluating a weather forecasting model like MetNet-3 on historical data is only a part of the process of delivering ML-powered forecasts to users. There are many considerations when developing a real-time ML system for weather forecasting, such as ingesting real-time input data from multiple distinct sources, running inference, implementing real-time validation of outputs, building insights from the rich output of the model that lead to an intuitive user experience, and serving the results at Google scale — all on a continuous cycle, refreshed every few minutes.
We developed such a real-time system that is capable of producing a precipitation forecast every few minutes for the entire contiguous United States and for 27 countries in Europe for a lead time of up to 12 hours.
Illustration of the process of generating precipitation forecasts using MetNet-3.
The system’s uniqueness stems from its use of near-continuous inference, which allows the model to constantly create full forecasts based on incoming data streams. This mode of inference is different from traditional inference systems, and is necessary due to the distinct characteristics of the incoming data. The model takes in various data sources as input, such as radar, satellite, and numerical weather prediction assimilations. Each of these inputs has a different refresh frequency and spatial and temporal resolution. Some data sources, such as weather observations and radar, have characteristics similar to a continuous stream of data, while others, such as NWP assimilations, are similar to batches of data. The system is able to align all of these data sources spatially and temporally, allowing the model to create an updated understanding of the next 12 hours of precipitation at a very high cadence.
With the above process, the model is able to predict arbitrary discrete probability distributions. We developed novel techniques to transform this dense output space into user-friendly information that enables rich experiences throughout Google products and technologies.
Weather features in Google products
People around the world rely on Google every day to provide helpful, timely, and accurate information about the weather. This information is used for a variety of purposes, such as planning outdoor activities, packing for trips, and staying safe during severe weather events.
The state-of-the-art accuracy, high temporal and spatial resolution, and probabilistic nature of MetNet-3 makes it possible to create unique hyperlocal weather insights. For the contiguous United States and Europe, MetNet-3 is operational and produces real-time 12 hour precipitation forecasts that are now served across Google products and technologies where weather is relevant, such as Search. The rich output from the model is synthesized into actionable information and instantly served to millions of users.
For example, a user who searches for weather information for a precise location from their mobile device will receive highly localized precipitation forecast data, including timeline graphs with granular minute breakdowns depending on the product.
MetNet-3 precipitation output in weather on the Google app on Android (left) and mobile web Search (right).
Conclusion
MetNet-3 is a new deep learning model for weather forecasting that outperforms state-of-the-art physics-based models for 24-hour forecasts of a core set of weather variables. It has the potential to create new possibilities for weather forecasting and to improve the safety and efficiency of many activities, such as transportation, agriculture, and energy production. MetNet-3 is operational and its forecasts are served across several Google products where weather is relevant.
Acknowledgements
Many people were involved in the development of this effort. We would like to especially thank those from Google DeepMind (Di Li, Jeremiah Harmsen, Lasse Espeholt, Marcin Andrychowicz, Zack Ontiveros), Google Research (Aaron Bell, Akib Uddin, Alex Merose, Carla Bromberg, Fred Zyda, Isalo Montacute, Jared Sisk, Jason Hickey, Luke Barrington, Mark Young, Maya Tohidi, Natalie Williams, Pramod Gupta, Shreya Agrawal, Thomas Turnbull, Tom Small, Tyler Russell), and Google Search (Agustin Pesciallo, Bill Myers, Danny Cheresnick, Lior Cohen, Maca Piombi, Maia Diamant, Max Kamenetsky, Maya Ekron, Mor Schlesinger, Neta Gefen-Doron, Nofar Peled Levi, Ofer Lehr, Or Hillel, Rotem Wertman, Vinay Ruelius Shah, Yechie Labai).
#000#Administration#agriculture#Analysis#android#animation#app#Art#atmosphere#Blue#Building#Case Study#Dark#data#Deep Learning#development#direction#effects#efficiency#energy#energy production#Europe#Events#extreme weather#Features#floods#forecast#Fraction#Full#Future
0 notes
Text
Install and Use the NOAA Weather App!
NOAA forecast & radar to your actual region.
This climate app is not affiliated with NOAA or the national weather provider. Merchandise provided with the aid of NOAA are inside the public domain, and this app's use of those merchandise is compliant with NOAA/NWS terms of use.
This app provides forecasts, lively radar, hourly forecast, and modern-day situations, all in an intuitive and clean to apply interface. Just the statistics you want, supplied accurately, fast, and on your actual location.
★ "A no-nonsense approach to expose climate statistics on your cellphone, however executed nicely and splendid searching" - Android central
This app makes use of NOAA point forecasts from your GPS vicinity to get the maximum localized weather to be had. Point forecasts are exceptional for hiking, hiking, snowboarding, or any outside pastime in which weather from a close-by metropolis is not accurate enough.
GPS at the telephone will offer the most accurate region, but usually isn't wished. Nearby cell towers and wi-fi networks can also provide this data, and may be checked first to save time and battery. You may additionally input a area manually.
To provided extraordinarily localized forecasting, this app uses point forecasts from the countrywide weather carrier (NOAA/NWS), and is therefore handiest available in the US.
INSTALL NOW
#app#appinstalltion#freeoffer#install#offerings#offersale#special offers#the united states#usa#usoffers#united states#us#united nations#update#NOAA#Weather#NOAA Weather#NOAA Weather App#InstallandUsetheNOAAWeatherAppus
1 note
·
View note
Text
0 notes
Text
Best Weather Apps for 2023
See at Clime
Clime: NOAA Weather Radar
In-depth weather maps
Show more (1 item)
It’s always a good idea to check the weather before heading out of the door. There’s nothing worse than putting on something nice, only to have it rain later and potentially damage your gear — or get so hot that you sweat right through it.
Mobile weather apps provide easy access to forecasts whenever you need them.…

View On WordPress
0 notes
Text
Tests of the dynamic seeding concept were conducted in Pennsylvania, Arizona, the Caribbean, and southern Florida during the late 1960's.
These tests confirmed the increased growth of the clouds predicted by the numerical cloud models. Subsequently, the effect of dynamic seeding on rainfall in Florida cumulus clouds was investigated by NOAA in two projects in 1968 and 1970. A comparison of radar-measured precipitation from individual seeded and non-seeded clouds showed a 100 to 200 percent increase in precipitation for seeded clouds. The increase was significant at the 5 percent level -- that is, the hypothesis that there is no difference between the seeded and non-seeded clouds could be rejected with the probability of being wrong at most 5 times out of 100 (and the probability of being right at least 95 times out of 100).
The Florida Area Cumulus Experiment (FACE) was organized by NOAA in i970 to determine whether dynamic seeding can be used to augment precipitation from cumulus clouds over an extensive area in south Florida. Exploratory field experiments were conducted during five summers from 1970 through 1976. Results from the FACE experiments suggest that under some conditions dynamic seeding increases rainfall.
Because of the multiplicity of ideas examined and the subjective
influences of those conducting the experiment (a problem discussed
further in section 2 of this chapter) -- conditions typical of all
exploratory experiments -- these conclusions cannot be assigned useful statistical significance levels. For that reason, a confirmatory Florida experiment was initiated in the summer of 1978.
The South Dakota School of Mines and Technology also conducted a
cumulus cloud seeding project for rain enhancement and hail suppression in North Dakota during the summers of 1969 through 1972. The project was randomized by day with silver iodide released into cloud updrafts at the base of the clouds. A recent statistical analysis of this project by the Weather Modification Advisory Board's statistical task force indicates that overall differences in rain for seeded and unseeded days were negligible and not significant. However, they found that when seeded days are separated into days judged suitable and unsuitable for dynamic seeding the mean difference in average rainfall between (suitable) seeded days and unseeded days approaches statistical significance.
1 note
·
View note
Text
A Detailed Guide to Aviation Weather Centre
Marine Weather Forecasting and Air Cargo: Its Importance in the Maritime and Aviation Industries
The marine service industry is vital to the global economy because it transports products and people across the world's oceans. However, the sea's unpredictability, particularly in terms of weather, can cause delays, damage, and even accidents. Because airplanes are subject to weather fluctuations in the air, the aviation industry confronts similar issues. In this article, we will look at the importance of marine weather forecasting in the maritime and aviation industries, as well as how it may increase efficiency, safety, and profitability.
Forecasting Marine Weather for the Maritime Industry
Weather forecasts are heavily used in the marine industry to make educated decisions about vessel routing, speed, and cargo management. To maintain the safe and effective operation of their vessels, shipping companies must evaluate a variety of parameters such as wind speed, wave height, sea currents, and water temperature. They can plan the best route and avoid severe weather conditions that could cause vessel damage or delays with the help of marine weather prediction.
Forecasting maritime weather is also critical for offshore oil and gas activities, fishing, and marine tourism. To protect the safety of its personnel, equipment, and passengers, these sectors require reliable weather information. A unexpected storm or severe wind might endanger the operation, resulting in revenue loss, environmental harm, and even death. As a result, having access to dependable weather data and analysis is critical for making informed judgments.
Various agencies, including the National Oceanic and Atmospheric Administration (NOAA) and the World Meteorological Organization (WMO), provide marine weather forecast services. These agencies collect and analyze data from weather satellites, buoys, ships, and other sources in order to offer the maritime industry with reliable and fast weather information.
Forecasting Marine Weather for the Aviation Industry
Weather forecasts are also used by the aviation sector to ensure the safety of their passengers and crew. Weather variations, such as turbulence, thunderstorms, icing, and limited visibility, can cause aircraft delays, cancellations, or even accidents. As a result, pilots must have access to current weather information in order to plan their route and make informed judgments.
The aviation weather centre (AWC) is a specialist agency that supplies the aviation sector with weather information and forecasts. To provide detailed weather reports for pilots and air traffic controllers, the AWC collects and analyzes data from diverse sources such as weather satellites, radar, and ground-based weather stations. This data contains weather charts, turbulence forecasts, icing forecasts, and thunderstorm outlooks, allowing pilots to plan their flights and avoid potentially hazardous weather situations.
Air Cargo and Marine Weather Forecast
Air cargo is a developing business that relies on air transport's efficiency and dependability to deliver goods around the world. However, air cargo, like any other means of transportation, is susceptible to weather-related interruptions. Weather changes can cause airplane delays, cancellations, and cargo damage. As a result, access to accurate and timely weather information is critical to ensuring the safe and effective operation of air freight.
Marine weather forecasting systems can also help the air cargo business by supplying weather data on airport locations, runway conditions, and wind speeds. This data can assist cargo carriers in flight planning, reducing fuel usage, and avoiding cargo damage. Furthermore, marine weather forecast services can provide data on water and air temperature, which is important when carrying perishable items like fruits, vegetables, and pharmaceuticals.
Conclusion
The marine weather prediction is an important tool in the safe and effective functioning of the maritime and aviation industries.
0 notes
Text
Davie, Florida Weather Forecast and Real-Time Conditions
The weather in Davie, Florida is a key factor when planning your trip. You can find out about the current conditions and forecast for Davie, FL by visiting this page. You'll also get a detailed five day weather forecast and information on where to stay if you need help making arrangements.

Hourly Weather Forecast and Conditions
The current temperature in Davie is 78 degrees and the weather conditions are clear. The forecast for the next hour is a chance of showers with a high of 79. The forecast for tomorrow is partly cloudy with a high of 85, low of 74 and winds from S at 6 mph.
The last 7 days have been warm with temperatures between 78-86F (26-30C).
7-Day Weather Forecast and Conditions
Here's a 7-day forecast of the weather in Davie, Florida.
Temperature: The average high temperature for this time of year is 85 degrees Fahrenheit (29 degrees Celsius). The average low temperature is 71 F (22 C).
Humidity: The humidity can reach up to 80 percent at times, which can make it feel warmer than it actually is.
Wind speed and direction: Winds are generally light in Davie, with an average wind speed between 3 and 6 mph (6-10 km/h). Wind speeds tend to pick up during storms or cold fronts though so don't be surprised if you notice some changes!
Chance of precipitation: There's no chance of rain today but there will be tomorrow--so bring your umbrella! There might also be some scattered showers over the next few days but nothing major yet...just keep checking back here for updates on any severe thunderstorms that might affect us before heading outside!
Detailed 5-Day Weather Forecasts
The weather forecast data for Davie, Florida is collected from a variety of sources including NOAA, US Air Force and US Navy. We also use the most advanced forecast models available from the National Weather Service (NWS), European Center for Medium-Range Weather Forelasts (ECMWF) and other sources. The data is then analyzed using complex mathematical equations which results in our accurate 5-day forecasts for Davie, Florida.
Davie, FL Interactive Maps
The Davie, FL interactive weather map allows you to pan and zoom to get a closer look at the weather in your area. You can also switch between different layers to see what's going on around the country or even the world. The radar layer shows last hour precipitation accumulation, so you can see where rain or snow has fallen in the past 60 minutes. The satellite layer is useful if you want to see cloud cover over your town or city in real-time!

BlckPanda Creative is a website design company located in Davie, Florida. Our team is dedicated to creating beautiful, functional websites that are both responsive and mobile-friendly. We specialize in responsive web design Davie, ecommerce websites, and web development.
BlckPanda Creative
4001 SW 47th Ave #202, Davie, FL 33314
954-684-9594
https://blckpanda.com/
0 notes
Photo
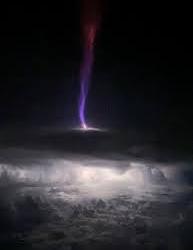
3D study of “Gigantic Jet” provides new insights into upward lightning bursts Peer-Reviewed Publication GEORGIA INSTITUTE OF TECHNOLOGY A detailed 3D study of a massive electrical discharge that rose 50 miles into space above an Oklahoma thunderstorm has provided new information about an elusive atmospheric phenomenon known as gigantic jets. The Oklahoma discharge was the most powerful gigantic jet studied so far, carrying 100 times as much electrical charge as a typical thunderstorm lightning bolt. The gigantic jet moved an estimated 300 coulombs of electrical charge into the ionosphere – the lower edge of space – from the thunderstorm. Typical lightning bolts carry less than five coulombs between the cloud and ground, or within clouds. The upward discharge included relatively cool (approximately 400 degrees Fahrenheit) streamers of plasma, as well as structures called leaders that are very hot – more than 8,000 degrees Fahrenheit. “We were able to map this gigantic jet in three dimensions with really high-quality data,” said Levi Boggs, a research scientist at the Georgia Tech Research Institute (GTRI) and the paper’s corresponding author. “We were able to see very high frequency (VHF) sources above the cloud top, which had not been seen before with this level of detail. Using satellite and radar data, we were able to learn where the very hot leader portion of the discharge was located above the cloud.” Boggs worked with a multi-organization research team, including the Universities Space Research Association (USRA), Texas Tech University, the University of New Hampshire, Politecnica de Catalunya, Duke University, the University of Oklahoma, NOAA’s National Severe Storms Laboratory, and the Los Alamos National Laboratory. The research was reported Aug. 3 in Science Advances, a peer-reviewed, multidisciplinary, open-access scientific journal. Steve Cummer, professor of electrical and computer engineering at Duke, uses the electromagnetic waves that lightning emits to study the powerful phenomenon. He operates a research site where sensors resembling conventional antennas are arrayed in an otherwise empty field, waiting to pick up signals from locally occurring storms. “The VHF and optical signals definitively confirmed what researchers had suspected but not yet proven: that the VHF radio from lightning is emitted by small structures called streamers that are at the very tip of the developing lightning, while the strongest electric current flows significantly behind this tip in an electrically conducting channel called a leader,” Cummer said. Doug Mach, a co-author of the paper at the Universities Space Research Association (USRA), said the study was unique in determining that the 3D locations for the lightning’s optical emissions were well above the cloud tops. “The fact that the gigantic jet was detected by several systems, including the Lightning Mapping Array and two geostationary optical lightning instruments, was a unique event and gives us a lot more information on gigantic jets,” Mach said. “More importantly, this is probably the first time that a gigantic jet has been three-dimensionally mapped above the clouds with the Geostationary Lightning Mapper (GLM) instrument set.” Gigantic jets have been observed and studied over the past two decades, but because there’s no specific observing system to look for them, detections have been rare. Boggs learned about the Oklahoma event from a colleague, who told him about a gigantic jet that had been photographed by a citizen-scientist who had a low-light camera in operation on May 14, 2018. Fortuitously, the event took place in a location with a nearby VHF lightning mapping system, within range of two Next Generation Weather Radar (NEXRAD) locations and accessible to instruments on satellites from NOAA’s Geostationary Operational Environmental Satellite (GOES) network. Boggs determined that the data from those systems was available and worked with colleagues to bring it together for analysis. “The detailed data showed that those cold streamers start their propagation right above the cloud top,” Boggs explained. “They propagate all the way to the lower ionosphere to an altitude of 50-60 miles, making a direct electrical connection between the cloud top and the lower ionosphere, which is the lower edge of space.” That connection transfers thousands of amperes of current in about a second. The upward discharge transferred negative charge from the cloud to the ionosphere, typical of gigantic jets. The data showed that as the discharge ascended from the cloud top, VHF radio sources were detected at altitudes of 22 to 45 kilometers (13 to 28 miles), while optical emissions from the lightning leaders remained near the cloud top at an altitude of 15 to 20 kilometers (9 to 12 miles). The simultaneous 3D radio and optical data indicate that VHF lightning networks detect emissions from streamer corona rather than the leader channel, which has broad implications to lightning physics beyond that of gigantic jets. Why do the gigantic jets shoot charge into space? Researchers speculate that something may be blocking the flow of charge downward – or toward other clouds. Records of the Oklahoma event show little lightning activity from the storm before it fired the record gigantic jet. “For whatever reason, there is usually a suppression of cloud-to-ground discharges,” Boggs said. “There is a buildup of negative charge, and then we think that the conditions in the storm top weaken the uppermost charge layer, which is usually positive. In the absence of the lightning discharges we normally see, the gigantic jet may relieve the buildup of excess negative charge in the cloud.” For now, there are a lot of unanswered questions about gigantic jets, which are part of a class of mysterious transient luminous events. That’s because observations of them are rare and happen by chance – from pilots or aircraft passengers happening to see them or ground observers operating night-scanning cameras. Estimates for the frequency of gigantic jets range from 1,000 per year up to 50,000 per year. They’ve been reported more often in tropical regions of the globe. However, the Oklahoma gigantic jet – which was twice as powerful as the next strongest one – wasn’t part of a tropical storm system. Beyond their novelty, gigantic jets could have an impact on the operation of satellites in low-earth orbit, Boggs said. As more of those space vehicles are launched, signal degradation and performance issues could become more significant. The gigantic jets could also affect technologies such as over-the-horizon radars that bounce radio waves off the ionosphere. Boggs is affiliated with the Severe Storms Research Center, which was established at GTRI to develop improved technologies for warning of severe storms, such as tornadoes, that are common in Georgia. The work on gigantic jets and other atmospheric phenomena is part of that effort.
8 notes
·
View notes
Last Seen Blogs

juandif1-blog
Juandif

fnfattire-blog
UFresh & Fit Attire

parkwithme
Untitled

milestonengo
MILESTONE NGO

just-an-enby-lemon
Still Not Cool, but Now With Flair