#Nomogram
Explore tagged Tumblr posts
Visit Tumblr Blog
Explore Tumblr blogs with no restrictions, modern design and the best experience.
Last Seen Tumblr Blogs


Fun Fact
Tumblr was acquired by Yahoo for $1.1B in 2013.
Text
youtube
#Hepatocellular carcinoma#liver cancer#early recurrence#surgical oncology#predictive model#nomogram#narrow resection margin#tumor size#alpha-fetoprotein#liver function#microvascular invasion#personalized medicine#HCC prognosis#adjuvant therapy#cancer biomarkers#precision oncology#cancer surveillance#liver surgery#oncology tools#cancer recurrence.#Youtube
0 notes

Text
Kalıp Kumu Kalitesi Nasıl Belirlenir?

Kalıp kumu kalitesi için önceden verilen parametreler içinde tutabilmek ve homojen bir yapı sağlayabilmek önemlidir. Bu amaçla uygulanan iki yöntem vardır.
Kalıp kumu kalitesi için birinci yöntem;
üretim verilerini esas alarak , bir sonraki üretim aşamasında önlem alabilecek ayar tekniğini yerleştirmektir. Bu yöntem laboratuar verilerinden bağımsız olarak yapılmalıdır.
Kalıp kumu kalitesi için ikinci yöntem;
kalıp kumu geri dönüş sistemine yerleştirilen test teknikleri vasıtası ile, test sonuçlarını değerlendirerek bir sonraki döngüde aynı anda düzeltme yapmaktır. 1)Konvansiyonel Test Metodları ile Üretilen Kalıp Kumunun Özellikleri Mukavemet, sıkıştırılabilirlik gibi ulaşılabilmesi gerekli değerler, belirli bir süre zarfında ölçülür ve olması gereken yani istenen değerler ile karşılaştırması yapılır. Bulunan sapmalar, birbirine bağlı veya birbirini tamamlayan sıkıştırılabilirlik ile su miktarı gibi parametrelerin düzeltilmesi ile giderilir. 2)Otomatik Ölçüm ile Elde Edilen Değerler Sayesinde Kalıp Kumu Hazırlama Otomasyonu Kalite beklentilerinin artışı, kalıp kumunun özelliklerinin sürekli sabit kalmasını gerektirir. Kum döngü sistemindeki değişimlere ani müdahale edilmesi gerekir ki; - otomatik ölçümleme, - ölçülen değerlerin toplanması, - çabuk bir şekilde değerlendirilmesi - gerekli dozajlama sinyallerinin bilgisayara gönderilmesi gerekir. Ölçüm ve otomasyon sistemlerinin zamanla gelişmesi ile birlikte bu yöntem pratikte daha çok kullanılır hale gelmiştir. Bu otomatik ölçüm ve dozajlama sistemi ile - Ya direkt olarak eski kum nemi gibi kumun bileşimindeki değişiklikler - Ya da kalıp kumu özelliklerindeki indirekt yani dolaylı değişiklikler tespit edilir ve gerekli dozajlama işlemi yapılır. Kumun içerisinde ki su miktarı ile kum sıcaklığı, kumun döngü sistemi içinde olağanüstü değişebilecek faktörlerdir. 3)Hata Önleyici Kalıp Kumu Hazırlama Kumanda Sistemi Bu yöntem kumanda operasyonları uygulamasına dayanan bir yöntemdir. Kum- metal oranına bağlı olarak, kalıp kumunun termik yüklenmesi ve olası maça kumu girişi ile sistemi bozabilecek diğer faktörlerin kullanılması esasına dayanır. Kalıp kumu hareketlerindeki değişimlerin de tespiti de bu yöntemin içerisindedir. Tespit NOMOGRAM adı verilen kumanda şeması ve logaritmik işlemler sayesinde mikro bilgisayar üzerinden ulaştırılır. Bu nomogramlar ilave edilen bentonitin yanan kısmının ve diğer ilave komponentlerin kayıp miktarının bilinmesi sayesinde , kumun teknolojik olarak tespit edilen ve öngörülen özellik seviyesini gösterir. Böylelikle bentonit, kömür tozu ve yeni kum ilave miktarları hesaplanabilir. ÖLÇÜLEN DEĞERLERİN TOPLANMASI Su miktarı Aktif kil miktarı Çamur miktarı Sıkıştırılabilirlik Mukavemet Gaz Geçirgenlik Test Parçası Kütlesi GİRİŞ PC KUMANDA SU MİKTARINI DÜŞÜR YENİ KUM MİKTARINI YÜKSELT / AZALT (kg/şarj) KUM-METAL ORANININ DEĞİŞİMİNDE REÇETE NUMARASININ AYARI Kum-Metal Oranı 4,10 5,10 7,10 Yeni kum (kg/şarj) 75,00 60,00 50,00 Bentonit (kg /şarj) 14,00 11,00 8,00 Kaynak: Albayrak, Ömer Yücel. Bentonit Bağlayıcılı Kalıp Kumu Özelliklerinin Pratikteki Anlamları. Read the full article
0 notes
Text
Only managed one thing instead of 3 but I'm exhausted. Gonna go lay in bed and play nomograms til I pass out
1 note
·
View note
Text
Global Kernicterus Treatment Market Analysis 2024: Size Forecast and Growth Prospects
The kernicterus treatment global market report 2024 from The Business Research Company provides comprehensive market statistics, including global market size, regional shares, competitor market share, detailed segments, trends, and opportunities. This report offers an in-depth analysis of current and future industry scenarios, delivering a complete perspective for thriving in the industrial automation software market.
Kernicterus Treatment Market, 2024 report by The Business Research Company offers comprehensive insights into the current state of the market and highlights future growth opportunities.
Market Size - The kernicterus treatment market size has grown steadily in recent years. It will grow from $2.88 billion in 2023 to $2.98 billion in 2024 at a compound annual growth rate (CAGR) of 3.4%. The growth in the historic period can be attributed to improvements in neonatal care practices, increased awareness among healthcare professionals, government initiatives for maternal and child health, research funding and clinical trials, collaborations in medical research..
The kernicterus treatment market size is expected to see steady growth in the next few years. It will grow to $3.29 billion in 2028 at a compound annual growth rate (CAGR) of 2.6%. The growth in the forecast period can be attributed to continuous medical education programs, global health policies and initiatives, patient advocacy and support groups, international collaboration in pediatric research, government funding for neonatal health.. Major trends in the forecast period include advancements in neonatal jaundice monitoring technologies, introduction of phototherapy devices with enhanced features, development of bilirubin-reducing medications, focus on home-based phototherapy solutions, implementation of bilirubin nomograms and guidelines, integration of telehealth for remote monitoring..
Order your report now for swift delivery @ https://www.thebusinessresearchcompany.com/report/kernicterus-treatment-global-market-report
Scope Of Kernicterus Treatment Market The Business Research Company's reports encompass a wide range of information, including:
1. Market Size (Historic and Forecast): Analysis of the market's historical performance and projections for future growth.
2. Drivers: Examination of the key factors propelling market growth.
3. Trends: Identification of emerging trends and patterns shaping the market landscape.
4. Key Segments: Breakdown of the market into its primary segments and their respective performance.
5. Focus Regions and Geographies: Insight into the most critical regions and geographical areas influencing the market.
6. Macro Economic Factors: Assessment of broader economic elements impacting the market.
Kernicterus Treatment Market Overview
Market Drivers - The prevalence of neonatal jaundice is driving the growth of the kernicterus treatment market going forward. Neonatal jaundice, also known simply as jaundice in newborns, is a common and typically harmless condition characterized by the yellowing of a baby's skin and the whites of their eyes. Kernicterus treatment is commonly used for neonatal jaundice; it manages the symptoms and provides supportive care. This procedure removes blood from the baby and replaces it with blood with a lower bilirubin level, improving the affected child's quality of life. For instance, in August 2023, according to reports published by the National Library of Medicine, a US-based biomedical library, globally, about 1.1 million babies each year develop severe neonatal hyperbilirubinemia (neonatal jaundice). Furthermore, in February 2021, according to ClinMed International Library, a US-based publishing company, it was estimated that at least 114,000 infants die yearly from neonatal hyperbilirubinemia (neonatal jaundice). Therefore, the prevalence of neonatal jaundice is expected to propel the growth of the kernicterus treatment market.
Market Trends - Major institutes operating in the kernicterus treatment market are developing innovative technological products, such as wearable devices to monitor jaundice accurately, that help gain a competitive advantage. A wearable device is a small, flexible patch placed on the body according to the treatment requirement. For instance, in March 2021, Yokohama National University, a Japan-based university, designed the first-ever wearable device to accurately monitor jaundice, a yellowing of the skin due to increased bilirubin levels in the blood that can result in severe medical conditions in infants. This wearable sensor for infants can constantly measure bilirubin to achieve the intricate balance of administering the accurate amount of blue light required to neutralize the correct bilirubin levels. Moreover, it is a small, flexible patch that is placed on the infant's chest, and it transmits data to a smartphone or computer, where doctors or parents can monitor it. Also, it is more accurate and convenient than traditional methods of monitoring jaundice, such as blood tests.
The kernicterus treatment market covered in this report is segmented –
1) By Treatment: Phototherapy, Intravenous Immunoglobulins (IVIG), Blood Transfusion, Medication, Other Treatments 2) By Symptoms: Jaundice, Unusual Eye Movements, Vomiting, Fever, Poor Feeding, Apnoea, Irritability, Seizures, Sleepiness, Other Symptoms 3) By Dosage: Injection, Solution, Other Dosages 4) By End-Users: Clinic, Hospital, Other End-Users
Get an inside scoop of the kernicterus treatment market, Request now for Sample Report @ https://www.thebusinessresearchcompany.com/sample.aspx?id=13470&type=smp
Regional Insights - North America was the largest region in the kernicterus treatment market in 2023. The regions covered in the kernicterus treatment market report are Asia-Pacific, Western Europe, Eastern Europe, North America, South America, Middle East, Africa.
Key Companies - Major companies operating in the kernicterus treatment market report are Pfizer Inc., F. Hoffmann-La Roche Ltd , Merck and Co. Inc., AbbVie Inc., Bayer AG, Novartis AG, AstraZeneca plc., Abbott Laboratories, Sanofi SA, GlaxoSmithKline plc, Takeda Pharmaceutical Company Limited, Johnson and Johnson Private Limited, Baxter International Inc., Grifols S.A, Sun Pharmaceutical Industries Ltd., Dr. Reddy's Laboratories Ltd., Alembic Pharmaceuticals Limited, Lupin Pharmaceuticals Inc., CSL Limited, Glenmark Pharmaceuticals Ltd., Cipla Inc., Torrent Pharmaceuticals Ltd., Octapharma Brasil Ltda, Kedrion S.p.A, Biotest AG, Wockhardt Ltd., Mylan N.V., Cadila Healthcare Ltd., Teva Pharmaceutical Industries Ltd., China Biologic Products Holdings Inc.
Table of Contents 1. Executive Summary 2. Kernicterus Treatment Market Report Structure 3. Kernicterus Treatment Market Trends And Strategies 4. Kernicterus Treatment Market – Macro Economic Scenario 5. Kernicterus Treatment Market Size And Growth ….. 27. Kernicterus Treatment Market Competitor Landscape And Company Profiles 28. Key Mergers And Acquisitions 29. Future Outlook and Potential Analysis 30. Appendix
Contact Us: The Business Research Company Europe: +44 207 1930 708 Asia: +91 88972 63534 Americas: +1 315 623 0293 Email: [email protected]
Follow Us On: LinkedIn: https://in.linkedin.com/company/the-business-research-company Twitter: https://twitter.com/tbrc_info Facebook: https://www.facebook.com/TheBusinessResearchCompany YouTube: https://www.youtube.com/channel/UC24_fI0rV8cR5DxlCpgmyFQ Blog: https://blog.tbrc.info/ Healthcare Blog: https://healthcareresearchreports.com/ Global Market Model: https://www.thebusinessresearchcompany.com/global-market-model
0 notes
Text
Acetaminophen Level Test: Importance and Procedure
Procedure and Methods for Acetaminophen Level Test
Purpose of the Test: The acetaminophen level test is designed to measure the amount of acetaminophen (paracetamol) in the blood. This test is vital for diagnosing acetaminophen overdose, which can lead to serious liver damage if not detected and treated promptly.
Procedure
Preparation:
No specific preparation is required for the test.
Patients should inform their healthcare provider of any medications they have taken, especially acetaminophen.
Blood Sample Collection:
Timing of the Test:The test is typically conducted 4 hours after acetaminophen ingestion to ensure accurate measurement. This is when acetaminophen reaches peak levels in the bloodstream.
Venipuncture:A healthcare professional will draw a blood sample from a vein, usually in the arm, using a sterile needle. A small amount of blood (around 2–5 mL) is collected into a tube for analysis.
Labeling and Handling:The sample is carefully labeled with the patient’s information and sent to a laboratory for testing. Proper handling is crucial to ensure sample integrity.
Methods for Testing Acetaminophen Levels
The most common methods used in the laboratory to measure acetaminophen levels are:
Immunoassay Testing:
Description:Immunoassay is one of the most widely used techniques for measuring acetaminophen. It uses antibodies to bind with acetaminophen in the blood, allowing for detection.
Advantages:
Quick results (often within an hour).
Highly sensitive and specific.
Process:Blood samples are processed by an automated system that detects the reaction between acetaminophen and antibodies, giving a quantitative result.
High-Performance Liquid Chromatography (HPLC):
Description:HPLC is a more precise method that separates and measures acetaminophen in the blood. It’s often used in complex cases.
Advantages:
Very accurate and can detect even small amounts of acetaminophen.
Can differentiate acetaminophen from other substances.
Process:Blood is passed through a column that separates acetaminophen from other components. A detector measures the concentration of the drug.
Gas Chromatography-Mass Spectrometry (GC-MS):
Description:GC-MS is an advanced technique combining gas chromatography to separate compounds and mass spectrometry to measure acetaminophen.
Advantages:
Extremely accurate and can detect low concentrations of acetaminophen.
Used in forensic and complex medical cases.
Process: Acetaminophen molecules in blood are identified and quantified by measuring their mass-to-charge ratios in a mass spectrometer after the blood has been vaporized and separated in a gas chromatograph.
Interpreting the Results:
Normal Levels:In therapeutic doses, acetaminophen levels should remain below toxic thresholds.
Toxic Levels:A blood concentration of 150–200 mcg/mL or higher at 4 hours post-ingestion indicates potential toxicity and the risk of liver damage.
Using the Rumack-Matthew Nomogram: The test results are interpreted using a nomogram. This nomogram estimates the risk of liver injury based on acetaminophen levels. It also takes into account the time since ingestion.
Follow-Up and Treatment:
If toxic levels are detected, administer N-acetylcysteine (NAC) to prevent liver damage.
Frequent checks of liver function tests such as ALT and AST are essential for evaluating any liver harm resulting from an overdose.
Conclusion
The acetaminophen level test is a crucial diagnostic tool, especially in cases of suspected overdose. By measuring the concentration of acetaminophen in the blood, healthcare providers can determine the risk of liver damage and administer life-saving treatment promptly. Methods like immunoassay, HPLC, and GC-MS ensure accurate and timely results, enabling effective management of acetaminophen toxicity. Early detection through this test is key to preventing long-term complications and ensuring patient safety.
0 notes
Text
Biomedicines, Vol. 12, Pages 1981: Abnormally High Expression of DNAJB6 Accelerates Malignant Progression of Lung Adenocarcinoma
DNAJB6, a major member of the DNAJ/HSP40 family, plays an important role in tumor development. We explored the effect of DNAJB6 expression on the prognosis of patients and its biological role in lung adenocarcinoma (LUAD). #mRNA and clinical data were obtained from The #cancer Genome Atlas (TCGA). Enriched pathways were determined by the Gene Ontology (GO) and Kyoto Encyclopedia of Genes and Genomes (KEGG) analyses. A nomogram incorporating DNAJB6 and three clinical features was constructed to predict the survival rate. DNAJB6 expression and function in LUAD were explored using immunohistochemistry, Western blotting, proliferation, cell cycle analysis, #RNA sequencing, and xenograft tumor assays. DNAJB6 #mRNA levels were elevated in the LUAD-TCGA dataset. DNAJB6 protein levels were higher in LUAD tumor tissues than in normal tissues. A high DNAJB6 level was an independent risk factor for poor prognosis in patients with LUAD. The proportion of tumor-infiltrating immune cells significantly differed between high and low DNAJB6 expression. DNAJB6 was associated with cell cycle pathways; therefore, its knockdown induced G2/M cell cycle arrest and inhibited LUAD cell proliferation. This is the first report of the DNAJB6 requirement for LUAD cell proliferation and its potentially crucial role in LUAD prognosis. https://www.mdpi.com/2227-9059/12/9/1981?utm_source=dlvr.it&utm_medium=tumblr
0 notes
Text
A new prediction nomogram of non-sentinel lymph node metastasis in cT1-2 breast cancer patients with positive sentinel lymph nodes
http://dlvr.it/T64H01
0 notes
Text
Optimal BPM Range for Exercise and Heart Health: Finding the Sweet Spot

Finding the optimal BPM (beats per minute) range for exercise and heart health involves understanding how different heart rate zones affect your workout intensity and cardiovascular fitness. Here's how to find the sweet spot:
Calculate Your Maximum Heart Rate (MHR): A common method to estimate your maximum heart rate is to subtract your age from 220. However, this formula provides a rough estimate, and individual variability exists. For a more accurate calculation, consider using methods like the Tanaka formula (208 - 0.7 × age) or the Astrand-Ryhming nomogram.
Determine Your Target Heart Rate Zones: Once you have your MHR, you can calculate target heart rate zones based on percentages of your maximum heart rate. These zones indicate different levels of exercise intensity:
Resting Heart Rate (RHR): This is your heart rate at rest, typically measured upon waking up in the morning. It's an essential baseline for tracking changes in heart rate over time.
Moderate Intensity Zone: 50-69% of MHR. This zone is ideal for low to moderate-intensity exercise, such as brisk walking or light jogging, and promotes aerobic endurance and fat burning.
Fat-Burning Zone: 70-84% of MHR. This zone is often associated with the highest fat utilization during exercise and is suitable for improving cardiovascular fitness and burning calories.
Anaerobic Threshold Zone: 85-100% of MHR. This zone represents high-intensity exercise, such as sprinting or interval training, and improves anaerobic capacity and speed.
Select the Appropriate BPM Range: Once you've determined your target heart rate zones, you can use BPM to guide your exercise intensity. Different BPM ranges correspond to each zone, allowing you to adjust your workout tempo accordingly. For example:
Moderate Intensity Zone: 90-125 BPM (for a 30-year-old with an MHR of 190)
Fat-Burning Zone: 133-159 BPM
Anaerobic Threshold Zone: 161-190 BPM
Listen to Your Body: While heart rate monitoring provides valuable feedback, it's essential to listen to your body and adjust your intensity based on how you feel. Factors such as fatigue, hydration, temperature, and overall health can influence your heart rate response to exercise.
Consult with a Healthcare Professional: If you have any underlying health conditions or concerns about exercising within certain heart rate zones, it's advisable to consult with a healthcare professional or certified fitness trainer for personalized guidance and recommendations.
0 notes
Text
Researchers create machine learning model predicting long-term vision in high myopia patients, a top cause of irreversible blindness

- By Nuadox Crew -
In a study conducted by Tokyo Medical and Dental University (TMDU) researchers, a machine-learning model has been devised to foresee the future visual outcomes of individuals grappling with severe shortsightedness, scientifically termed high myopia.
This model aims to predict whether these individuals will experience positive or negative vision changes down the line.
High myopia, a condition characterized by the inability to focus on distant objects while maintaining clarity in close-range vision, poses a significant risk of irreversible blindness, making it a pressing global health concern. The research, recently featured in JAMA Ophthalmology, sought to harness the power of machine learning to forecast the likelihood of visual impairment over extended periods.
By scrutinizing data collected from nearly a thousand patients at Tokyo Medical and Dental University's Advanced Clinical Center for Myopia, the team embarked on a comprehensive analysis. They meticulously evaluated 34 key variables routinely recorded during ophthalmic examinations, encompassing factors like age, current visual acuity, and corneal diameter. Employing various machine-learning algorithms, including random forests and support vector machines, the researchers discovered that a logistic regression-based model exhibited the highest efficacy in predicting visual impairment at 3- and 5-year intervals.
Yet, the study didn't stop at predictive accuracy. Recognizing the importance of translating complex data into practical clinical insights, the researchers ingeniously crafted a nomogram. This graphical representation of the model's outcomes serves as a user-friendly tool for both clinicians and patients. Each variable's significance in predicting future visual acuity is visually depicted as a line, convertible into points that collectively signify the risk of impending visual impairment.
The implications of this research extend beyond its technical achievements. For individuals facing the dire consequences of vision loss, both financially and physically, this advancement could offer a beacon of hope. The global economic impact of severe visual impairment was estimated at a staggering USD 94.5 billion in 2019.
While further validation on a larger scale remains imperative, this study underscores the potential of machine-learning models in combating the escalating public health challenge posed by high myopia-induced sight loss.
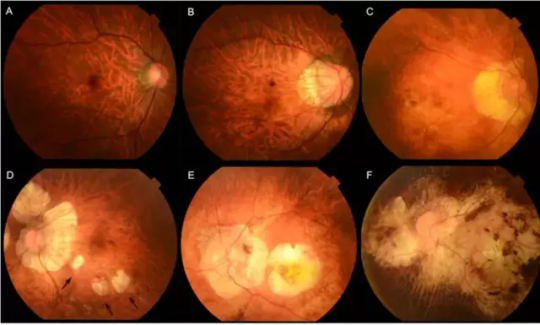
Image: Myopic maculopathy, also referred to as myopic macular degeneration, stands as a prominent characteristic of pathologic myopia. Within the META-PM classification system, myopic maculopathy lesions are grouped into five categories: from no myopic retinal lesions (category 0) to macular atrophy (category 4), including tessellated fundus (category 1, Figure 1A), diffuse chorioretinal atrophy (category 2, Figure 1B&C), patchy chorioretinal atrophy (category 3, Figure 1D arrows), and macular atrophy (category 4, Figure 1E&F). Credit: Tokyo Medical and Dental University.
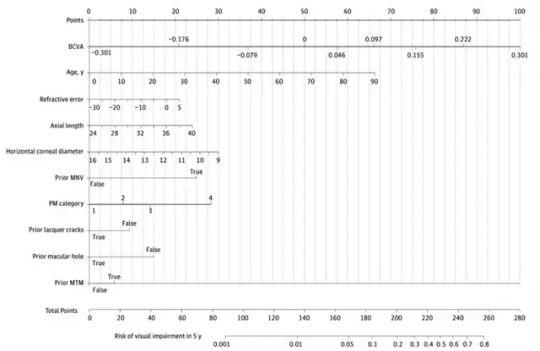
Image: A visual representation, known as a nomogram, was built to depict the model's insights. Longer lines indicate stronger variable impact on visual impairment (VI) after 5 years. Each variable corresponds to points, tallying up to calculate total points and the associated risk of VI. Credit: Tokyo Medical and Dental University.
--
Source: Tokyo Medical and Dental University (TMDU)
Full study: Wang Y, Du R, Xie S, et al. Machine Learning Models for Predicting Long-Term Visual Acuity in Highly Myopic Eyes. JAMA Ophthalmol. Published online October 26, 2023. doi:10.1001/jamaophthalmol.2023.4786
Read Also
New AI could predict whether or not those at high risk will develop glaucoma
#medtech#ophthalmology#eye#eyes#blindness#ai#artificial intelligence#diagnostics#health#medicine#health tech#machine learning
0 notes
Text
What Is A Nomogram In The Medical World?
Physicians will often use nomograms to get accurate estimations of factors like blood pressure, cardiac output, oxygen saturation levels, and temperature. A nomogram is the graphical representation or diagram of data in two axes (usual y-axis on the left side and x-axis on the bottom) which shows trends of variation over time. The graphical representation of these relationships is done by plotted points with specific coordinates that represent value pairs at given instances in time. A nomogram often consists of three variables (independent variable, parameter or constant; dependent variable; conversion factor), which give functional relations between two variables that are parallel to each other.
#blood pressure#cardiac output#oxygen saturation levels#temperature#age#height#weight#number of pregnancies
0 notes
Text
https://www.secondmedic.com/blogs/what-is-a-nomogram-in-the-medical-world
0 notes
Text
Spinster homolog 2 reduces malignancies of glioblastoma via PTEN/PI3K/AKT pathway
The molecular mechanisms of glioblastoma (GBM) are unclear, and the prognosis is poor. Spinster homolog 2 (SPNS2) is reportedly involved in pathological processes such as immune response, vascular development, and cancer. However, the biological function and molecular role of SPNS2 in GBM are unclear. SPNS2 is aberrantly low expressed in glioma. Survival curves, risk scores, prognostic nomograms, and univariate and multifactorial Cox regression analyses showed that SPNS2 is an independent... http://dlvr.it/SwPB3P
0 notes
Text
Cam Design and Manufacture, 2nd Edition PDF by Preben W Jensen
Cam Design and Manufacture, Second Edition By Preben W. Jensen Contents: Preface 111 Using the Cam Design Software Vil Nomenclature IX List of Nomograms XIII 1. Cam and Follower Systems 1 2. Displacement Diagrams 8 3. Displacement Diagram Synthesis 31 4. Cam Profile Determination 46 5. Pressure Angle and Radius of Curvature 75 6. Circular Cams 106 7. Circular-arc and Straight-line Cams 126 8.…

View On WordPress
0 notes
Text
Hyperbilirubinemia Risk Nomogram Calculator
Newborn hyperbilirubinemia assessment calculator is a tool for every pediatrician and concerned parent. Just fill in the few fields to see if the baby's bilirubin level is within the normal range and discover if they are at risk of developing a dangerously high level of bilirubin.
0 notes