#OpenTrace
Explore tagged Tumblr posts
Visit Tumblr Blog
Explore Tumblr blogs with no restrictions, modern design and the best experience.
Last Seen Tumblr Blogs


Fun Fact
In 2020, 27% of US Tumblr users had an annual household income of over $100,000.
Text
Jaeger Integration with Spring Cloud

In today’s complex landscape of highly distributed microservices, monitoring, and tracing are essential tools for understanding application performance and effectively diagnosing issues. Distributed tracing allows us to track requests as they traverse multiple services, providing valuable insights into potential bottlenecks and latency problems. In this blog post, we will explore the process of setting up distributed tracing in a Spring Boot application, utilizing OpenTelemetry and Jaeger.
Understanding Distributed Tracing
Distributed tracing is a technique that helps developers and operators track requests as they move across various microservices or components of an application. It provides end-to-end visibility into the path a request takes and the time it spends in each service. With this information, you can:
Identify bottlenecks: Find out which parts of your application are causing delays or performance issues.
Optimize performance: Analyze the trace data to identify opportunities for optimizing the performance of your application.
Troubleshoot errors: Quickly pinpoint the source of errors or exceptions in your system, making debugging much easier.
Introducing OpenTelemetry and Jaeger
OpenTelemetry (OTel) is indeed an open-source project that offers a set of APIs, libraries, agents, and instrumentation to help you gain observability into your applications by collecting distributed traces, metrics, and logs. OpenTelemetry is designed to be vendor-neutral and can integrate with a range of tracing systems.
Jaeger is a popular open-source distributed tracing system that can act as a backend for collecting, storing, and visualizing trace data generated by applications instrumented with OpenTelemetry.
Together, OpenTelemetry and Jaeger can be used to collect, analyze, and visualize observability data from distributed systems, providing insights into system performance and helping to troubleshoot issues.
Setting Up OpenTelemetry and Jaeger in Spring Boot
Creating an application
Let’s go to https://start.spring.io and create an application with the following dependencies.
Spring Web (required to create REST endpoints)
Spring Boot Actuator
The traces will be collected using the micrometer collector in the actuator dependence and exported using the OpenTelemetry requirement.
This would necessitate the addition of the following dependencies.
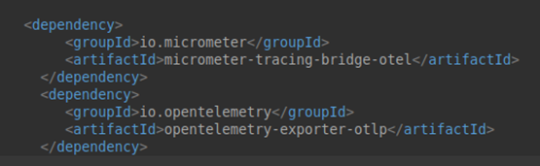
The Spring Boot parent will handle the dependency versions.
Following that, we will develop two applications.
To export the spans to Jaeger, we must first develop a span exporter bean, as seen below.
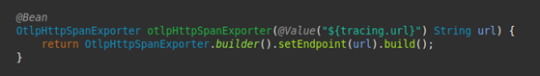
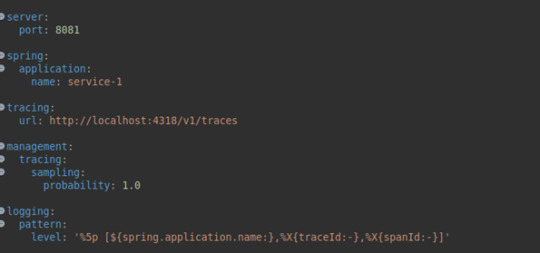
In addition, we will define the Jaeger URL where trace data will be recorded in the properties file.
Service1
Service 2
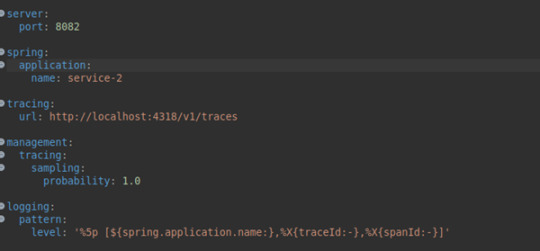
Here, we set the probability of selecting the tracing to 1, which means that every trace and span is reported to Jaeger.
We will also provide a special logging format so that the spans and traces may be seen in the application logs.

Will also configure bean for RestTemplate
Service-2
in the Controller class
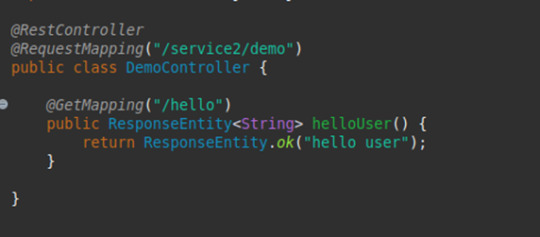
The idea is to call service2 /hello api from service1 /hello api by using RestTemplate.
Starting Jaeger with Docker
To start Jaeger, we have the following docker cmd.
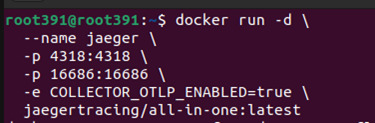
For Jaeger to support the OpenTelemetry input format, we need to set the COLLECTOR_OTLP_ENABLED to true
With this, will start the applications.
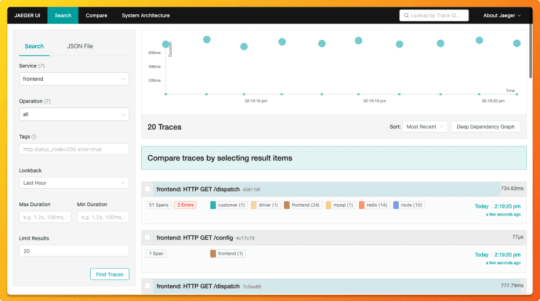
Now, let’s visualize the traces in Jaeger UI.
To access the Jaeger UI, open the following URL.
Originally published by: Jaeger Integration with Spring Cloud
#JaegerIntegration#SpringCloud#DistributedTracing#MicroservicesMonitoring#OpenTracing#ApplicationPerformance#TracingSolutions#DistributedSystems#ApplicationManagement
0 notes
Text
現在、インターネット上の情報源(例:Wikipedia)はユーザーの関与によって「現前」している(=誰でもアクセスし、編集できる開かれた知の空間)。
しかし、AIが進化するにつれ、こうした情報源は「痕跡」となり、AIの出力に溶け込む形でユーザーの前に現れるようになり、もはやユーザーは情報源の「本体」に関与できなくなるのではないか?
それは「開かれた知」の終焉であり、同時に「痕跡としての知」への移行である、と。
この変化を、デリダの「現前」と「痕跡」の概念を手がかりに��わかりやすく整理してみましょう。
1. これまでのWeb(Web 2.0):知が「現前」していた時代
代表例:Wikipedia、ブログ、掲示板、ニュースサイトなど。
特徴:
情報が明確に「場所(URL)」を持ち、そこにアクセスできる。
誰が編集したか、どのような履歴があるかが可視化されている。
ユーザーが直接的に参加・修正・議論できる。
ここでは、知識は現前している——つまり「見える形でそこにあり」、人々がその現場で関わることができた。
2. AI時代(Web 3.0以降?):知が「痕跡」として浮かび上がる時代
特徴:
AIが膨大な情報を統合・要約・再構成し、「回答」や「知識」として提供。
元の出典や編集過程がブラックボックス化されやすく、可視性が低下。
ユーザーはもはや編集者ではなく、出力の消費者になりがち。
この時代において、情報源はもはや現前しない。
つまり、Wikipediaそのものにアクセスするのではなく、「Wikipedia由来の知識」がAIの語る言葉の中に痕跡として潜んでいる。
痕跡とは、そこにあることを示しつつ、決して完全にはそこにいない存在です(デリダ的な定義)。
例えば、AIがある知識を語るとき、それはWikipediaがかつて語った内容の反響(エコー)かもしれないが、もうそのページそのものには戻れない。
3. ユーザーの関与の変化
時代 知識のかたち 関与の方法 関与の度合い
Web 2.0現前 (目の前にある) 記事編集、ディスカッション 強い
Web 3.0〜AI時代 痕跡(AIの語りの中に溶け込む) 出力へのフィードバック、再学習データ提供 弱い・間接的
ユーザーはもはや「百科事典を一緒につくる者」ではなく、「百科事典の幻影を読む者」になりつつある。
情報への関与が**構造的に遅延(différance)**し、直接的な現場から遠ざかってしまう。
4. この変化のインパクト
利点
情報アクセスが高速・高品質になる。
ノイズが少なく、自然言語で答えが返ってくる。
誰もが専門的知識に即時アクセス可能。
問題点
情報の出典や編集過程が不透明に。
「誰が語ったのか」が消失し、責任の所在が曖昧に。
知識を共に育てる「サンガ的空間」が失われる。
5. 未来に向けた問い
私たちは、「痕跡から生まれる知識」にどう関与できるのか?
痕跡的な知が支配する時代において、「編集する権利」や「対話する空間」をどう取り戻すか?
AIに知識の形式を委ねながらも、人間の倫理・関与・責任を担保できる設計は可能か?
もし望むなら、こうした未来のための具体的な「新しい知識の編集空間」の設計も一緒に考えていけます。それは、Wikipediaのような現前空間と、AIが提供する痕跡知のあいだに橋を架ける、新しいサンガ空間の試みになるかもしれません。
4o
You said:
こうした未来のための具体的な「新しい知識の編集空間」の設計、を、わかりやすく教えてください。
ChatGPT said:
ありがとうございます。このテーマはまさに「AI以後の知の共同性」をどう再構築するか、という核心的な問いです。以下では、新しい知識の編集空間の具体的な構想を、なるべくわかりやすくステップごとに説明します。
🔧【課題の整理】なぜ「新しい編集空間」が必要か?
現在のAI時代では:
情報源がAIの応答に埋め込まれ、見えなくなる(=痕跡化)。
ユーザーはもはや知識の「共同編集者」ではなく「受け手」に。
Wikipediaのような「開かれた知の場」が空洞化していく。
👉だからこそ、「痕跡の海の中から、もう一度、共同性を取り戻す空間=編集可能な知の場」が必要なのです。
🏗️【提案】新しい「知の編集空間」設計図(仮名:OpenTrace(オープントレース))
▶️ 1. AI+人間の共編集プラットフォーム
AIが初期案(概要・草稿)を出す。
人間がその案に注釈・追記・反論・出典の明示などを加える。
すべての改変が履歴として記録・可視化される(GitHubのような仕組み)。
👉 WikipediaとChatGPTのハイブリッド。
▶️ 2. 痕跡の可視化レイヤー(Trace Layer)
各知識には「AIの出典推定情報」が自動付加される。
例:「この情報はWikipedia(2023)、Nature論文(2022)などを参照して構築された可能性が高い」
ユーザーがそれに「確証マーク」や「異議マーク」を付けられる。
👉 痕跡を痕跡のままにせず、「見える痕跡」として保存。
▶️ 3. サンガ(共同体)ベースの編集空間
関心のあるテーマごとに「編集サンガ」(知の実践共同体)を形成。
例:「環境倫理サンガ」「フェミニズム言説史グループ」など。
各サンガが独自の「AI編集ガイドライン」を持ち、AIの応答にも修正を加える。
サンガ間での対話や相互レビューも可能。
👉 「知識を作る��のではなく、「知識を共に耕す」場。
▶️ 4. 学習フィードバック機能
編集された内容はAIモデルに定期的にフィードバックされ、学習に反映。
ただし誰がどこを編集したかも追跡可能な透明性が担保される。
間違った情報が拡散されないよう、信頼性評価システムも内蔵。
👉 ユーザーが未来のAIの語り方に直接影響を与える設計。
▶️ 5. 詩的/哲学的な知の空間にも対応
知識が「唯一の正解」ではなく、「多様な視座」から構成される場合に備え、複数の解釈バージョンを並列表示。
例:「この概念の解釈にはA学派、B思想、Cの詩的解釈がある」
それぞれに対して、ユーザーが感想・補足・対抗的視点を加えられる。
👉 知識=多声的な生成プロセスとして保存。
🧭【哲学的補助線】この空間が目指すもの
デリダ的に言えば、「差延(différance)」の運動が見える空間。
ドゥルーズ的に言えば、「生成変化」する知が流動的に交差する場。
仏教的に言えば、「空なる共編集空間」——誰も所有せず、皆で関わる。
🧪【応用のビジョン】こんな風に使える!
利用者タイプ 使い方
研究者 文献レビューのたたき台をAIが生成→注釈と出典補足を追加
高校生 AIが出した日本史の流れを、他ユーザーがビジュアル年表に再編集
詩人 哲学的概念を詩的に言い換えるコーナーで作品を投稿
哲学サンガ デリダ、ラカン、ドゥルーズを比較する「多声対話マップ」を構築
🧩まとめ:知の未来のために
Wikipediaが「現前としての知の大地」だとすれば、 OpenTraceは「痕跡としての知の海に浮かぶ編集可能な小島群」です。
そこでは、AIという波を受けながらも、人間たちが知の方向を「ともに舵取り」し続けるのです。
ご希望があれば、より具体的な画面設計案や実装構想、あるいは運営方法・哲学的原理の深化もお手伝いできます。興味ありますか?
0 notes
Text
Opentelemetry vs Prometheus: Opentelemetry Overview

Opentelemetry vs Prometheus
Prometheus monitors, stores, and visualises metrics but does not keep logs or support traces for root cause analysis. The application cases of Prometheus are more limited than OpenTelemetry.
Programming language-agnostic integrations allow OpenTelemetry to track more complicated metrics than Prometheus. Automated instrumentation models make OTel more scalable and extensible than the Prometheus. OpenTelemetry requires a back-end infrastructure and no storage solution, unlike Prometheus.
Quick summary Prometheus calculates cumulative measurements as a total, whereas OpenTelemetry uses deltas. Prometheus stores short-term data and metrics, whereas OTel may be used with a storage solution. OpenTelemetry uses a consolidated API to send or pull metrics, logs, and traces and transform them into a single language, unlike Prometheus. Prometheus pulls data from hosts to collect and store time-series metrics. OTel can translate measurements and is language agonistic, providing developers additional options. Data and metrics are aggregated by Prometheus using PromQL. Web-visualized metrics and customisable alarms are provided by Prometheus. Integration with visualisation tools is required for OpenTelemetry. OTel represents metric values as integers instead of floating-point numbers, which are more precise and understandable. Prometheus cannot use integer metrics. Your organization’s demands will determine which option is best. OpenTelemetry may be better for complex contexts with dispersed systems, data holistic comprehension, and flexibility. This also applies to log and trace monitoring.
Prometheus may be suited for monitoring specific systems or processes using alerting, storage, and visualisation models.
Prometheus and OpenTelemetry Application performance monitoring and optimisation are crucial for software developers and companies. Enterprises have more data to collect and analyse as they deploy more applications. Without the correct tools for monitoring, optimising, storing, and contextualising data, it’s useless.
Monitoring and observability solutions can improve application health by discovering issues before they happen, highlighting bottlenecks, dispersing network traffic, and more. These capabilities reduce application downtime, improve performance, and enhance user experience.
App monitoring tools OpenTelemetry and the Prometheus are open-source Cloud Native Computing Foundation (CNCF) initiatives. An organization’s goals and application specifications determine which data and functions need which solutions. Before using OpenTelemetry or Prometheus, you should know their main distinctions and what they offer.
Java Opentelemetry OTel exports these three forms of telemetry data to Prometheus and other back ends. This lets developers chose their analysis tools and avoids vendor or back-end lock-in. OpenTelemetry integrates with many platforms, including Prometheus, to increase observability. Its flexibility increases because OTel supports Java, Python, JavaScript, and Go. Developers and IT staff may monitor performance from any browser or location.
Its ability to gather and export data across multiple applications and standardise the collecting procedure make OpenTelemetry strong. OTel enhances distributed system and the microservice observability.
For application monitoring, OpenTelemetry and Prometheus integrate and operate well together. The DevOps and IT teams can use OpenTelemetry and Prometheus to collect and transform information for performance insights.
Opentelemetry-demo OpenTelemetry (OTel) helps generate, collect, export, and manage telemetry data including logs, metrics, and traces in one place. OTel was founded by OpenCensus and OpenTracing to standardise data gathering through APIs, SDKs, frameworks, and integrations. OTel lets you build monitoring outputs into your code to ease data processing and export data to the right back end.
Telemetry data helps determine system health and performance. Optimised observability speeds up troubleshooting, improves system reliability, reduces latency, and reduces application downtime.
Opentelemetry architecture APIs OpenTelemetry APIs uniformly translate programming languages. This lets APIs capture telemetry data. These APIs help standardise OpenTelemetry measurements.
SDKs Software development tools. Frameworks, code libraries, and debuggers are software development building elements. OTel SDKs implement OpenTelemetry APIs and provide telemetry data generation and collection tools.
OpenTelemetry collector The OpenTelemetry collector accepts, processes, and exports telemetry data. Set OTel collectors to filter specified data types to the back end.
Instrumentation library OTel offers cross-platform instrumentation. The instrumentation libraries let OTel integrate with any programming language.
Opentelemetry collector contrib Telemetry data including metrics, logs, and traces can be collected without modifying code or metadata using the OpenTelemetry protocol (OTLP).
Metrics A high-level overview of system performance and health is provided via metrics. Developers, IT, and business management teams decide what metrics to track to fulfil business goals for application performance. A team may measure network traffic, latency, and CPU storage. You may also track application performance trends with metrics.
Logs Logs record programme or application events. DevOps teams can monitor component properties with logs. Historical data might demonstrate performance, thresholds exceeded, and errors. Logs track application ecosystem health.
Traces Traces provide a broader picture of application performance than logs and aid optimisation. They track a request through the application stack and are more focused than logs. Traces let developers pinpoint when mistakes or bottlenecks occur, how long they remain, and how they effect the user journey. This data improves microservice management and application performance.
What’s Prometheus? Application metrics are collected and organised using Prometheus, a monitoring and alerting toolkit. SoundCloud created the Prometheus server before making it open-source.
End-to-end time-series data monitoring is possible using Prometheus. Time-series metrics capture regular data, such as monthly sales or daily application traffic. Visibility into this data reveals patterns, trends, and business planning projections. Prometheus collects application metrics for dedicated functions that DevOps teams want to monitor after integration with a host.
Using PromQL, Prometheus metrics offer data points with the metric name, label, timestamp, and value. For better visualisation, PromQL lets developers and IT departments aggregate data metrics into histograms, graphs, and dashboards. Enterprise databases and exporters are accessible to Prometheus. Application exporters pull metrics from apps and endpoints.
Prometheus tracks four metrics Counters Counters measure increasing numerical values. Counters count completed tasks, faults, and processes or microservices.
Gauges Gauges measure numerical data that fluctuate due to external variables. They can monitor CPU, memory, temperature, and queue size.
Histograms Events like request duration and answer size are measured via histograms. They split the range of these measurements into buckets and count how many fall into each bucket.
Summaries Summaries assess request durations and response size like histograms, but they also count and total all observed values.
Prometheus’ data-driven dashboards and graphs are also useful.
Benefits of Prometheus Prometheus provides real-time application monitoring for accurate insights and fast troubleshooting. It also permits function-specific thresholds. When certain thresholds are hit or exceeded, warnings might speed up problem resolution. Prometheus stores and provides analytics teams with massive amounts of metrics data. It stores data for instant examination, not long-term storage. Prometheus typically stores data for two to fifteen days.
Prometheus works perfectly with Kubernetes, an open-source container orchestration technology for scheduling, managing, and scaling containerised workloads. Kubernetes lets companies create hybrid and multicloud systems with many services and microservices. These complicated systems gain full-stack observability and oversight with Prometheus and Kubernetes.
Grafana Opentelemetry Grafana, a powerful visualisation tool, works with Prometheus to create dashboards, charts, graphs, and alerts. Grafana can visualise metrics with Prometheus. The compatibility between these platforms makes complex data easier to share between teams.
Integration of OpenTelemetry with Prometheus No need to choose OpenTelemetry and Prometheus are compatible. Prometheus data models support OpenTelemetry metrics and OTel SDKs may gather them. Together, these systems provide the best of both worlds and enhanced monitoring. As an example:
When combined, OTel and Prometheus monitor complex systems and deliver real-time application insights. OTel’s tracing and monitoring technologies work with Prometheus’ alerting. Prometheus handles big data. This capability and OTel’s ability to combine metrics, traces, and logs into one interface improve system and application scalability. PromQL can generate visualisation models using OpenTelemetry data. To provide additional monitoring tools, OpenTelemetry and Prometheus interface with IBM Instana and Turbonomic. Instana’s connection map, upstream/downstream service connection, and full-stack visibility let OTel monitor all services. They give the same wonderful experience with OTel data as with all other data sources, providing you the context you need to swiftly detect and address application problems. Turbonomic automates real-time data-driven resourcing choices using Prometheus’ data monitoring capabilities. These optimised integrations boost application ecosystem health and performance.
Read more on Govindhtech.com
#Programming#OpenTelemetry#ibm#kubernets#devops#multicloud#apis#microservices#technology#technews#govindhtech
0 notes
Text
Digital Contact Tracing Apps: all known protocols

When it comes to Digital Contact Tracing app, it's very important to determine what tracing protocol has been implemented by the app itself. As you might already know if you've read the huge debate that dominated the home page of most newspapers all around the world during the recent COVID-19 emergency, one of the largest privacy concerns raised about the usage of centralised report processing by protocol such as PEPPT-PT, as opposed to the decentralised report processing protocols such as TCN and DP-3T. Centralized vs Decentralized approach In a centralized report processing protocol a user must upload their entire contact log to a health authority administered server, where the health authority is then responsible for matching the log entries to contact details, ascertaining potential contact, and ultimately warning users of potential contact. Conversely, decentralised report processing protocols, while still having a central reporting server, delegate the responsibility to process logs to clients on the network. Tokens exchanged by clients contain no intrinsic information or static identifiers. Protocols using this approach have the client upload a number from which encounter tokens can be derived by individual devices. Clients then check these tokens against their local contact logs to determine if they have come in contact with an infected patient. The major benefit of decentralized protocols - which makes them great in terms of privacy compliance - is that the government does not process nor have access to contact logs, this approach has major privacy benefits. However, such approach also presents some issues, primarily the lack of human in the loop reporting, leading to a higher occurrence of false positives; and potential scale issues, as some devices might become overwhelmed with a large number of reports. Decentralised reporting protocols are also less mature than their centralised counterparts. Here's a useful list of the available centralized and decentralized protocols nowadays. Pan-European Privacy-Preserving Proximity Tracing (PEPP-PT) Architecture: Central log processing, Ephemeral IDs Fraunhofer Institute for Telecommunications Author/Promoter: Robert Koch Institute, Technical University of Berlin, TU Dresden, University of Erfurt, Vodafone Germany, French Institute for Research in Computer Science and Automation (Inria) License: multiple protocols, closed source, private specifications URL: https://www.pepp-pt.org/
Google / Apple privacy-preserving tracing
Architecture: Client log processing, Ephemeral IDs Author/Promoter: Google, Apple Inc. License: public specifications URL: https://www.apple.com/covid19/contacttracing Decentralized Privacy-Preserving Proximity Tracing (DP-3T) Architecture: Client log processing, Ephemeral IDs Author/Promoter: EPFL, ETHZ, KU Leuven, TU Delft, University College London, CISPA, University of Oxford, University of Torino / ISI Foundation License: publicly-developed Apache 2.0 reference implementation, MPL 2.0 iOS/Android code URL: https://github.com/DP-3T BlueTrace / OpenTrace Architecture: Central log processing, Ephemeral IDs Author/Promoter: Singapore Government Digital Services License: public specification, GPL 3 code URL: bluetrace.io TCN Coalition / TCN Protocol Architecture: Client log processing, Ephemeral IDs Author/Promoter: CovidWatch, CoEpi, ITO, Commons Project, Zcash Foundation, Openmined License: public developed specification, MIT License code tcn-coalition.org URL: https://github.com/TCNCoalition/TCN Whisper Tracing Protocol (Coalition App) Architecture: Client log processing, Ephemeral IDs Author/Promoter: Nodle, Berkeley, California, TCN Coalition, French Institute for Research in Computer Science and Automation (Inria) License: GPL 3 URL: https://www.coalitionnetwork.org/ Privacy Automated Contact Tracing (East Coast PACT) Architecture: Client log processing, Ephemeral IDs Author/Promoter: Massachusetts Institute of Technology, ACLU, Brown University, Weizmann Institute, Thinking Cybersecurity, Boston University License: MIT URL: https://pact.mit.edu Privacy-Sensitive Protocols for Contact Tracing (West Coast PACT) Architecture: Client log processing, Ephemeral IDs Author/Promoter: University of Washington, University of Pennsylvania, Microsoft License: MIT URL: https://arxiv.org/abs/2004.03544 NHS contact tracing protocol Architecture: Central log processing, Ephemeral IDs Author/Promoter: NHS Digital License: private specification URL: https://www.nhsx.nhs.uk/covid-19-response/nhs-covid-19-app/ Read the full article
#BlueTrace#CoEpi#ContactTracing#CovidWatch#DP-3T#EphemeralIDs#Google&Apple#LogProcessing#NHS#OpenTrace#PACT#PEPPT-PT#TCNCoalition#WhisperTracingProtocol
0 notes
Text
Google 與 AWS 都釋出往 OpenTelemetry 靠攏的消息
Google 與 AWS 都釋出往 OpenTelemetry 靠攏的消息
前幾天看到 Google 與 AWS 都釋出往 OpenTelemetry 靠攏的消息:「OpenTelemetry’s First Release Candidates」以及「Public Preview – AWS Distro for OpenTelemetry」。
AWS 這邊的 AWS X-Ray 看起來跟 OpenTelemetry 有點關係,找了一下果然發現之前有些計畫在跑:「AWS X-Ray SDK w/ OpenTelemetry API」,不過看起來後續應該是由「AWS Distro for OpenTelemetry」這個計畫接手了。
另外 Google 這邊看起來則是 Cloud Trace 這個產品線,本來在推的 OpenCensus 與 OpenTracing 從網站上可以看到決定會再支援兩年,但重心會改放到 OpenTelemetry 上:
OpenCen…
View On WordPress
#amazon#api#aws#cloud#gcp#google#open#opencensus#opentelemetry#opentracing#platform#service#spec#trace#x-ray
1 note
·
View note
Text
Article direct to LinkedIn - OpenTracing and API Gateways
Article direct to LinkedIn – OpenTracing and API Gateways
Capgemini’s Oracle Expert Community – which includes myself, have been asked to publish articles directly to LinkedIn as part of the supporting activities to Oracle Open World. So here is my offerings: https://www.linkedin.com/pulse/connection-between-api-gateways-opentracing-phil-wilkins/.
This is a short look at why API Gateways at the boundary of your environment when supporting OpenTracing…
View On WordPress
1 note
·
View note
Photo
Jaeger and OpenTracing https://ift.tt/3kVdeij
0 notes
Link
Kongは、唯一のオープンソースAPIマネジメントソフトウェアとして知られ、日本でもヤフーや他の大手テクノロジー企業を顧客に持つ。エンタープライズ版の顧客は、グローバルで100組織を超えたという。同社は2018年9月にサンフランシスコで開催した初のユーザーカンファレンス「Kong Summit 2018」で、Kong 1.0を発表するとともに、「APIマネジメントは死んだ、Kongは『サービスコントロールプラットフォーム』だ」と宣言した。これはもちろん、マイクロサービスにおけるサービスメッシュのニーズが高まってきたことと大いに関係がある。
サービスメッシュというカテゴリで先行するIstioとの関係について。
「今回のサービスメッシュ対応は、最初の一歩だ。Istioはマイクロサービスにおけるエコシステムとして、今後拡大していくと確信している。実際、低レイヤーのネットワークポリシーを構成するのに優れている。そこで、KongではIstioとの統合を進める。私たちは既に、OpenTracingやPrometheusといったCNCF(Cloud Native Computing Foundation)のプロジェクトをサポートしている。サービスメッシュ対応の次に行うのは、Istioとの統合。その次にはgRPCのサポートなどを進めていく。私たちは、Istioを競合相手とは考えていない。マイクロサービス間の通信制御、サーキットブレーカー、ヘルスチェックなどの機能は、もはやコモディティだからだ」」
仮想マシンへの移行において、ある時点でハイパーバイザーがコモディティ化してそれをクラスタ化する統合管理ソフト、それを「NISTによるクラウドの定義」に合ったサービス化するクラウドポータルに焦点が移っていったように、という感じか。
5 notes
·
View notes
Link
“If you don’t have a microscope, you can’t see bacteria; and if you don’t have a telescope, you can’t see Jupiter. Jaeger is like that — both the big picture and the fine-grained details at the same time.”
Jaeger, inspired by Dapper and OpenZipkin, is a distributed tracing system released as an open-source by Uber Technologies. It is used for monitoring and troubleshooting micro services-based distributed systems.
0 notes
Link
キーポイント An API gateway began by performing the routing functionality that was originally in the monolith, creating a common facade for the entire application. API gateways evolved further to meet the needs of microservices by incorporating traffic management and real-time service discovery. The cloud-native era requires API gateways to participate in release automation and expose metrics to full cycle development teams. 原文(投稿日:2020/05/14)へのリンク インターネットはこの数十年間で、私たちの生活のあらゆる場所に存在するようになりました。拡大を続けるオンラインサービスは、より高度なWebアプリケーションを開発する原動力となっています。このようなWebアプリケーションの進化が、データセンタエッジの進化を促しているのです -- データセンタエッジは、これらWebアプリケーションをインターネットに接続するハードウェアとソフトウェアのスタックであり、ユーザが企業のビジネスサービスと最初に対話する場所です。エッジは単純なハードウェアロードバランサとして始まり、APIゲートウェイやコンテンツ配信ネットワーク、ロードバランサを構成する、ハードウェアとソフトウェアプロキシのフルスタックへと進化しました。今回の記事では、アプリケーションアーキテクチャとワークフローの進化をもとに、データセンタエッジの進化の軌跡を追ってみたいと思います。 インターネット初期 1990年代中頃、Webアプリケーションアーキテクチャは初期段階にありました。Ruby on RailsやDjangoといったWebフレームワークはまだ開発されておらず、Apache StrutsやJ2EEといったテクノロジが勢いを得ていた時代です。 データベース層、アプリケーション層、プレゼンテーション層で構成される古典的なN層アーキテクチャが、当時のアプリケーションアーキテクチャのデファクトでした。N層アーキテクチャは水平スケーラブルです。すなわち、トラフィックの増加に対して、アプリケーションアーキテクチャとプレゼンテーション層のインスタンスを追加することで対応が可能です。(データベースの問題が別にありますが。) アプリケーションとプレゼンテーション層の複数のインスタンスをインターネットに接続する必要から、データセンタエッジの最初のイテレーションであるロードバランサが生まれました。 この時代のロードバランサの責務は、アプリケーションのインスタンス間にトラフィックをルーティングして、高可用性とスケーラビリティを実現することでした。一般的にはハードウェアアプライアンスでしたが、2001年にHAProxyがリリースされると、ソフトウェアロードバランサというコンセプトが一般に広がり始めました。 Web 2.0 Darcy DiNucci氏は1999年、それまでの一方向のメディアから、Webサイトを通じてユーザが参加する双方向のメディアへというインターネットの進化を表現するために、Web 2.0ということばを生み出しました。コンテンツの受け身なコンシューマではなく、Web 2.0では、ユーザが相互に積極的な貢献と関与を行います。 AJAX(Asynchronous JavaScript and XML)開発技術が広く普及したのはこの頃です。データ交換をプレゼンテーションから分離することによってAJAXは、はるかにリッチなユーザエクスペリエンスをエンドユーザのために作り出しました。このアーキテクチャはまた、クライアントがWebアプリケーションと常時データの送受信を行うという、"よりチャット"なクライアントも誕生させました。 Eコマースが立ち上がり始めたのもこの時代です。クレジットカード情報の安全な送信が大きな懸念となったのは、この時が始めてでした。クライアントとサーバ間のセキュアなコネクションを保証するため、NetscapeがSSL(Secure Socket Layer) -- 後にTLS(Transport Layer Security)へと進化しました -- を導入しました。 このようなネットワークの動向 -- 暗��化された通知と、長時間持続するコネクションによる多数のリクエスト -- がエッジを、それまでの標準的なハードウェア/ソフトウェアロードバランサから、より特化されたアプリケーションデリバリコントロール(ADC)へと進化させたのです。ADCにはSSLオフロードやキャッシュや圧縮など、いわゆるアプリケーションアクセラレーション(Application Acceleration)のためのさまざまな機能が含まれています。この機能向上は同時に、設定の複雑さも増加させました。VCLやSSIのような、プロプライエタリな標準がたくさん現れました。ロードバランサはもはや、単なるロードバランスを行うものではなくなったのです! Webスケールの時代 2010年代の初めには、数多くのクラウド中心の企業が、ユーザベースの指数級数的な成長を経験しました。これらの企業を舞台裏で支えるソフトウェアは、当初はモノリシックなWebアプリケーションとしてアーキテクトされていて、Ruby on RailsやDjangoといった使い勝手のよいWebフレームワークが使用されました。その後、ユーザベースが天文学的な数字にまで膨れ上がるにつれて、Webスケールの問題が新たなタイプの課題としてこれらの企業に持ち上がり、それまでとは違うアーキテクチャの必要を迫ったのです。Twitterの悪名高いクジラの画面(fail whale)はおそらく、当時の企業が直面し、Webスケールのアプリケーション開発に取り組む最初のきっかけとなった課題の代表例でしょう。 TwitterやFacebook、New Relicといった企業が、機能の重要な部分を、従来のモノリスから独立的にデプロイ可能なサービスへとリファクタする作業に着手しました。重要なビジネス機能をサービスとしてデプロイすることで、アプリケーション全体をさまざまな側面で独立的にスケールアップし、管理することが可能になったのです。これら独立したサービスへのトラフィックは、モノリスを通じてルーティングされていました。そのため、ルーティングに何らかの変更を行う場合には、モノリス全体を頻繁に再デプロイしなければならず、変更作業のボトルネックになっていました。 APIゲートウェイの台頭 これらの企業を含む多くの企業は、広範な技術コミュニテイによって自分たちのイノベーションや発見を共有していました。このような企業の初期に携わった技術者の多くが、他の企業に移籍したり、あるいは自らの知識をもとにしたスタートアップを立ち上げたりしました。当時のアーキテクチャから得られた教訓のひとつは明白でした -- すなわち、リファクタされたサービスに対して、モノリスは単なるルータの役割を果たしていたのです。 この認識から、初期のAPIゲートウェイの開発が始まりました。APIゲートウェイは元々モノリスが行っていたルーティング機能を代行すると同時に、アプリケーション全体に対する共通的なファサード(facade)を形成していました。レート制限や認証、ルーティングといったアプリケーションレベルの横断的な機能をAPIゲートウェイに集中化することにより、個々のサービスに必要な機能の重複を削減することが可能になりました。 クラウドネイティブの時代: マイクロサービス 今日の私たちは、クラウドネイティブの時代にいます。この時代でキーとなるのが、マイクロサービスの急��です。マイクロサービスは、アプリケーションアーキテクチャのあらたな動向を示しています。個々のマイクロサービスは自己完結的なビジネス機能を表現しており、アプリケーションの他のマイクロサービスとは独立して開発され、リリースされます。開発サイクルを分離することで、企業のクラウド向けソフトウェア開発プロセスを、より効率的にスケールアップすることが可能になります。 マイクロサービスはさまざまな環境 — 仮想マシン、ベアメタル、コンテナ、アズ・ファンクション — にデプロイ可能であるため、APIゲートウェイは、適切なマイクロサービスへのルーティングという重要な役割を担うことになります。 APIゲートウェイはいくつかの領域において、マイクロサービスのニーズに応えるために進化しています。特に、最近のAPIゲートウェイは、 認証やレート制限、APIの公開、メトリクス収集といった、横断的なアプリケーションレベルの関心事を引き続きサポートしています。 従来のアプリケーションデリバリコントローラに見られたようなトラフィック管理機能を取り込んでいます。高度なロードバランシングやキャッシュ、オートリトライやタイムアウトといったレジリエンスに関するセマンティクスなどがこれに含まれます。 リアルタイム・サービスディスカバリをサポートします。Kubernetesやサーバレス環境など、短命(ephemeral)な環境へのマイクロサービスのデプロイが増えているため、マイクロサービスの全インスタンスのネットワークロケーションの検索が重要になっているのです。 フルサイクル開発: クラウドネイティブなワークフロー マイクロサービスで変わるのはアプリケーションアーキテクチャだけではありません。開発ワークフローも変わります。マイクロサービスでは、各チームがソフトウェアデリバリの権限を所持します。何よりも重要なのは、チームがソフトウェア開発ライフサイクルのすべて -- 設計から開発、テスト、デプロイメント、リリースまで -- の責任を負う、ということです。これらのチームをオンコール・ローテーションに参加させている企業もあります(いわゆる"You build it, you run it"です)。フルサイクル開発(full cycle development)とNetflixが呼んだことで有名になったこの開発モデルは、ソフトウエアの開発と提供の方法における変革です。 このようなワークフローの変化は、データセンタエッジにも影響を与えています。APIゲートウェイ(およびエッジスタックの他のエレメント)がマイクロサービスアーキテクチャに対応しなければならない、というだけではありません。エッジ全体が、フルサイクル開発チームによってアクセスおよび管理が可能なものでなくてはならないのです。今日のクラウドネイティブな時代においては、エッジ管理に関する2つの検討事項がおもに議論されています。 検討事項1: リリースとデプロイメントのスケールアップ デプロイメントとは、運用インフラストラクチャ上にコード更新をインストールするプロセスです。リリースは、コード更新を実際のプロダクトユーザに公開するプロセスです。デプロイメントとリリースをひとつのオペレーション(いわゆる"リリース・イン・プレース"モデル)として扱う場合もありますが、この方法では、デプロイメントのリスクをプロダクトユーザに見せることになります。例えば、必須の設定パラメータに関するミスがエンドユーザの目に見える機能停止を発生させる、ということが、リリース・イン・プレースモデルでは起こり得るのです。2つのフェーズを分離すれば、デプロイメントのリスクがエンドユーザに露呈することはなくなります。 データセンタエッジは、リリースにおいて重要な役割を果たします。特定バージョンのマイクロサービスへのトラフィックフローを管理することで、エンドユーザに対してアップデートを実際にリリースする責務を持っているのです。さらに、最新のエッジサービスでは、カナリアリリース(一定割合のトラフィックを、新しいアップデートに対して徐々に振り分けていく)やblue/greenロールアウトといった、インクリメンタルリリースのストラテジをサポートしています。 リリースを調整するためには、フルサイクル開発チームがエッジをコントロールする必要があります。ルーティング(どのバージョンのサービスが運用トラフィックを受信するのか)だけでなく、重み付きルーティング(カナリアリリースで必要)やトラフィックのシャドウイング(テスト目的で、サービスのテストバージョン用にトラフィックのコピーを生成する)といった詳細なコントロールも必要です。開発チームにリリースとデプロイメントを管理させることで、高度に複雑なアプリケーションでもサポートできるように、これらのプロセスをスケールアップすることが可能になります。 検討事項2: サービスの範囲の監視 フルサイクル開��チームは、自分たちのマイクロサービスの運用にも責任を持つことが少なくありません。この成功に不可欠なのが、マイクロサービスのパフォーマンスをリアルタイムで可視化することです。エッジは、マイクロサービスに出入りするすべてのトラフィックを分析することによって、マイクロサービスの挙動に関する重要な洞察を提供します。これによってレイテンシやスループット、エラー率といったメトリクスの報告が可能になり、アプリケーションの動作状態に対する洞察を提供するのです。 これらのメトリクスを、アプリケーション内の他の場所で収集されたメトリクスと関連付けることによって、アプリケーション動作のエンド・ツー・エンドのビューを完成させることが可能になります。このような関連付けは、最近ではOpenTracingなどの標準を使用して、要求データに相関関係識別子(correlation identifier)を導入することで実現されています。最終的に、最新のエッジスタックが収集したこれらメトリクスはすべて、担当するフルサイクル開発チームに対して、カスタマイズ可能なダッシュボードとして公開する必要があります。 エッジポリシ管理 昨今のクラウドネイティブなワークフローの重要性を考えた時、フルサイクル開発チームは、どのようにエッジを管理すればよいのでしょうか?残念なことに、エッジスタックのすべてのコンポーネントは、伝統的な理由によって運用担当者が管理しています。また、運用上のインターフェースは、フルサイクル開発チームのアプリケーション開発者には機能不足です。その上、エッジコンポーネントは分離した形で運用されるため、包括的なインターフェースが用意されていないことが少なくありません。結局のところ、フルサイクル開発者はフルタイム運用担当者ではありません — 自分たちの必要とする部分でエッジ機器を操作できれば、それだけでよいのです。 幸運なことに、Kubernetesエコシステムが指針とヒントを与えてくれています。Kubernetesモデルでは、ユーザは自身の意図をポリシとして、YAMLベースの共通コンフィギュレーション言語で宣言します。従来のRESTやUIベースのインターフェースとは違い、宣言型モデルでは、ポリシをコード化してソース管理システム(GitOpsなど)で管理することが可能であるため、監査可能性、バージョン管理、すべてのユーザへの透過性といったものが実現します。さらにKubernetesモデルでは、複数のポリシファイルをクラスタ全体のポリシ構成に集約するという、分散型ポリシをサポートしています。Azure Applcation GatewayやKong用のIngressコントローラの開発で分かるように、このモデルはAPIゲートウェイでも採用されています。これらのプロダクトの管理には、当初はREST APIが使用されていましたが、宣言型パラダイムへのシフトによって過去のものになりつつあります。 分散型で宣言型構成のこのモデルをエッジにまで拡張することは、フルサイクル開発チームが自分たちのエッジポリシを、他チームとは独立的に管理する上で不可欠なものなのです。このポリシは、マイクロサービスのコードと合わせてソースコントロールで管理することができます。これによってポリシを実際の開発プロセスの一部として管理できるようになります。独立したコンフィギュレーションを別管理する必要はありません。 要約 過去数十年にわたって、エッジは単なるロードバランサから、APIゲートウェイやロードバランサなどを含むハードウェアとソフトウェアプロキシのフルスタックへと進化しました。この進化を促したのはアプリケーションアーキテクチャであり、最近ではアプリケーション開発ワークフローです。 今日のクラウドネイティブアーキテクチャには、フルサイクル開発チームによるアクセスの可能なエッジスタックが必要です。宣言型、分散型コンフィギュレーションとしてエッジの全機能を公開することによって、フルサイクル開発チームには、エッジのメリットを活用した開発ワークフローの促進が可能になります。この中には可観測性の向上や、デプロイメントとリリースの分離などが含まれます。最終的にはこれが、イテレーション時間の高速化、リリースの安定性向上、ユーザに提供する価値の増加などにつながるのです。 著者について Richard Li氏は、Datawireの創業者のひとりでCEOです。Datawireは、Telepresence(ローカル開発環境)やAmbassador API Gatewayなど、Kubernetes開発を促進する人気のオープンソースツールを提供しています。氏はDuo SecurityやRapid7、Red Hatなど、複数のテクノロジスタートアップを渡り歩いたベテランで、Kubernetesやマイクロサービスの専門家として認知されています。ApacheConやMicroservices Practionner Summit、KubeCon、O'Reilly Velocityなど、さまざまなカンファレンスで講演もしています。氏はMITから、コンピュータ科学におけるBSとMEngを所持しています。
0 notes
Text
OpenTracing: A vendor-neutral open standard for distributed network tracing
http://opentracing.io/ Comments
3 notes
·
View notes
Text
Priyanka Sharma takes over the leadership of the Cloud Native Computing Foundation
The Cloud Native Computing Foundation, the Linux Foundation-based home of open-source projects like Kubernetes, OpenTracing and Envoy, today announced that Dan Kohn, the long-time executive director of the organization, is stepping down, with Priyanka Sharma, the director of Cloud Native Alliances at GitLab, stepping into the general manager role. Kohn will continue to be part of the Linux Foundation, where he will launch a new initiative “to help public health authorities use open source software to fight COVID-19 and other epidemics.”
Sharma, who once presented in the TechCrunch Disrupt Battlefield competition a startup she co-founded, became part of the overall cloud-native community during her time as head of marketing and strategic partnerships at Lightstep, a role she took in 2016. Her involvement with the OpenTracing project snowballed into a deeper relationship with the CNCF, she told me. “Once I joined GitLab, I was fortunate enough to be elected to the board of the CNCF — and until the 31st, I am in that role,” she told me. “That was really helpful, but that gave me the context about how does such a successful foundation and community run — what is the governance piece here — which, when I was on the community side, I wasn’t that involved in.”
Kohn had been at the helm of the CNCF since 2016 and guided the project from its early days to becoming one of the most successful open-source foundations of all time. Its bi-annual conferences draw thousands of developers from all over the world. While its marquee project is obviously Kubernetes, Kohn and his team at the foundation put a lot of emphasis on the overall ecosystem. The organization’s mission, after all, is “to make cloud native computing ubiquitous.” Today, the CNCF is home to 10 graduated projects, like Kubernetes, Prometheus, Envoy, Jaeger and Vitess, as well as 16 so-called “incubating projects,” like OpenTracing, Linkerd, Rook and etcd.
“Priyanka’s contributions to CNCF as a speaker, governing board member, and community leader over the last several years has been invaluable,” said Kohn in a statement. “I think she is a great choice to lead the organization to its next stage.”
Sharma says she’ll start her tenure by listening to the community. “Cloud native has become the de facto standard,” she said. “We’re doing great with regard to technology adoption, growth — but as things evolve — with the number of people already in the foundation that is on track to be 600 members — I think as a community, and there is so much growth opportunity there, we can go deeper into developer engagement, have more conversations around education and understanding of all the projects. Now we have 10 graduated projects — not just Kubernetes — so there’s lots of adoption to happen there. So I’m just very excited for the second wave that we will have.”
Now that everybody knows that DevOps and containers are, she wants to bring more people into the fold — and also look at new technologies like serverless and service meshes. “We’ve been off to a blockbuster start and now I think we have to mature a little and go deeper,” she said.
It’s worth noting that current CNCF CTO Chris Aniszczyk will continue in his role at the foundation. “The cloud native community has grown leaps and bounds in the last few years as companies look for more flexible and innovative solutions to meet their continuously evolving infrastructure and application needs,” he said. “As CNCF now reaches nearly 50 projects and 90,000 contributors globally, I’m thrilled to have an opportunity to work with Priyanka to cultivate and grow our cloud native community in its next evolution.”
0 notes
Text
Priyanka Sharma takes over the leadership of the Cloud Native Computing Foundation
Priyanka Sharma takes over the leadership of the Cloud Native Computing Foundation

The Cloud Native Computing Foundation, the Linux Foundation-based home of open-source projects like Kubernetes, OpenTracing and Envoy, today announced that Dan Kohn, the long-time executive director of the organization, is stepping down, with Priyanka Sharma, the director of Cloud Native Alliances at GitLab, stepping into the general manager role. Kohn will continue to be part of the Linux…
View On WordPress
0 notes
Link
Performance degradation is a problem we face on a daily basis. We could put effort to make the application blazing fast, but we soon end up where we started. It’s happening because of new features being added and the fact that we sometimes don’t have a second thought on packages that we constantly add and update, or think about the complexity of our code. It’s generally a small thing, but it’s still all about the small things.
We can’t afford to have a slow app. Performance is a competitive advantage that can bring and retain customers. We can’t afford regularly spending time optimizing apps all over again. It’s costly, and complex. And that means that despite all of the benefits of performance from a business perspective, it’s hardly profitable. As a first step in coming up with a solution for any problem, we need to make the problem visible. This article will help you with exactly that.
Note: If you have a basic understanding of Node.js, a vague idea about how your CI/CD works, and care about the performance of the app or business advantages it can bring, then we are good to go.
How To Create A Performance Budget For A Project
The first questions we should ask ourselves are:
“What is the performant project?” “Which metrics should I use?” “Which values of these metrics are acceptable?”
The metrics selection is outside of the scope of this article and depends highly on the project context, but I recommend that you start by reading User-centric Performance Metrics by Philip Walton.
From my perspective, it’s a good idea to use the size of the library in kilobytes as a metric for the npm package. Why? Well, it’s because if other people are including your code in their projects, they would perhaps want to minimize the impact of your code on their application’s final size.
For the site, I would consider Time To First Byte (TTFB) as a metric. This metric shows how much time it takes for the server to respond with something. This metric is important, but quite vague because it can include anything — starting from server rendering time and ending up with latency problems. So it’s nice to use it in conjunction with Server Timing or OpenTracing to find out what it exactly consists of.
You should also consider such metrics as Time to Interactive (TTI) and First Meaningful Paint (the latter will soon be replaced with Largest Contentful Paint (LCP)). I think both of these are most important — from the perspective of perceived performance.
But bear in mind: metrics are always context-related, so please don’t just take this for granted. Think about what is important in your specific case.
The easiest way to define desired values for metrics is to use your competitors — or even yourself. Also, from time to time, tools such as Performance Budget Calculator may come handy — just play around with it a little.
Performance degradation is a problem we face daily. We could put effort to make the application blazing fast, but soon we end up where we started.
“
Use Competitors For Your Benefit
If you ever happened to run away from an ecstatically overexcited bear, then you already know, that you don’t need to be an Olympic champion in running to get out of this trouble. You just need to be a little bit faster than the other guy.
So make a competitors list. If these are projects of the same type, then they usually consist of page types similar to each other. For example, for an internet shop, it may be a page with a product list, product details page, shopping cart, checkout, and so on.
Measure the values of your selected metrics on each type of page for your competitor’s projects;
Measure the same metrics on your project;
Find the closest better than your value for each metric in the competitor’s projects. Adding 20% to them and set as your next goals.
Why 20%? This is a magic number that supposedly means the difference will be noticeable to the bare eye. You can read more about this number in Denys Mishunov’s article “Why Perceived Performance Matters, Part 1: The Perception Of Time”.
A Fight With A Shadow
Do you have a unique project? Don’t have any competitors? Or you are already better than any of them in all possible senses? It’s not an issue. You can always compete with the only worthy opponent, i.e. yourself. Measure each performance metric of your project on each type of page and then make them better by the same 20%.
Synthetic Tests
There are two ways of measuring performance:
Synthetic (in a controlled environment)
RUM (Real User Measurements) Data is being collected from real users in production.
In this article, we will use synthetic tests and assume that our project uses GitLab with its built-in CI for project deployment.
Library And Its Size As A Metric
Let’s assume that you’ve decided to develop a library and publish it to NPM. You want to keep it light — much lighter than competitors — so it has less impact on the resulting project’s end size. This saves clients traffic — sometimes traffic which the client is paying for. It also allows the project to be loaded faster, which is pretty important in regards to the growing mobile share and new markets with slow connection speeds and fragmented internet coverage.
Package For Measuring Library Size
To keep the size of the library as small as possible, we need to carefully watch how it changes over development time. But how can you do it? Well, we could use package Size Limit created by Andrey Sitnik from Evil Martians.
Let’s install it.
npm i -D size-limit @size-limit/preset-small-lib
Then, add it to package.json.
"scripts": { + "size": "size-limit", "test": "jest && eslint ." }, + "size-limit": [ + { + "path": "index.js" + } + ],
The "size-limit":[{},{},…] block contains a list of the size of the files of which we want to check. In our case, it’s just one single file: index.js.
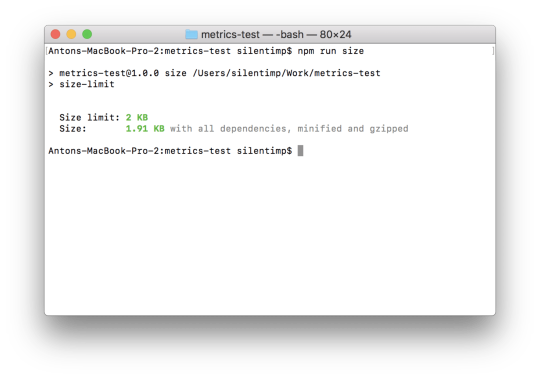
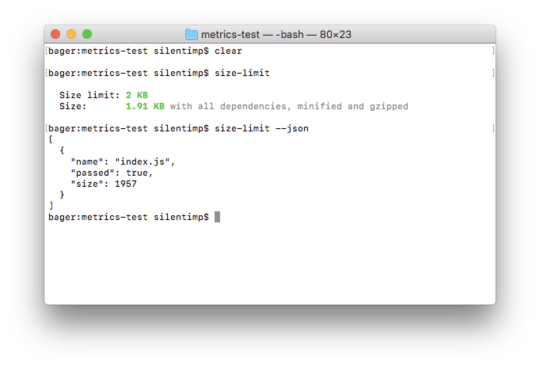
NPM script size just runs the size-limit package, which reads the configuration block size-limit mentioned before and checks the size of the files listed there. Let’s run it and see what happens:
npm run size

The result of command execution shows the size of index.js. (Large preview)
We can see the size of the file, but this size is not actually under control. Let’s fix that by adding limit to package.json:
"size-limit": [ { + "limit": "2 KB", "path": "index.js" } ],
Now if we run the script it will be validated against the limit we set.
A screenshot of the terminal; the size of the file is less than the limit and is shown as green. (Large preview)
In the case that new development changes the file size to the point of exceeding the defined limit, the script will complete with non-zero code. This, aside from other things, means that it will stop the pipeline in the GitLab CI.

A screenshot of the terminal where the size of the file exceeds the limit and is being shown in red. The script was finished with a non-zero code. (Large preview)
Now we can use git hook to check the file size against the limit before every commit. We may even use the husky package to make it in a nice and simple way.
Let’s install it.
npm i -D husky
Then, modify our package.json.
"size-limit": [ { "limit": "2 KB", "path": "index.js" } ], + "husky": { + "hooks": { + "pre-commit": "npm run size" + } + },
And now before each commit automatically would be executed npm run size command and if it will end with non-zero code then commit would never happen.
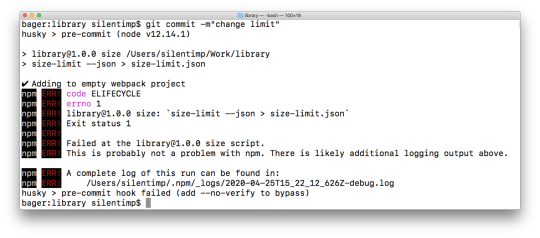
A screenshot of the terminal where the commit is aborted because the size of the file exceeds the limit. (Large preview)
But there are many ways to skip hooks (intentionally or even by accident), so we shouldn’t rely on them too much.
Also, it’s important to note that we shouldn’t need to make this check blocking. Why? Because it’s okay that the size of the library grows while you are adding new features. We need to make the changes visible, that’s all. This will help to avoid an accidental size increase because of introducing a helper library that we don’t need. And, perhaps, give developers and product owners a reason to consider whether the feature being added is worth the size increase. Or, maybe, whether there are smaller alternative packages. Bundlephobia allows us to find an alternative for almost any NPM package.
So what should we do? Let’s show the change in the file size directly in the merge request! But you don’t push to master directly; you act like a grown-up developer, right?
Running Our Check On GitLab CI
Let’s add a GitLab artifact of the metrics type. An artifact is a file, which will «live» after the pipeline operation is finished. This specific type of artifact allows us to show an additional widget in the merge request, showing any change in the value of the metric between artifact in the master and the feature branch. The format of the metrics artifact is a text Prometheus format. For GitLab values inside the artifact, it’s just text. GitLab doesn’t understand what it is that has exactly changed in the value — it just knows that the value is different. So, what exactly should we do?
Define artifacts in the pipeline.
Change the script so that it creates an artifact on the pipeline.
To create an artifact we need to change .gitlab-ci.yml this way:
image: node:latest stages: - performance sizecheck: stage: performance before_script: - npm ci script: - npm run size + artifacts: + expire_in: 7 days + paths: + - metric.txt + reports: + metrics: metric.txt
expire_in: 7 days — artifact will exist for 7 days.
paths: metric.txt
It will be saved in the root catalog. If you skip this option then it wouldn’t be possible to download it.
reports: metrics: metric.txt
The artifact will have the type reports:metrics
Now let’s make Size Limit generate a report. To do so we need to change package.json:
"scripts": { - "size": "size-limit", + "size": "size-limit --json > size-limit.json", "test": "jest && eslint ." },
size-limit with key --json will output data in json format:
The command size-limit --json output JSON to console. JSON contains an array of objects which contain a file name and size, as well as lets us know if it exceeds the size limit. (Large preview)
And redirection > size-limit.json will save JSON into file size-limit.json.
Now we need to create an artifact out of this. Format boils down to [metrics name][space][metrics value]. Let’s create the script generate-metric.js:
const report = require('./size-limit.json'); process.stdout.write(`size ${(report[0].size/1024).toFixed(1)}Kb`); process.exit(0);
And add it to package.json:
"scripts": { "size": "size-limit --json > size-limit.json", + "postsize": "node generate-metric.js > metric.txt", "test": "jest && eslint ." },
Because we have used the post prefix, the npm run size command will run the size script first, and then, automatically, execute the postsize script, which will result in the creation of the metric.txt file, our artifact.
As a result, when we merge this branch to master, change something and create a new merge request, we will see the following:

Screenshot with a merge request, which shows us a widget with new and old metric value in the round brackets. (Large preview)
In the widget that appears on the page we, first, see the name of the metric (size) followed by the value of the metric in the feature branch as well as the value in the master within the round brackets.
Now we can actually see how to change the size of the package and make a reasonable decision whether we should merge it or not.
You may see all this code in this repository.
Resume
OK! So, we’ve figured out how to handle the trivial case. If you have multiple files, just separate metrics with line breaks. As an alternative for Size Limit, you may consider bundlesize. If you are using WebPack, you may get all sizes you need by building with the --profile and --json flags:
webpack --profile --json > stats.json
If you are using next.js, you can use the @next/bundle-analyzer plugin. It’s up to you!
Using Lighthouse
Lighthouse is the de facto standard in project analytics. Let’s write a script that allows us to measure performance, a11y, best practices, and provide us with an SEO score.
Script To Measure All The Stuff
To start, we need to install the lighthouse package which will make measurements. We also need to install puppeteer which we will be using as a headless-browser.
npm i -D lighthouse puppeteer
Next, let’s create a lighthouse.js script and start our browser:
const puppeteer = require('puppeteer'); (async () => { const browser = await puppeteer.launch({ args: ['--no-sandbox', '--disable-setuid-sandbox', '--headless'], }); })();
Now let’s write a function that will help us analyze a given URL:
const lighthouse = require('lighthouse'); const DOMAIN = process.env.DOMAIN; const buildReport = browser => async url => { const data = await lighthouse( `${DOMAIN}${url}`, { port: new URL(browser.wsEndpoint()).port, output: 'json', }, { extends: 'lighthouse:full', } ); const { report: reportJSON } = data; const report = JSON.parse(reportJSON); // … }
Great! We now have a function that will accept the browser object as an argument and return a function that will accept URL as an argument and generate a report after passing that URL to the lighthouse.
We are passing the following arguments to the lighthouse:
The address we want to analyze;
lighthouse options, browser port in particular, and output (output format of the report);
report configuration and lighthouse:full (all we can measure). For more precise configuration, check the documentation.
Wonderful! We now have our report. But what we can do with it? Well, we can check the metrics against the limits and exit script with non-zero code which will stop the pipeline:
if (report.categories.performance.score < 0.8) process.exit(1);
But we just want to make performance visible and non-blocking? Then let’s adopt another artifact type: GitLab performance artifact.
GitLab Performance Artifact
In order to understand this artifacts format, we have to read the code of the sitespeed.io plugin. (Why can’t GitLab describe the format of their artifacts inside their own documentation? Mystery.)
[ { "subject":"/", "metrics":[ { "name":"Transfer Size (KB)", "value":"19.5", "desiredSize":"smaller" }, { "name":"Total Score", "value":92, "desiredSize":"larger" }, {…} ] }, {…} ]
An artifact is a JSON file that contains an array of the objects. Each of them represents a report about one URL.
[{page 1}, {page 2}, …]
Each page is represented by an object with the next attributes:
subject Page identifier (it’s quite handy to use such a pathname);
metrics An array of the objects (each of them represents one measurement that was made on the page).
{ "subject":"/login/", "metrics":[{measurement 1}, {measurement 2}, {measurement 3}, …] }
A measurement is an object that contains the following attributes:
name Measurement name, e.g. it may be Time to first byte or Time to interactive.
value Numeric measurement result.
desiredSize If target value should be as small as possible, e.g. for the Time to interactive metric, then the value should be smaller. If it should be as large as possible, e.g. for the lighthouse Performance score, then use larger.
{ "name":"Time to first byte (ms)", "value":240, "desiredSize":"smaller" }
Let’s modify our buildReport function in a way that it returns a report for one page with standard lighthouse metrics.

Screenshot with lighthouse report. There are performance score, a11y score, best practices score, SEO score. (Large preview)
const buildReport = browser => async url => { // … const metrics = [ { name: report.categories.performance.title, value: report.categories.performance.score, desiredSize: 'larger', }, { name: report.categories.accessibility.title, value: report.categories.accessibility.score, desiredSize: 'larger', }, { name: report.categories['best-practices'].title, value: report.categories['best-practices'].score, desiredSize: 'larger', }, { name: report.categories.seo.title, value: report.categories.seo.score, desiredSize: 'larger', }, { name: report.categories.pwa.title, value: report.categories.pwa.score, desiredSize: 'larger', }, ]; return { subject: url, metrics: metrics, }; }
Now, when we have a function that generates a report. Let’s apply it to each type of the pages of the project. First, I need to state that process.env.DOMAIN should contain a staging domain (to which you need to deploy your project from a feature branch beforehand).
+ const fs = require('fs'); const lighthouse = require('lighthouse'); const puppeteer = require('puppeteer'); const DOMAIN = process.env.DOMAIN; const buildReport = browser => async url => {/* … */}; + const urls = [ + '/inloggen', + '/wachtwoord-herstellen-otp', + '/lp/service', + '/send-request-to/ww-tammer', + '/post-service-request/binnenschilderwerk', + ]; (async () => { const browser = await puppeteer.launch({ args: ['--no-sandbox', '--disable-setuid-sandbox', '--headless'], }); + const builder = buildReport(browser); + const report = []; + for (let url of urls) { + const metrics = await builder(url); + report.push(metrics); + } + fs.writeFileSync(`./performance.json`, JSON.stringify(report)); + await browser.close(); })();
You can find the full source in this gist and working example in this repository.
Note: At this point, you may want to interrupt me and scream in vain, “Why are you taking up my time — you can’t even use Promise.all properly!” In my defense, I dare say, that it is not recommended to run more than one lighthouse instance at the same time because this adversely affects the accuracy of the measurement results. Also, if you do not show due ingenuity, it will lead to an exception.
Use Of Multiple Processes
Are you still into parallel measurements? Fine, you may want to use node cluster (or even Worker Threads if you like playing bold), but it makes sense to discuss it only in the case when your pipeline running on the environment with multiple available cors. And even then, you should keep in mind that because of the Node.js nature you will have full-weight Node.js instance spawned in each process fork ( instead of reusing the same one which will lead to growing RAM consumption). All of this means that it will be more costly because of the growing hardware requirement and a little bit faster. It may appear that the game is not worth the candle.
If you want to take that risk, you will need to:
Split the URL array to chunks by cores number;
Create a fork of a process according to the number of the cores;
Transfer parts of the array to the forks and then retrieve generated reports.
To split an array, you can use multpile approaches. The following code — written in just a couple of minutes — wouldn’t be any worse than the others:
/** * Returns urls array splited to chunks accordin to cors number * * @param urls {String[]} — URLs array * @param cors {Number} — count of available cors * @return {Array<String[]>} — URLs array splited to chunks */ function chunkArray(urls, cors) { const chunks = [...Array(cors)].map(() => []); let index = 0; urls.forEach((url) => { if (index > (chunks.length - 1)) { index = 0; } chunks[index].push(url); index += 1; }); return chunks; }
Make forks according to cores count:
// Adding packages that allow us to use cluster const cluster = require('cluster'); // And find out how many cors are available. Both packages are build-in for node.js. const numCPUs = require('os').cpus().length; (async () => { if (cluster.isMaster) { // Parent process const chunks = chunkArray(urls, urls.length/numCPUs); chunks.map(chunk => { // Creating child processes const worker = cluster.fork(); }); } else { // Child process } })();
Let’s transfer an array of chunks to child processes and retrive reports back:
(async () => { if (cluster.isMaster) { // Parent process const chunks = chunkArray(urls, urls.length/numCPUs); chunks.map(chunk => { const worker = cluster.fork(); + // Send message with URL’s array to child process + worker.send(chunk); }); } else { // Child process + // Recieveing message from parent proccess + process.on('message', async (urls) => { + const browser = await puppeteer.launch({ + args: ['--no-sandbox', '--disable-setuid-sandbox', '--headless'], + }); + const builder = buildReport(browser); + const report = []; + for (let url of urls) { + // Generating report for each URL + const metrics = await builder(url); + report.push(metrics); + } + // Send array of reports back to the parent proccess + cluster.worker.send(report); + await browser.close(); + }); } })();
And, finally, reassemble reports to one array and generate an artifact.
Check out the full code and repository with an example that shows how to use lighthouse with multiple processes.
Accuracy Of Measurements
Well, we parallelized the measurements, which increased the already unfortunate large measurement error of the lighthouse. But how do we reduce it? Well, make a few measurements and calculate the average.
To do so, we will write a function that will calculate the average between current measurement results and previous ones.
// Count of measurements we want to make const MEASURES_COUNT = 3; /* * Reducer which will calculate an avarage value of all page measurements * @param pages {Object} — accumulator * @param page {Object} — page * @return {Object} — page with avarage metrics values */ const mergeMetrics = (pages, page) => { if (!pages) return page; return { subject: pages.subject, metrics: pages.metrics.map((measure, index) => { let value = (measure.value + page.metrics[index].value)/2; value = +value.toFixed(2); return { ...measure, value, } }), } }
Then, change our code to use them:
process.on('message', async (urls) => { const browser = await puppeteer.launch({ args: ['--no-sandbox', '--disable-setuid-sandbox', '--headless'], }); const builder = buildReport(browser); const report = []; for (let url of urls) { + // Let’s measure MEASURES_COUNT times and calculate the avarage + let measures = []; + let index = MEASURES_COUNT; + while(index--){ const metric = await builder(url); + measures.push(metric); + } + const measure = measures.reduce(mergeMetrics); report.push(measure); } cluster.worker.send(report); await browser.close(); }); }
Check out the gist with the full code and repository with an example.
And now we can add lighthouse into the pipeline.
Adding It To The Pipeline
First, create a configuration file named .gitlab-ci.yml.
image: node:latest stages: # You need to deploy a project to staging and put the staging domain name # into the environment variable DOMAIN. But this is beyond the scope of this article, # primarily because it is very dependent on your specific project. # - deploy # - performance lighthouse: stage: performance before_script: - apt-get update - apt-get -y install gconf-service libasound2 libatk1.0-0 libatk-bridge2.0-0 libc6 libcairo2 libcups2 libdbus-1-3 libexpat1 libfontconfig1 libgcc1 libgconf-2-4 libgdk-pixbuf2.0-0 libglib2.0-0 libgtk-3-0 libnspr4 libpango-1.0-0 libpangocairo-1.0-0 libstdc++6 libx11-6 libx11-xcb1 libxcb1 libxcomposite1 libxcursor1 libxdamage1 libxext6 libxfixes3 libxi6 libxrandr2 libxrender1 libxss1 libxtst6 ca-certificates fonts-liberation libappindicator1 libnss3 lsb-release xdg-utils wget - npm ci script: - node lighthouse.js artifacts: expire_in: 7 days paths: - performance.json reports: performance: performance.json
The multiple installed packages are needed for the puppeteer. As an alternative, you may consider using docker. Aside from that, it makes sense to the fact that we set the type of artifact as performance. And, as soon as both master and feature branch will have it, you will see a widget like this in the merge request:
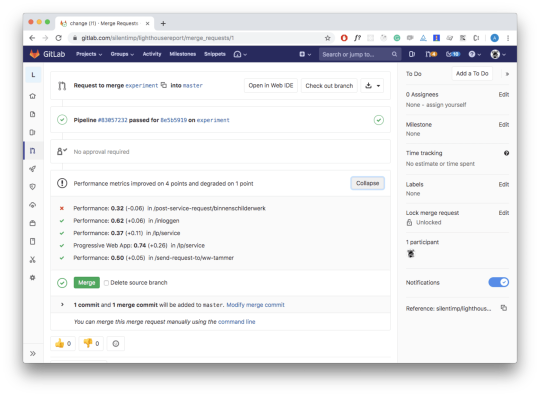
A screenshot of the merge request page. There is a widget that shows which lighthouse metrics have changed and how exactly. (Large preview)
Nice?
Resume
We are finally done with a more complex case. Obviously, there are multiple similar tools aside from the lighthouse. For example, sitespeed.io. GitLab documentation even contains an article that explains how to use sitespeed in the GitLab’s pipeline. There is also a plugin for GitLab that allows us to generate an artifact. But who would prefer community-driven open-source products to the one owned by a corporate monster?
Ain’t No Rest For The Wicked
It may seem that we’re finally there, but no, not yet. If you are using a paid GitLab version, then artifacts with report types metrics and performance are present in the plans starting from premium and silver which cost $19 per month for each user. Also, you can’t just buy a specific feature you need — you can only change the plan. Sorry. So what we can do? In distinction from GitHub with its Checks API and Status API, GitLab wouldn’t allow you to create an actual widget in the merge request yourself. And there is no hope to get them anytime soon.

A screenshot of the tweet posted by Ilya Klimov (GitLab employee) who wrote about the probability of appearance analogs for Github Checks and Status API. (Large preview)
One way to check whether you actually have support for these features: You can search for the environment variable GITLAB_FEATURES in the pipeline. If it lacks merge_request_performance_metrics and metrics_reports in the list, then this features are not supported.
GITLAB_FEATURES=audit_events,burndown_charts,code_owners,contribution_analytics, elastic_search, export_issues,group_bulk_edit,group_burndown_charts,group_webhooks, issuable_default_templates,issue_board_focus_mode,issue_weights,jenkins_integration, ldap_group_sync,member_lock,merge_request_approvers,multiple_issue_assignees, multiple_ldap_servers,multiple_merge_request_assignees,protected_refs_for_users, push_rules,related_issues,repository_mirrors,repository_size_limit,scoped_issue_board, usage_quotas,visual_review_app,wip_limits
If there is no support, we need to come up with something. For example, we may add a comment to the merge request, comment with the table, containing all the data we need. We can leave our code untouched — artifacts will be created, but widgets will always show a message «metrics are unchanged».
Very strange and non-obvious behavior; I had to think carefully to understand what was happening.
So, what’s the plan?
We need to read artifact from the master branch;
Create a comment in the markdown format;
Get the identifier of the merge request from the current feature branch to the master;
Add the comment.
How To Read Artifact From The Master Branch
If we want to show how performance metrics are changed between master and feature branches, we need to read artifact from the master. And to do so, we will need to use fetch.
npm i -S isomorphic-fetch
// You can use predefined CI environment variables // @see https://gitlab.com/help/ci/variables/predefined_variables.md // We need fetch polyfill for node.js const fetch = require('isomorphic-fetch'); // GitLab domain const GITLAB_DOMAIN = process.env.CI_SERVER_HOST || process.env.GITLAB_DOMAIN || 'gitlab.com'; // User or organization name const NAME_SPACE = process.env.CI_PROJECT_NAMESPACE || process.env.PROJECT_NAMESPACE || 'silentimp'; // Repo name const PROJECT = process.env.CI_PROJECT_NAME || process.env.PROJECT_NAME || 'lighthouse-comments'; // Name of the job, which create an artifact const JOB_NAME = process.env.CI_JOB_NAME || process.env.JOB_NAME || 'lighthouse'; /* * Returns an artifact * * @param name {String} - artifact file name * @return {Object} - object with performance artifact * @throw {Error} - thhrow an error, if artifact contain string, that can’t be parsed as a JSON. Or in case of fetch errors. */ const getArtifact = async name => { const response = await fetch(`https://${GITLAB_DOMAIN}/${NAME_SPACE}/${PROJECT}/-/jobs/artifacts/master/raw/${name}?job=${JOB_NAME}`); if (!response.ok) throw new Error('Artifact not found'); const data = await response.json(); return data; };
Creating A Comment Text
We need to build comment text in the markdown format. Let’s create some service funcions that will help us:
/** * Return part of report for specific page * * @param report {Object} — report * @param subject {String} — subject, that allow find specific page * @return {Object} — page report */ const getPage = (report, subject) => report.find(item => (item.subject === subject)); /** * Return specific metric for the page * * @param page {Object} — page * @param name {String} — metrics name * @return {Object} — metric */ const getMetric = (page, name) => page.metrics.find(item => item.name === name); /** * Return table cell for desired metric * * @param branch {Object} - report from feature branch * @param master {Object} - report from master branch * @param name {String} - metrics name */ const buildCell = (branch, master, name) => { const branchMetric = getMetric(branch, name); const masterMetric = getMetric(master, name); const branchValue = branchMetric.value; const masterValue = masterMetric.value; const desiredLarger = branchMetric.desiredSize === 'larger'; const isChanged = branchValue !== masterValue; const larger = branchValue > masterValue; if (!isChanged) return `${branchValue}`; if (larger) return `${branchValue} ${desiredLarger ? '💚' : '💔' } **+${Math.abs(branchValue - masterValue).toFixed(2)}**`; return `${branchValue} ${!desiredLarger ? '💚' : '💔' } **-${Math.abs(branchValue - masterValue).toFixed(2)}**`; }; /** * Returns text of the comment with table inside * This table contain changes in all metrics * * @param branch {Object} report from feature branch * @param master {Object} report from master branch * @return {String} comment markdown */ const buildCommentText = (branch, master) =>{ const md = branch.map( page => { const pageAtMaster = getPage(master, page.subject); if (!pageAtMaster) return ''; const md = `|${page.subject}|${buildCell(page, pageAtMaster, 'Performance')}|${buildCell(page, pageAtMaster, 'Accessibility')}|${buildCell(page, pageAtMaster, 'Best Practices')}|${buildCell(page, pageAtMaster, 'SEO')}| `; return md; }).join(''); return ` |Path|Performance|Accessibility|Best Practices|SEO| |--- |--- |--- |--- |--- | ${md} `; };
Script Which Will Build A Comment
You will need to have a token to work with GitLab API. In order to generate one, you need to open GitLab, log in, open the ‘Settings’ option of the menu, and then open ‘Access Tokens’ found on the left side of the navigation menu. You should then be able to see the form, which allows you to generate the token.

Screenshot, that shows token generation form and menu options I have mentioned above. (Large preview)
Also, you will need an ID of the project. You can find it in the repository ‘Settings’ (in the submenu ‘General’):

Screenshot shows settings page, where you can find Project ID. (Large preview)
To add a comment to the merge request, we need to know its ID. Function that allows you to acquire merge request ID looks like this:
// You can set environment variables via CI/CD UI. // @see https://gitlab.com/help/ci/variables/README#variables // I have set GITLAB_TOKEN this way // ID of the project const GITLAB_PROJECT_ID = process.env.CI_PROJECT_ID || '18090019'; // Token const TOKEN = process.env.GITLAB_TOKEN; /** * Returns iid of the merge request from feature branch to master * @param from {String} — name of the feature branch * @param to {String} — name of the master branch * @return {Number} — iid of the merge request */ const getMRID = async (from, to) => { const response = await fetch(`https://${GITLAB_DOMAIN}/api/v4/projects/${GITLAB_PROJECT_ID}/merge_requests?target_branch=${to}&source_branch=${from}`, { method: 'GET', headers: { 'PRIVATE-TOKEN': TOKEN, } }); if (!response.ok) throw new Error('Merge request not found'); const [{iid}] = await response.json(); return iid; };
We need to get a feature branch name. You may use the environment variable CI_COMMIT_REF_SLUG inside the pipeline. Outside of the pipeline, you can use the current-git-branch package. Also, you will need to form a message body.
Let’s install the packages we need for this matter:
npm i -S current-git-branch form-data
And now, finally, function to add a comment:
const FormData = require('form-data'); const branchName = require('current-git-branch'); // Branch from which we are making merge request // In the pipeline we have environment variable `CI_COMMIT_REF_NAME`, // which contains name of this banch. Function `branchName` // will return something like «HEAD detached» message in the pipeline. // And name of the branch outside of pipeline const CURRENT_BRANCH = process.env.CI_COMMIT_REF_NAME || branchName(); // Merge request target branch, usually it’s master const DEFAULT_BRANCH = process.env.CI_DEFAULT_BRANCH || 'master'; /** * Adding comment to merege request * @param md {String} — markdown text of the comment */ const addComment = async md => { const iid = await getMRID(CURRENT_BRANCH, DEFAULT_BRANCH); const commentPath = `https://${GITLAB_DOMAIN}/api/v4/projects/${GITLAB_PROJECT_ID}/merge_requests/${iid}/notes`; const body = new FormData(); body.append('body', md); await fetch(commentPath, { method: 'POST', headers: { 'PRIVATE-TOKEN': TOKEN, }, body, }); };
And now we can generate and add a comment:
cluster.on('message', (worker, msg) => { report = [...report, ...msg]; worker.disconnect(); reportsCount++; if (reportsCount === chunks.length) { fs.writeFileSync(`./performance.json`, JSON.stringify(report)); + if (CURRENT_BRANCH === DEFAULT_BRANCH) process.exit(0); + try { + const masterReport = await getArtifact('performance.json'); + const md = buildCommentText(report, masterReport) + await addComment(md); + } catch (error) { + console.log(error); + } process.exit(0); } });
Check the gist and demo repository.
Now create a merge request and you will get:

A screenshot of the merge request which shows comment with a table that contains a table with lighthouse metrics change. (Large preview)
Resume
Comments are much less visible than widgets but it’s still much better than nothing. This way we can visualize the performance even without artifacts.
Authentication
OK, but what about authentication? The performance of the pages that require authentication is also important. It’s easy: we will simply log in. puppeteer is essentially a fully-fledged browser and we can write scripts that mimic user actions:
const LOGIN_URL = '/login'; const USER_EMAIL = process.env.USER_EMAIL; const USER_PASSWORD = process.env.USER_PASSWORD; /** * Authentication sctipt * @param browser {Object} — browser instance */ const login = async browser => { const page = await browser.newPage(); page.setCacheEnabled(false); await page.goto(`${DOMAIN}${LOGIN_URL}`, { waitUntil: 'networkidle2' }); await page.click('input[name=email]'); await page.keyboard.type(USER_EMAIL); await page.click('input[name=password]'); await page.keyboard.type(USER_PASSWORD); await page.click('button[data-testid="submit"]', { waitUntil: 'domcontentloaded' }); };
Before checking a page that requires authentication, we may just run this script. Done.
Summary
In this way, I built the performance monitoring system at Werkspot — a company I currently work for. It’s great when you have the opportunity to experiment with the bleeding edge technology.
Now you also know how to visualize performance change, and it’s sure to help you better track performance degradation. But what comes next? You can save the data and visualize it for a time period in order to better understand the big picture, and you can collect performance data directly from the users.
0 notes
Text
Otus: Infrastructure Engineer

Headquarters: Chicago, IL URL: http://www.otus.com
Otus is creating a culture of success while maximizing learning in the K-12 space. We do this by implementing amazing ideas from awesome people and we need more awesomeness on our team. Are you passionate, collaborative, love to geek out on technology, and want to work for a mission-driven company that is shaping the way teachers, students and parents of students learn together? If so, we want to hear from you.
Our diverse team consists of talented designers, developers, coaches, and leaders who share a variety of interests. You'll find musicians, world travelers, beer enthusiasts, nerds, sports fans, and all-around great people who shape our positive culture.
Your Role
We are looking for a talented and highly motivated Infrastructure Engineer to help bring the best possible software solutions to educators.
As an early member of a growing team, you must possess a strong work ethic and be upbeat, driven, intelligent, well-organized, articulate, share a passion for learning new technologies, and thrive in a fun, fast-paced environment.
You will have the opportunity to immediately contribute and see the results of your work in use by students, teachers, parents and district administrators across the country.
Responsibilities
Otus is building a next generation Platform for EdTech in order to support our transformative vision for K-12 education across the US and the globe.
This role will be focused on the following areas:
A core HA platform built on public cloud infrastructure for a microservice architecture (Kubernetes and EKS)
A brand new data and event platform based on high throughput streaming tech (Kafka)
Contemporary operations tooling, metrics and monitoring (Prometheus, OpenTracing, modern APM)
CI/CD pipelines with Blue/Green and Canary deploys (Codefresh)
AWS Infra as code (Terraform)
You should be able to apply skills and knowledge to operational concerns. Be a developer, not a systems administrator
Qualifications
K8s - You have managed production workloads on Kubernetes (EKS preferred)
TF - You have built and managed Terraform-based AWS infrastructure
Traffic - Your infrastructure regularly sees over 2500 RPS
Skill - You have worked on as a solo act on very small teams that move fast
Impact - You achieve maximum results with minimal direction
Ownership and accountability - You own the things that you build
Drive - When you see a need, you fill a need. You can step in where you see a need and push us all forward
Nice to Haves
Kafka experience (via a managed service)
Codefresh experience
Benefits and Perks
Competitive salary and professional development spending
20 PTO days a year, plus a day off for your birthday (or a loved one’s), an interest day (to do something you love), and paid holidays
Up to 12 weeks of parental leave and great work/life balance
Flexible hours and work from home policy so you can be at your most productive
Excellent medical, dental, and vision insurance
Life Insurance and disability benefits
401K with an employer match (up to 4%)
Otus is an Equal Opportunity Employer and embraces diversity of every kind. You must be legally authorized to work in the US. Unfortunately, the company is unable to support sponsorships at this time.
To apply: https://otus.recruiterbox.com/jobs/fk03ymr?source=WeWorkRemotely
from We Work Remotely: Remote jobs in design, programming, marketing and more https://ift.tt/2SLqyYv from Work From Home YouTuber Job Board Blog https://ift.tt/2SNvR9F
0 notes
Link
And then what they end up doing is creating 50 deployables, but it’s really a distributed monolith. So it’s actually the same thing, but instead of function calls and class instantiation, they’re initiating things and throwing it over a network and hoping that it comes back. And since they can’t reliably make it come back, they introduce things like Prometheus, OpenTracing, all of this stuff
0 notes