#kubernets
Explore tagged Tumblr posts
Visit Tumblr Blog
Explore Tumblr blogs with no restrictions, modern design and the best experience.
Last Seen Tumblr Blogs


Fun Fact
The Tumblr office adopted Tommy, an 11-year-old Pomeranian.
Text
Troubleshooting Kubernetes Service Exposure with Minikube
Introduction In the world of Kubernetes, managing and exposing services can sometimes be a challenging task, especially when dealing with deprecated commands and network configurations. Recently, I encountered an issue while following instructions from the book Kubernetes in Action. The command kubectl run kubia --image=luksa/kubia --port=8080 --generator=run/v1 did not work due to its…
0 notes
Text
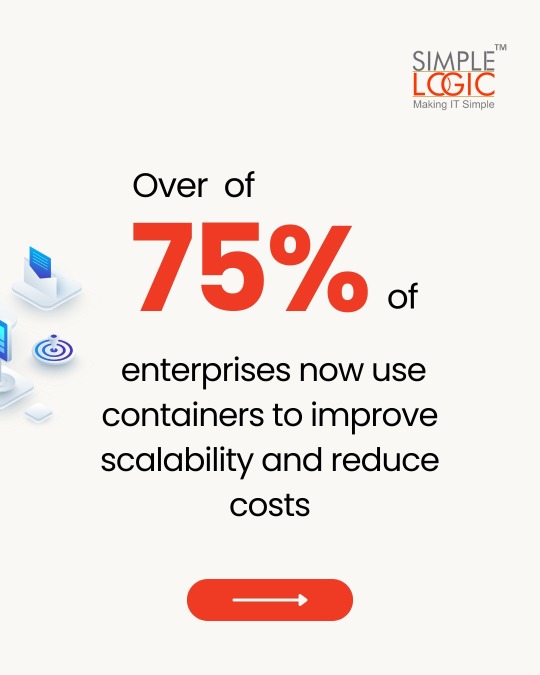

#TechKnowledge Have you heard of Containerization?
Swipe to discover what it is and how it can impact your digital security! 🚀
👉 Stay tuned for more simple and insightful tech tips by following us.
🌐 Learn more: https://simplelogic-it.com/
💻 Explore the latest in #technology on our Blog Page: https://simplelogic-it.com/blogs/
✨ Looking for your next career opportunity? Check out our #Careers page for exciting roles: https://simplelogic-it.com/careers/
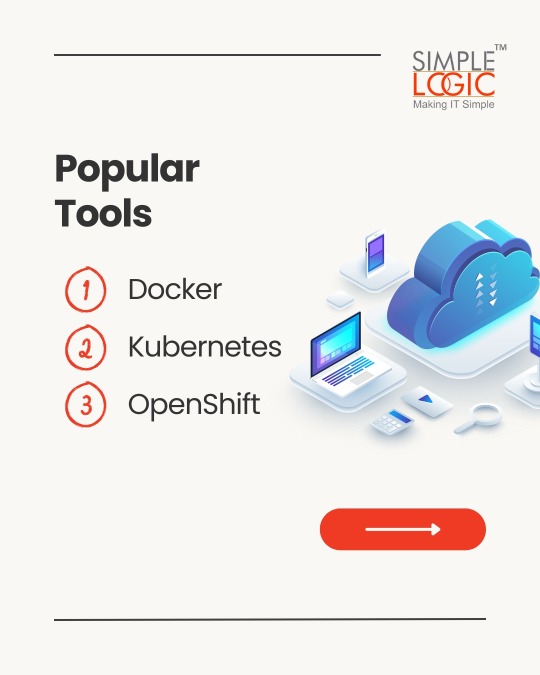
#techterms#technologyterms#techcommunity#simplelogicit#makingitsimple#techinsight#techtalk#containerization#application#development#testing#deployment#devops#docker#kubernets#openshift#scalability#security#knowledgeIispower#makeitsimple#simplelogic#didyouknow
0 notes
Text
Compute Engine’s latest N4 and C4 VMs boosts performance

Customers’ workloads are diverse, consisting of multiple services and components with distinct technical requirements. A uniform approach hinders their ability to scale while attempting to maintain cost and performance equilibrium.
In light of this, Google cloud introduced the C4 and N4 machine series, two new additions to their general-purpose virtual machine portfolio, at Google Cloud Next ’24 last month. The first machine series from a major cloud provider, the C4 and N4, are driven by Google’s Titanium, a system of specially designed micro controllers and tiered scale-out offloads, and make use of the newest 5th generation Intel Xeon processors (code-named Emerald Rapids).
C4 and N4 provide the best possible combination of cost-effectiveness and performance for a wide range of general-purpose workload requirements. While N4’s price-performance gains and flexible configurations, such as extended memory and custom shapes, let you choose different combinations of compute and memory to optimise costs and reduce resource waste for the rest of your workloads, C4 tackles demanding workloads with industry-leading performance.
C4 and N4 are built to satisfy all of your general-purpose computing needs, regardless of whether your workload demands constant performance for mission-critical operations or places a higher priority on adaptability and cost optimisation. The C4 machine series is currently available in preview for Compute Engine and Google Kubernetes Engine (GKE), while the N4 machine series is currently available broadly.
N4: Flexible forms and price-performance gains
The N4 machine series has an efficient architecture with streamlined features, forms, and next-generation Dynamic Resource Management, all designed from the bottom up for price-performance advantages and cost optimisation. With up to 18% better price-performance than N2 instances and up to 70% better price-performance than instances, N4 helps you reduce your total cost of ownership (TCO) for a variety of workloads as compared to prior generation N-Family instances. N4 offers up to 39% better price-performance for My SQL workloads and up to 75% better price-performance for Java applications as compared to N2 across key workloads.Image credit to Google cloud
Additionally, N4 offers you the most flexibility possible to accommodate changing workload requirements with bespoke shapes that provide you with fine-grained resource control. Custom shapes add a cost optimisation lever that is now exclusive to Google Cloud by letting you only pay for what you use, preventing you from overspending on memory or vCPU. Additionally, custom shapes provide seamless, reconfiguration-free migrations from on-premises to the cloud or from another cloud provider to Google, as well as optimisation for special workload patterns with unusual resource requirements.
In order to support a wider range of applications, N4 additionally offers 4x more preconfigured shapes at significantly bigger sizes up to 80 vCPUs and 640GB of DDR5 RAM as compared to similar offerings from other top cloud providers. Predefined forms for N4 are offered in three configurations: regular (4GB/vCPU), high-mem (8GB/vCPU), and high-cpu (2GB/vCPU).
In comparison to other cloud providers, N4 delivers up to 4 times the usual networking speed (50 Gbps standard) and up to 160K IOPS with Hyperdisk Balanced. Most general-purpose workloads, including medium-traffic web and application servers, dev/test environments, virtual desktops, micro services, business intelligence applications, batch processing, data analytics, storage and archiving, and CRM applications, are well-suited for N4. These workloads require a balance between performance and cost-efficiency.
Dynamic Resource Management
On N4 and Titanium, Google’s next-generation Dynamic Resource Management (DRM) improves upon current optimisation techniques to deliver a greater price-performance, reduce expenses, and support a wider range of applications.
Google cloud worldwide infrastructure is supported by a Google-only technology called dynamic resource management, which handles workloads for YouTube, Ads, and Search. The most recent iteration of dynamic resource management uses Titanium to precisely forecast and consistently deliver the necessary performance for your workloads. Dynamic resource management on N4 offers shown dependability, efficiency, and performance at scale.
C4: Cutting-edge features and performance in the industry
C4 is designed to handle your most demanding workloads. It comes with the newest generation of compute and memory, Titanium network and storage offloads, and enhanced performance and maintenance capabilities. When compared to similar services from other top cloud providers, C4 offers up to 20% better price-performance; when compared to the previous generation C3 VM, C4 offers up to 25% better price-performance across important workloads.Image Credit to Google cloud
In addition, C4’s Titanium technology provides up to 80% greater CPU responsiveness than prior generations for real-time applications like gaming and high-frequency trading, which leads to quicker trades and a more fluid gaming experience12. Demanding databases and caches, network appliances, high-traffic web and application servers, online gaming, analytics, media streaming, and real-time CPU-based inference with Intel AMX are all excellent fits for the high performance of C4.
Additionally, C4 transfers processing for virtual storage to the Titanium adapter, which enhances infrastructure stability, security, performance, and lifecycle management. Titanium enables C4 to provide scalable, high-performance I/O with up to 500k IOPS, 10 GB/s throughput on Hyperdisk, and networking bandwidth of up to 200 Gbps13.
Better maintenance controls are another feature that C4 provides, allowing for less frequent and disruptive planned maintenance with increased predictability and control. C4 instances can support up to 1.5TB of DDR5 RAM and 192 vCPUs. Standard, high-memory, and high-processor variants are offered. Customers of Compute Engine and Google Kubernetes Engine (GKE) can now access C4 in Preview.
N4 and C4 work well together
They are aware that choosing the ideal virtual machine is critical to your success. You can reduce your overall operating costs without sacrificing performance or workload-specific needs when you use C4 and N4 to handle all of your general-purpose tasks.
Utilise virtual machines (VMs) that expand with your company. Combining C4 and N4 offers you flexible options to mix and combine machine instances according to your various workloads, along with affordable solutions that put performance and reliability first.
Availability
Us-east1 (South Carolina), Us-east4 (Virginia), Us-central1 (Iowa), Europe-west1 (Belgium), Europe-west4 (Netherlands), and Asia-southeast1 (Singapore) currently have widespread access to N4. Customers of Google Kubernetes Engine (GKE) and Compute Engine can now access C4 in Preview.
Read more on Govindhtech.com
0 notes
Text
Building Super Careers: CKA Certification

"Building Super Careers: CKA Certification, Your Secret Weapon!"
Learn the skills you need to manage Kubernetes clusters effectively.
Visit : https://amritahyd.org/
Enroll Now- 90005 80570
#amrita#amritatechnologies#kubernets#cka#linux#linuxcourse#linuxautomation#linuxplatform#redhat#ansible#linux9#containerregistration#rh294course#openshift#automation#rh294#rh188#rhcetraining#rhcetrainingcourse#onlinelearning#applicationdevelopment#linuxuser
0 notes
Text
64 vCPU/256 GB ram/2 TB SSD EC2 instance with #FreeBSD or Debian Linux as OS 🔥
38 notes
·
View notes
Text
thinking about that one girl i used to see whose safe word was kubernetes. She works for big tech now
3 notes
·
View notes
Text
documenting this product already forced me to halfway learn about kubernetes but now I have to wrap my head around linux subsystems and general networking shit too

9 notes
·
View notes
Text
Ready to future-proof your applications and boost performance? Discover how PHP microservices can transform your development workflow! 💡
In this powerful guide, you'll learn: ✅ What PHP Microservices Architecture really means ✅ How to break a monolithic app into modular services ✅ Best tools for containerization like Docker & Kubernetes ✅ API Gateway strategies and service discovery techniques ✅ Tips on error handling, security, and performance optimization
With real-world examples and practical steps, this guide is perfect for developers and teams aiming for faster deployment, independent scaling, and simplified maintenance.
🎯 Whether you’re a solo developer or scaling a product, understanding microservices is the key to next-level architecture.
🌐 Brought to you by Orbitwebtech, Best Web Development Company in the USA, helping businesses build powerful and scalable web solutions.
📖 Start reading now and give your PHP projects a cutting-edge upgrade!
2 notes
·
View notes
Text
CHECK FOR THINGS THAT PHYSICALLY EXIST BUT HAVE NOT BEEN PERCEIVED YET
INCORPORATE MORE ACCURATE PHYSICAL REALITY INTO GAME
#CHECK FOR THINGS THAT PHYSICALLY EXIST BUT HAVE NOT BEEN PERCEIVED YET#taylor swift#INCORPORATE MORE ACCURATE PHYSICAL REALITY INTO GAME#VIRTUAL MACHINES#VIRTUAL MACHINE#vmware#container#kubernetes#zero trust#microsoft#cisa.gov#pluralsight#pluralsight.com#Wikipedia#wikipedia#wikimedia commons#wii sports wiki#wikipedia.org
18 notes
·
View notes
Text
#self hosted#kubernetes#docker#home server#linux#sorry everyone without a server#no “i'm bald” option for you#you can queue this for a day from now ig
4 notes
·
View notes
Text
so at work theres a kubernetes command called kgpo that is used to list pods and i just mentally call it the "kagepro" command :p
4 notes
·
View notes
Text
Opentelemetry vs Prometheus: Opentelemetry Overview

Opentelemetry vs Prometheus
Prometheus monitors, stores, and visualises metrics but does not keep logs or support traces for root cause analysis. The application cases of Prometheus are more limited than OpenTelemetry.
Programming language-agnostic integrations allow OpenTelemetry to track more complicated metrics than Prometheus. Automated instrumentation models make OTel more scalable and extensible than the Prometheus. OpenTelemetry requires a back-end infrastructure and no storage solution, unlike Prometheus.
Quick summary Prometheus calculates cumulative measurements as a total, whereas OpenTelemetry uses deltas. Prometheus stores short-term data and metrics, whereas OTel may be used with a storage solution. OpenTelemetry uses a consolidated API to send or pull metrics, logs, and traces and transform them into a single language, unlike Prometheus. Prometheus pulls data from hosts to collect and store time-series metrics. OTel can translate measurements and is language agonistic, providing developers additional options. Data and metrics are aggregated by Prometheus using PromQL. Web-visualized metrics and customisable alarms are provided by Prometheus. Integration with visualisation tools is required for OpenTelemetry. OTel represents metric values as integers instead of floating-point numbers, which are more precise and understandable. Prometheus cannot use integer metrics. Your organization’s demands will determine which option is best. OpenTelemetry may be better for complex contexts with dispersed systems, data holistic comprehension, and flexibility. This also applies to log and trace monitoring.
Prometheus may be suited for monitoring specific systems or processes using alerting, storage, and visualisation models.
Prometheus and OpenTelemetry Application performance monitoring and optimisation are crucial for software developers and companies. Enterprises have more data to collect and analyse as they deploy more applications. Without the correct tools for monitoring, optimising, storing, and contextualising data, it’s useless.
Monitoring and observability solutions can improve application health by discovering issues before they happen, highlighting bottlenecks, dispersing network traffic, and more. These capabilities reduce application downtime, improve performance, and enhance user experience.
App monitoring tools OpenTelemetry and the Prometheus are open-source Cloud Native Computing Foundation (CNCF) initiatives. An organization’s goals and application specifications determine which data and functions need which solutions. Before using OpenTelemetry or Prometheus, you should know their main distinctions and what they offer.
Java Opentelemetry OTel exports these three forms of telemetry data to Prometheus and other back ends. This lets developers chose their analysis tools and avoids vendor or back-end lock-in. OpenTelemetry integrates with many platforms, including Prometheus, to increase observability. Its flexibility increases because OTel supports Java, Python, JavaScript, and Go. Developers and IT staff may monitor performance from any browser or location.
Its ability to gather and export data across multiple applications and standardise the collecting procedure make OpenTelemetry strong. OTel enhances distributed system and the microservice observability.
For application monitoring, OpenTelemetry and Prometheus integrate and operate well together. The DevOps and IT teams can use OpenTelemetry and Prometheus to collect and transform information for performance insights.
Opentelemetry-demo OpenTelemetry (OTel) helps generate, collect, export, and manage telemetry data including logs, metrics, and traces in one place. OTel was founded by OpenCensus and OpenTracing to standardise data gathering through APIs, SDKs, frameworks, and integrations. OTel lets you build monitoring outputs into your code to ease data processing and export data to the right back end.
Telemetry data helps determine system health and performance. Optimised observability speeds up troubleshooting, improves system reliability, reduces latency, and reduces application downtime.
Opentelemetry architecture APIs OpenTelemetry APIs uniformly translate programming languages. This lets APIs capture telemetry data. These APIs help standardise OpenTelemetry measurements.
SDKs Software development tools. Frameworks, code libraries, and debuggers are software development building elements. OTel SDKs implement OpenTelemetry APIs and provide telemetry data generation and collection tools.
OpenTelemetry collector The OpenTelemetry collector accepts, processes, and exports telemetry data. Set OTel collectors to filter specified data types to the back end.
Instrumentation library OTel offers cross-platform instrumentation. The instrumentation libraries let OTel integrate with any programming language.
Opentelemetry collector contrib Telemetry data including metrics, logs, and traces can be collected without modifying code or metadata using the OpenTelemetry protocol (OTLP).
Metrics A high-level overview of system performance and health is provided via metrics. Developers, IT, and business management teams decide what metrics to track to fulfil business goals for application performance. A team may measure network traffic, latency, and CPU storage. You may also track application performance trends with metrics.
Logs Logs record programme or application events. DevOps teams can monitor component properties with logs. Historical data might demonstrate performance, thresholds exceeded, and errors. Logs track application ecosystem health.
Traces Traces provide a broader picture of application performance than logs and aid optimisation. They track a request through the application stack and are more focused than logs. Traces let developers pinpoint when mistakes or bottlenecks occur, how long they remain, and how they effect the user journey. This data improves microservice management and application performance.
What’s Prometheus? Application metrics are collected and organised using Prometheus, a monitoring and alerting toolkit. SoundCloud created the Prometheus server before making it open-source.
End-to-end time-series data monitoring is possible using Prometheus. Time-series metrics capture regular data, such as monthly sales or daily application traffic. Visibility into this data reveals patterns, trends, and business planning projections. Prometheus collects application metrics for dedicated functions that DevOps teams want to monitor after integration with a host.
Using PromQL, Prometheus metrics offer data points with the metric name, label, timestamp, and value. For better visualisation, PromQL lets developers and IT departments aggregate data metrics into histograms, graphs, and dashboards. Enterprise databases and exporters are accessible to Prometheus. Application exporters pull metrics from apps and endpoints.
Prometheus tracks four metrics Counters Counters measure increasing numerical values. Counters count completed tasks, faults, and processes or microservices.
Gauges Gauges measure numerical data that fluctuate due to external variables. They can monitor CPU, memory, temperature, and queue size.
Histograms Events like request duration and answer size are measured via histograms. They split the range of these measurements into buckets and count how many fall into each bucket.
Summaries Summaries assess request durations and response size like histograms, but they also count and total all observed values.
Prometheus’ data-driven dashboards and graphs are also useful.
Benefits of Prometheus Prometheus provides real-time application monitoring for accurate insights and fast troubleshooting. It also permits function-specific thresholds. When certain thresholds are hit or exceeded, warnings might speed up problem resolution. Prometheus stores and provides analytics teams with massive amounts of metrics data. It stores data for instant examination, not long-term storage. Prometheus typically stores data for two to fifteen days.
Prometheus works perfectly with Kubernetes, an open-source container orchestration technology for scheduling, managing, and scaling containerised workloads. Kubernetes lets companies create hybrid and multicloud systems with many services and microservices. These complicated systems gain full-stack observability and oversight with Prometheus and Kubernetes.
Grafana Opentelemetry Grafana, a powerful visualisation tool, works with Prometheus to create dashboards, charts, graphs, and alerts. Grafana can visualise metrics with Prometheus. The compatibility between these platforms makes complex data easier to share between teams.
Integration of OpenTelemetry with Prometheus No need to choose OpenTelemetry and Prometheus are compatible. Prometheus data models support OpenTelemetry metrics and OTel SDKs may gather them. Together, these systems provide the best of both worlds and enhanced monitoring. As an example:
When combined, OTel and Prometheus monitor complex systems and deliver real-time application insights. OTel’s tracing and monitoring technologies work with Prometheus’ alerting. Prometheus handles big data. This capability and OTel’s ability to combine metrics, traces, and logs into one interface improve system and application scalability. PromQL can generate visualisation models using OpenTelemetry data. To provide additional monitoring tools, OpenTelemetry and Prometheus interface with IBM Instana and Turbonomic. Instana’s connection map, upstream/downstream service connection, and full-stack visibility let OTel monitor all services. They give the same wonderful experience with OTel data as with all other data sources, providing you the context you need to swiftly detect and address application problems. Turbonomic automates real-time data-driven resourcing choices using Prometheus’ data monitoring capabilities. These optimised integrations boost application ecosystem health and performance.
Read more on Govindhtech.com
#Programming#OpenTelemetry#ibm#kubernets#devops#multicloud#apis#microservices#technology#technews#govindhtech
0 notes
Text


"Level up your career in administration with RHCSA!!
#amrita#amritatechnologies#RHCSA#rhcsa#linuxrhcsa#systemadministrations#linux#kubernets#cka#linuxcourse#linuxautomation#linuxplatform#redhat#ansible#linux9#containerregistration#rh294course#openshift#automation#rh294#rh188#rhcetraining#rhcetrainingcourse#onlinelearning#applicationdevelopment#linuxuser
0 notes
Text
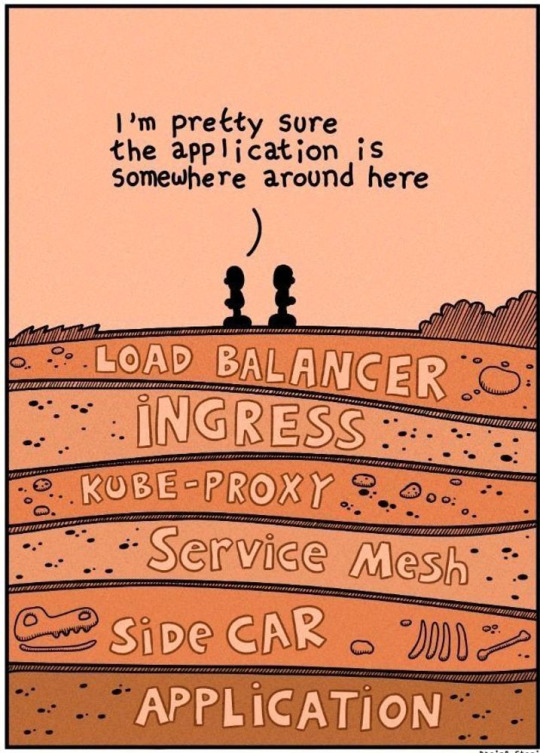
Kubernetes is simple, they say ;-)
79 notes
·
View notes
Text
Load Balancing Web Sockets with K8s/Istio
When load balancing WebSockets in a Kubernetes (K8s) environment with Istio, there are several considerations to ensure persistent, low-latency connections. WebSockets require special handling because they are long-lived, bidirectional connections, which are different from standard HTTP request-response communication. Here’s a guide to implementing load balancing for WebSockets using Istio.
1. Enable WebSocket Support in Istio
By default, Istio supports WebSocket connections, but certain configurations may need tweaking. You should ensure that:
Destination rules and VirtualServices are configured appropriately to allow WebSocket traffic.
Example VirtualService Configuration.
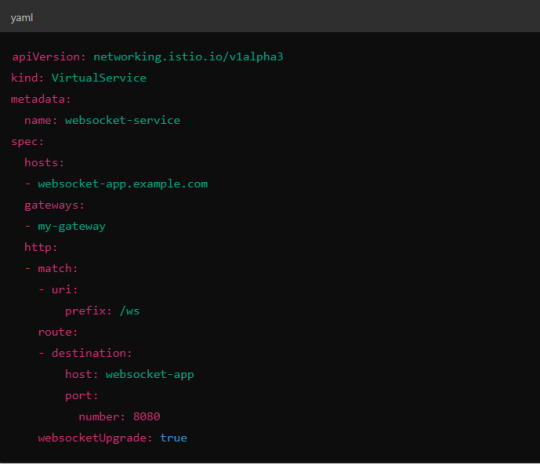
Here, websocketUpgrade: true explicitly allows WebSocket traffic and ensures that Istio won’t downgrade the WebSocket connection to HTTP.
2. Session Affinity (Sticky Sessions)
In WebSocket applications, sticky sessions or session affinity is often necessary to keep long-running WebSocket connections tied to the same backend pod. Without session affinity, WebSocket connections can be terminated if the load balancer routes the traffic to a different pod.
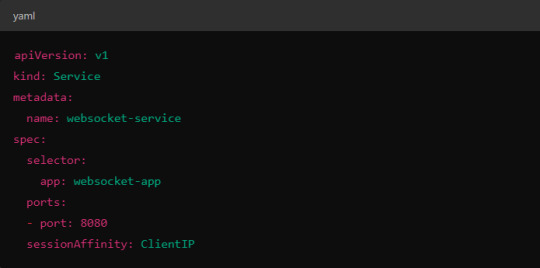
Implementing Session Affinity in Istio.
Session affinity is typically achieved by setting the sessionAffinity field to ClientIP at the Kubernetes service level.
In Istio, you might also control affinity using headers. For example, Istio can route traffic based on headers by configuring a VirtualService to ensure connections stay on the same backend.
3. Load Balancing Strategy
Since WebSocket connections are long-lived, round-robin or random load balancing strategies can lead to unbalanced workloads across pods. To address this, you may consider using least connection or consistent hashing algorithms to ensure that existing connections are efficiently distributed.
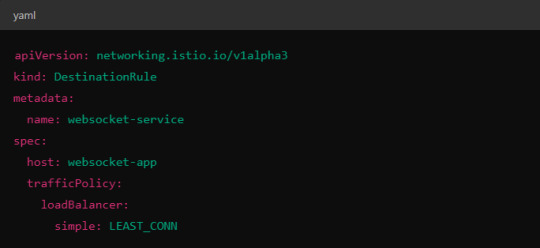
Load Balancer Configuration in Istio.
Istio allows you to specify different load balancing strategies in the DestinationRule for your services. For WebSockets, the LEAST_CONN strategy may be more appropriate.
Alternatively, you could use consistent hashing for a more sticky routing based on connection properties like the user session ID.
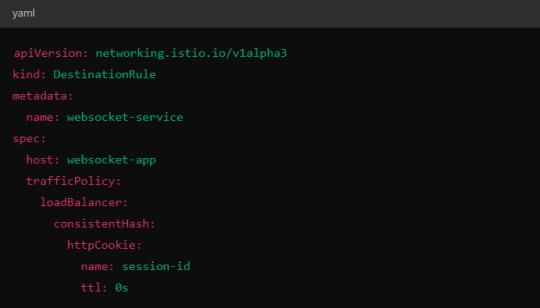
This configuration ensures that connections with the same session ID go to the same pod.
4. Scaling Considerations
WebSocket applications can handle a large number of concurrent connections, so you’ll need to ensure that your Kubernetes cluster can scale appropriately.
Horizontal Pod Autoscaler (HPA): Use an HPA to automatically scale your pods based on metrics like CPU, memory, or custom metrics such as open WebSocket connections.
Istio Autoscaler: You may also scale Istio itself to handle the increased load on the control plane as WebSocket connections increase.
5. Connection Timeouts and Keep-Alive
Ensure that both your WebSocket clients and the Istio proxy (Envoy) are configured for long-lived connections. Some settings that need attention:
Timeouts: In VirtualService, make sure there are no aggressive timeout settings that would prematurely close WebSocket connections.
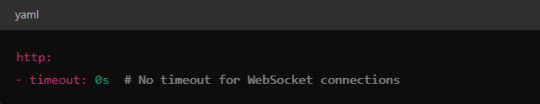
Keep-Alive Settings: You can also adjust the keep-alive settings at the Envoy level if necessary. Envoy, the proxy used by Istio, supports long-lived WebSocket connections out-of-the-box, but custom keep-alive policies can be configured.
6. Ingress Gateway Configuration
If you're using an Istio Ingress Gateway, ensure that it is configured to handle WebSocket traffic. The gateway should allow for WebSocket connections on the relevant port.
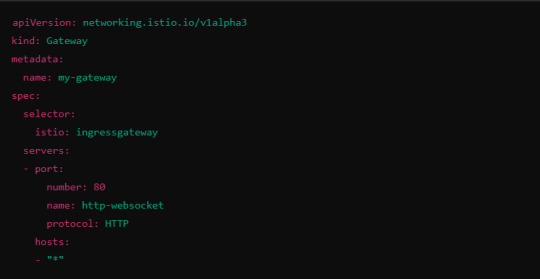
This configuration ensures that the Ingress Gateway can handle WebSocket upgrades and correctly route them to the backend service.
Summary of Key Steps
Enable WebSocket support in Istio’s VirtualService.
Use session affinity to tie WebSocket connections to the same backend pod.
Choose an appropriate load balancing strategy, such as least connection or consistent hashing.
Set timeouts and keep-alive policies to ensure long-lived WebSocket connections.
Configure the Ingress Gateway to handle WebSocket traffic.
By properly configuring Istio, Kubernetes, and your WebSocket service, you can efficiently load balance WebSocket connections in a microservices architecture.
#kubernetes#websockets#Load Balancing#devops#linux#coding#programming#Istio#virtualservices#Load Balancer#Kubernetes cluster#gateway#python#devlog#github#ansible
5 notes
·
View notes