#Regression Modeling in Practice. 2023
Explore tagged Tumblr posts
Visit Tumblr Blog
Explore Tumblr blogs with no restrictions, modern design and the best experience.
Last Seen Tumblr Blogs


Fun Fact
Tumblr’s website traffic is steadily declining.
Text
Coursera regression modeling in practice.Assignment 1.
Sample.
the datasample for this study reports several socio-economics indicators (like number of people living in urban areas, number of internet user for a given number of people, etc…) for 213 countries. The sample is drawn from databases made available by Gapminder (www.gapminder.com) a non-profits organization supporting sustainable global development.
Procedure
Data has been collected by Gapminder through several International organization sources like, but not limited to, World Health Organization, World bank, International Energy Agency.
Each record of the database used for this study reports data aggregated by Country so that Country is an unique identifier in the considered database. Data is referred to or up to a given year, to “per capita”, to “percentage of population” or to “given number of people”, as applicable.
Measure
The following variables are considered in this study:
Life expectancy (analysis var name: “lifeexpectancy”) is expressed in number of years and it is the average number of years a newborn child would live assuming the mortality rate stays as per the 2011. Data is from Human Mortality and Human Lifetable databases, World population Prospects and Publications and files by hystory prof James C Riley.
Personal income (analysis var name: “incomeperperson”) is the 2010 Gross Domestic Product per capita in constant 2000 US$. Inflation, but not the difference in the cost of living between countries has been considered. Data is from World Bank Work Development Indicator.
Alcohol Consumption (analysis var name:”alcconsumption”) is the 2008 alcohol consumption per adult (age 15+) in liters. Data is from the World Health Organization.
Carbon dioxide emission (analysis var name:”co2emissions”) is the 2006 cumulative CO2 emission (metric tons), total amount of CO2 emission in metric tons since 1751. Data is from the CDIAC (Carbon Dioxide Information Analysis Center).
Employment rate (analysis var name:”employrate”) is the 2007 total employees age 15+ ( %of population). Percentage of total population, age above 15, that has been employeed during the given year. Data is from the International Labour Organization.
The research question is ”there is an association between life expectancy (response variable) and income per person, alcohol consumption, Carbon dioxide emissions and employment rate (the explanatory variables)”?
In addressing the research question the whole original database is split into 2 subsets.
The first subset comprises the 27 countries part of the European Union (as of the 2023, but not considering special territories like Netherlands Antilles) plus USA, Canada, UK, Japan and Australia while the second comprises all the remaining 181 countries of the original database.
In this study, Statistica regression tools are used to verify any association between response and explanatory variables and to build predictive models to evaluate the significancy of the difference (if any) between response variable for the 2subset.
1 note
·
View note
Text
Georgians are in the streets fighting for their democracy. The Georgian Dream party, which is working to align Tbilisi with Moscow’s interests, declared victory in the country’s Oct. 26 election before the votes were even counted. Voters and election observers were harassed by Russian-funded gangs and mobsters; just after the election, protesters holding European Union flags were sprayed with water from high-powered hoses. And the person who has the iron will necessary to lead the charge against Russian-inspired authoritarianism in Georgia? A woman: President Salome Zourabichvili.
This is no accident. Across the world, women have, and are, playing incredible roles as bulwarks against the rise of authoritarianism. Moldovan President Maia Sandu is standing up to a tsunami of Russian disinformation. In Poland, women played a critical role in the effort to oust the right-wing populist Law and Justice (PiS) party. In Hong Kong, women continue to be the practical and normative face of resistance to Chinese authoritarian rule.
These are the freedom fighters of the 21st century. And yet, the U.S. national security community tends to view women’s issues as a domestic concern, frivolous, or irrelevant to “hard” security matters. For example, in 2003, discussions of securing Iraq excluded women, with a top U.S. general stating, “When we get the place secure, then we’ll be able to talk about women’s issues.” More recently, the role of women in the military has been reduced to discussions of diversity, equity, and inclusion, rather than a focus on how women have been vital to solving the United States’ most wicked national security problems—from serving on the front lines in combat to providing essential intelligence analysis. But if the overall aim of U.S. national strategy is to shore up democracy and democratic freedoms, the treatment of women and girls cannot be ignored.
Globally, women’s rights are often eroding in both policy and practice, from the struggles of the Iranian and Afghan women who exist under gender apartheid to the Kenyan women experiencing the harsh backlash of the rise of the manosphere. In tandem, there’s been a sharp rise in reports of online harassment and misogyny worldwide.
National security analysts explore issues and psychologies through any number of prisms, but Women, Peace, and Security (WPS) remains an underutilized one. One of the national security community’s core tasks is discerning signals from noise in the global strategic environment, and regressive ideas on gender and gender equality can be a useful proxy metric for democratic backsliding and authoritarian rise.
The United States’ 2023 Strategy and National Action Plan on Women, Peace and Security provides the backbone for the United States to leverage WPS to counter authoritarianism. It highlights that displays of misogyny online are linked to violent action. The plan also points out that formally incorporating gendered perspectives is essential for maintaining democratic institutions at home and modeling them aboard. This includes recognizing misogyny—online or in policy—as an early indicator of authoritarian rise.
Unfortunately, WPS is often misread as simply including more women in the national security workforce. But it is more than that. It offers a framework for understanding why it is useful to take gendered perspectives into account when assessing how the actions of individuals or groups enhance national security, which is especially important at a time when authoritarian regimes are weaponizing gender in ways that strengthen their grip on power domestically and justify their aggression abroad.
In Russia, President Vladimir Putin has argued that he is the guardian of traditional Christian values, telling women that they should be back at home raising children, and has been rolling back domestic violence laws at the same time. Days before invading Ukraine in February 2022, Putin said, “Like it or don’t like it, it’s your duty, my beauty,” which was widely interpreted within Russia as a reference to martial rape. Russia’s own army is built on a foundation of hierarchical hazing in which “inferior” men are degraded by their comrades. With that kind of rhetoric from the top, is it any wonder that Russian soldiers’ war crimes have included the rapes of women and children?
But Putin isn’t alone. In Hungary, Prime Minister Viktor Orban has consolidated media outlets to censor women’s voices, in the name of protecting traditional values. He has also used coercive financial practices to push women out of the workforce and positions of political power and into more traditional roles of wife and mother. In Belarus, President Alexander Lukashenko attempted to force the deportation of the most prominent woman opposition leader and imprisoned her after she tore up her passport to prevent it. In China, where women were once told they “hold up half the sky,” President Xi Jinping has worked to undo decades of Chinese Communist Party policy on gender equality. Chinese women are now being encouraged to return home and become mothers, while feminists have been targeted legally and socially.
The WPS agenda provides the U.S. national security community with three opportunities to recognize, understand, and counter early-stage authoritarianism.
First, the United States can do a much better job of supporting women’s groups around the world as a central aspect of its national security strategy. Women’s groups are often a bellwether for authoritarian rise and democratic backsliding—as currently on display in Russia, China, Hungary, Georgia, and Belarus, where women inside and outside their respective regimes have been specifically targeted or attacked.
Women have also found innovative ways to resist the rise of authoritarian norms. In places like Moldova, women have acted as bulwarks against authoritarianism despite vicious disinformation campaigns targeting women leaders. Yet when it comes to formulating and executing strategies on national security, women’s groups are often left in the margins and their concerns dismissed.
Second, gender perspectives are essential to more fulsome intelligence gathering and analysis. The U.S. intelligence community can do a much better job of integrating gender—particularly as it relates to the treatment of the most vulnerable—as an indicator of societal and democratic health. This includes understanding how both masculinities and femininities influence decision-making and how, in turn, lived experiences act as necessary analytical tools. Training collectors and analysts of intelligence to recognize gendered indicators will provide a more robust view of the geopolitical landscape and fill critical holes in national security decision-making.
Finally, the United States must improve the participation of its national security community in WPS and feminist foreign-policy discussions. For too long, the “hard” security sector has distanced itself from more “human” security-focused endeavors and treated women’s rights as something that’s just nice to have.
Yet national security is an essentially human endeavor, and gender is a central component of what it means to be human. This is something that needs to be appreciated to better understand the many dimensions of the conflict—disinformation, online influence campaigns, and lawfare—that authoritarian regimes are waging against the United States and its allies.
111 notes
·
View notes
Text
COVID vaccine efficacy against severe illness just under 50%, per early estimates from 2023 - Published Aug 20, 2024
Two European observational studies estimate the vaccine effectiveness (VE) of the COVID-19 XBB.1.5 vaccine approved in fall 2023 against hospitalization, the first one finding 49% overall VE in adults, and one showing good protection—but uneven uptake—among pregnant women.
Steep declines in VE after 1 month For the first study, published in Influenza and Other Respiratory Viruses, researchers with the European Hospital Vaccine Effectiveness Group conducted a test-negative case-control study on the VE against hospitalization of the XBB.1.5 COVID-19 vaccine in the first months of its rollout from October 2023 to January 2024.
The XBB.1.5-like+F456L variant was dominant in Europe from fall to mid-December 2023, when BA.2.86 supplanted it.
The participants were 622 adults hospitalized for COVID-19 and 3,457 control patients admitted for a different severe respiratory infection to 41 hospitals at 7 sites participating in the Vaccine Effectiveness, Burden and Impact Studies (VEBIS) study. In total, 27% of COVID-19 patients and 44% of controls had been vaccinated after fall 2023, most with the Pfizer/BioNTech vaccine.
The median time between vaccination and symptom onset was 58 days for COVID-19 patients and 52 days for controls.
Overall VE was 49% against hospitalization (range, 69% at 14 to 29 days to 40% at 60 to 105 days postvaccination), although confidence intervals overlapped for all estimates, indicating uncertainty. VE was over 70% in adults ages 65 years and older up to 1 month after vaccination. VE in patients ages 80 and older declined from 76% in the first 29 days to 39% after 60 days.
The study authors noted that their VE estimates are lower than those of three previous European studies but in line with a fourth, except for a greater decline in VE with increasing time since vaccination (TSV), proposing that the differences could be attributed to different TSVs bands.
"The findings of our study suggest that the adapted COVID-19 XBB.1.5 vaccines provided protection against hospitalisation in the first 3.5 months post vaccination, by reducing the risk of COVID-19 hospitalisation by approximately half among the vaccinated individuals," they concluded.
Uptake highest in those with chronic conditions The second case-control study, published in Vaccine, included all 47,046 pregnancies ending from June 2021 to August 2022 among 39,213 women seen at Northwest London general practices. In 57% of pregnancies, the mother had received at least one dose of COVID-19 vaccine during their pregnancy, with 91% of them receiving a second dose.
Pregnant women, the study authors noted, are at higher risk of COVID-19 complications such as hospitalization, intensive care unit admission, invasive mechanical ventilation, and death.
"They are also at increased risk of pregnancy-related complications such as preeclampsia and emergency cesarean delivery, and their infants are at higher risk of being preterm or stillborn," they wrote, adding that uptake has been suboptimal.
Most pregnancies (80%) were among women aged 25 to 39 years, those who were White (39%) or Asian (34%), and those living in areas in the second (35%) or third (29%) most deprived quintiles of socioeconomic deprivation. The most common of the five risk factors studied was asthma (9.9%), and chronic heart disease was the least common (0.68%).
A total of 180 women were hospitalized for COVID-19. Admission for COVID-19 was much less likely among vaccinated women than among the unvaccinated. A conditional logistic regression model suggested a five-fold decrease in the chances of COVID-19 hospitalization in vaccinated women, compared with their unvaccinated peers (odds ratio [OR], 0.22).
Vaccine uptake was lowest in women ages 18 to 24 years (33%), Black women compared with White (37%; OR, 0.55), and those in socioeconomically deprived areas (50%). Coverage was higher among women with chronic conditions, with the greatest uptake among those with chronic heart disease (75% for first dose, 94% for second).
Among women with chronic conditions, women with asthma (OR, 1.20), chronic heart disease (OR, 2.34), diabetes (OR, 1.54), and morbid obesity (OR, 1.15) had significantly higher odds of receiving at least one vaccine dose during pregnancy, compared with those without the condition.
The probability of receiving a first dose of the vaccine was nearly six times higher in the 45- to 49-year) age group than in those ages 25 to 29, compared with 18- to 24-year-olds.
Second-dose patterns were similar. Hospitalized women were much less likely to have been vaccinated than those not hospitalized (22% vs 57%; OR, 0.22). "This association reinforces evidence on the real-world effectiveness of COVID-19 vaccines in preventing severe disease and consequent hospital admission among pregnant women," the researchers wrote.
"COVID-19 vaccine uptake among pregnant women is suboptimal, particularly in younger women, Black women, and women in more deprived areas," they added. "Interventions should focus on increasing uptake in these groups to improve health outcomes and reduce health inequalities. Future vaccination programmes should engage pregnant women earlier and communicate with them clearly and carefully."
Link to study: onlinelibrary.wiley.com/doi/10.1111/irv.13360
#covid#mask up#pandemic#covid 19#wear a mask#coronavirus#sars cov 2#still coviding#public health#wear a respirator#covid vaccine
29 notes
·
View notes
Text
Victoria’s Secret Fashion Show Returns: What You Need to Know

Victoria’s Secret Fashion Show Returns: What You Need to Know After a four-year hiatus, the iconic Victoria’s Secret Fashion Show is set to make its grand return on Tuesday in New York City. The show, which was last held in 2018, was discontinued in 2019 due to declining ratings and controversies surrounding the brand. However, following a partial revival with a filmed version for Prime Video last year, Victoria’s Secret is back with a renewed vision. The Evolution of Body Positivity The return of the fashion show comes at a pivotal moment in the body positivity movement, which champions self-acceptance across all body types. While many curvy figures have spent their careers advocating for size-inclusive clothing, the rise of popular weight loss drugs has led some plus-size models to express concerns that the fashion industry is regressing. This year’s show aims to address these concerns and reflect a more inclusive vision of beauty. Past Controversies Victoria’s Secret has faced its share of controversies over the years. A 2020 New York Times investigation revealed allegations of a misogynistic culture within the company. At the time, a spokesperson for L Brands, the former parent company of Victoria’s Secret, stated that they were “intensely focused” on improving corporate governance and compliance practices. Additionally, the brand has been criticized for its lack of inclusivity. In November 2018, then-chief marketing officer Ed Razek faced backlash for stating he did not believe “transsexuals” should be included in the runway show. Since splitting from L Brands in 2021, Victoria’s Secret has made efforts to revamp its image, incorporating more diverse and body-positive models in its campaigns. What’s Different About This Year’s Show? In May, Victoria’s Secret announced its desire to create a show that reflects “who we are today.” The brand’s Instagram post emphasized that the show would combine traditional elements—glamour, runway, wings, and musical entertainment—with a commitment to inclusivity. In August 2023, the company stated, “We have moved from promoting an exclusionary view of what’s sexy to celebrating all women throughout every phase of their lives.” This commitment aims to make Victoria’s Secret an industry leader in retail innovation, fashion, and sustainability. How to Watch This year’s show will take place at the brand’s flagship store in New York City and will be broadcast on Amazon Prime Video and Amazon Live. It will also be available to watch on Victoria’s Secret’s social media platforms, including Instagram, TikTok, and YouTube. The show kicks off at 7 p.m. ET, but fans can catch the Pink Carpet pre-show, hosted by social media personality Tefi Pessoa and model Olivia Culpo, starting at 6:30 p.m. ET. Who Will Be Walking the Runway? Many of Victoria’s Secret's most famous “angels” are returning for this year’s show, along with some exciting newcomers. Notable models include Gigi Hadid, Mayowa Nicholas, Barbara Palvin, Behati Prinsloo, Jasmine Tookes, Adriana Lima, Ashley Graham, Paloma Elsesser, and Devyn Garcia. Additionally, Tyra Banks, a former longtime host of “America’s Next Top Model,” will make her runway return for the first time in 20 years. Models have expressed their excitement on social media, with Graham stating, “I am in my late 30s, I just had three children and I am feeling so curvy, so sexy, and my outfit is fire.” Palvin added, “It’s been six years and now we’re back. I’m excited to see all the girls, all the performers, the wings, the sparkles.” Banks shared her enthusiasm, saying, “It feels crazy being back on the Victoria’s Secret runway. I mean, like, ‘cray cray,’ as in ‘cray cray good.’” Who Is Performing? For the first time, the Victoria’s Secret Fashion Show will feature an all-women lineup, headlined by none other than Cher. Victoria’s Secret described her as “the mother of fashion” in an Instagram post last month. Other performers include K-pop sensation Lisa and singer-songwriter Tyla, promising an unforgettable musical experience. Conclusion As the Victoria’s Secret Fashion Show returns, it aims to redefine beauty standards while embracing inclusivity and diversity. With a star-studded lineup of models and performers, this year’s show is set to be a celebration of all women and their unique journeys. Don’t miss out on this exciting event that promises glamour, empowerment, and a fresh take on what it means to be beautiful. Keywords: Victoria’s Secret Fashion Show, body positivity, inclusivity, Gigi Hadid, Tyra Banks, Cher, fashion industry, Amazon Prime Video, runway models, beauty standards. Read the full article
#AmazonPrimeVideo#beautystandards.#bodypositivity#Cher#fashionindustry#GigiHadid#inclusivity#runwaymodels#TyraBanks#Victoria’sSecretFashionShow
2 notes
·
View notes
Text
Marketing Strategy with the Power of Quantitative Data Analysis
What if you could predict your customers’ next move with data-backed precision?
What if your marketing efforts could be less guessing and more knowing? And what if a single shift in your strategy could deliver measurable ROI—without burning your budget?
Welcome to the world of Quantitative Market Research, where numbers don’t just support decisions—they drive transformative outcomes.
At Philomath Research, we help businesses navigate complexity by delivering data that speaks clearly. Let’s explore how quantitative data can supercharge your marketing strategy—and why it’s more important now than ever before.
Why Quantitative Data Analysis is the Backbone of Modern Marketing
In a fast-moving digital world where consumer trends shift in real-time, businesses cannot afford to rely on assumptions. They need evidence. They need clarity. And most importantly, they need accurate, scalable insights.
Quantitative Market Research provides that clarity. It involves collecting and analyzing numerical data to understand consumer behavior, preferences, and patterns. This might include:
How many consumers engaged with your campaign?
What percentage of users converted after a specific touchpoint?
Which product variant performs best across different regions?
When used strategically, this kind of data allows brands to:
Evaluate campaign performance
Identify customer segments
Optimize pricing models
Enhance product-market fit
And the beauty lies in its ability to guide data-driven decision-making across the entire marketing funnel.
Real-World Example: Netflix’s Data-Driven Success
Netflix isn’t just a streaming giant—it’s a data powerhouse. From the very beginning, Netflix has used quantitative analysis to understand viewer behavior, personalize recommendations, and even greenlight original shows.
One standout example: the creation of House of Cards. Netflix analyzed user viewing habits, actor popularity, and content preferences. The data showed that political dramas, especially with Kevin Spacey and David Fincher, had high engagement potential. The result? A massive hit that was powered by data before a single scene was shot.
That’s the power of quantitative data—helping businesses make bold, confident decisions grounded in reality.
The Philomath Research Approach: Turning Numbers into Action
At Philomath Research, we don’t just crunch numbers—we help you make sense of them. Our Quantitative Market Research solutions are designed to provide deep insights into your target audience, industry dynamics, and competitive landscape.
Here’s how we do it:
Surveys & Questionnaires: Structured instruments targeting a statistically significant sample of your market
Online & Offline Data Collection: Reaching your audience across platforms and geographies
Advanced Analytics & Modeling: From regression analysis to cluster segmentation and conjoint analysis
Custom Dashboards & Reporting: Actionable insights visualized for quick decision-making
Whether you’re launching a new product or refining an existing campaign, our data-backed insights ensure you stay several steps ahead of the curve.
Why Businesses Can’t Afford to Ignore Quantitative Research Today
Let’s look at a few compelling industry numbers:
According to a Statista 2024 survey, 69% of marketing leaders say data-backed decision-making has improved their campaign ROI by at least 20%.
Salesforce’s 2023 State of Marketing report notes that high-performing marketing teams are 3.6x more likely to use advanced analytics in their strategy.
And a PwC Global Consumer Insights Survey showed that companies who prioritize customer data and analytics outperform their competitors by 30% in terms of revenue growth.
The takeaway? If you’re not leveraging quantitative data, you’re leaving growth on the table.
From Data to Direction: Practical Marketing Use Cases
Wondering how this translates to your business? Here are some marketing-specific use cases where Quantitative Market Research can have immediate impact:
Audience Segmentation: Identify distinct buyer personas using demographic and behavioral data.
Pricing Strategy: Run price sensitivity studies to determine optimal pricing.
Campaign Optimization: Track engagement, click-through rates, and conversions across different channels.
Brand Tracking: Measure brand awareness and perception over time with large-scale surveys.
Product Development: Use preference testing and concept evaluations to create offerings that resonate.
Each of these tactics empowers your marketing team to make strategic moves that are grounded in facts, not assumptions.
What Makes Philomath Research the Right Partner?
We understand that behind every business challenge is a human decision. That’s why we go beyond surface-level data to uncover what truly drives consumer behavior.
Customized Research Design: Every project starts with your unique objectives.
Industry Expertise: From retail and healthcare to BFSI and tech, we bring contextual insights to the table.
Global Reach, Local Understanding: Our fieldwork spans across urban and rural markets, ensuring representation that reflects reality.
Data Integrity First: We follow rigorous data quality and validation protocols to ensure your insights are trustworthy.
Our clients don’t just receive data—they gain a competitive advantage.
Conclusion: Power Up Your Marketing With Quantitative Intelligence
Marketing is no longer about who shouts the loudest. It’s about who listens the best—and acts on what they learn. Quantitative Market Research gives you that edge. It helps you listen to your customers at scale, track patterns in their behavior, and pivot your strategy with confidence.
At Philomath Research, we’re here to help you ask smarter questions, get sharper answers, and make bold decisions backed by data that works.
Ready to turn insights into impact?
Let’s talk. Reach out to us at www.philomathresearch.com and discover how we can power your next big marketing move.
FAQs
1. What is quantitative data analysis in marketing? Quantitative data analysis involves the collection and statistical examination of numerical data to identify trends, behaviors, and patterns in consumer behavior. It’s used in marketing to make informed, data-driven decisions.
2. How does quantitative research differ from qualitative research? Quantitative research focuses on measurable data (like percentages, counts, and frequencies), while qualitative research explores deeper insights through open-ended questions, interviews, or focus groups. Both are valuable but serve different purposes.
3. Why is quantitative data important in a marketing strategy? It provides objective, scalable insights that help you evaluate performance, optimize campaigns, and reduce guesswork. It also enables precise targeting, personalization, and forecasting.
4. What tools are commonly used in quantitative data analysis? Some common tools include statistical software (like SPSS, R, or Python), data visualization platforms (Tableau, Power BI), and survey platforms (Qualtrics, SurveyMonkey, Google Forms).
5. How can small businesses benefit from quantitative market research? Even with a limited budget, small businesses can conduct affordable surveys or analyze web and campaign analytics to understand customer preferences, refine messaging, and improve ROI.
6. What is the ROI of investing in quantitative research? Investing in data-backed research leads to better marketing outcomes—such as higher conversion rates, improved customer retention, and smarter budget allocation—which in turn results in measurable ROI.
#data driven decision making#quantitative data#quantitative data analysis#quantitative market research#quantitative market research services
0 notes
Text
Psychoanalytic Therapy in Family Systems Introduction  Psychoanalytic therapy, derived from Sigmund Freud's theories, has developed over the last one hundred years to now function as one of the most primitive frameworks in psychotherapy. It provides directions to understanding the more profound and less controlled aspects of human personality, early childhood trauma, and interpersonal conflicts. When practicing family systemic therapy, psychoanalytic concepts help understand the processes occurring within a person and a family. The current paper presents an overview of psychoanalytic therapy as a theoretical orientation. It explores its fundamental postulates, conceptualizing individual, couple, and family processes, principal interventions, and engagement points with gender, culture, and other diverse parameters. Last, I provide personal impressions regarding the theory and intended application of the theory in clinical work. Basic Tenets of Psychoanalytic Therapy  Several principles underpin psychoanalytic therapy as follows. The first principle holds that the patient's unconscious mind contains, in part, the resources that will bring about change. This principle has primarily shaped the approach taken by psychoanalytic therapists in their treatment of patients. Psychoanalytic therapy is based on several principles as follows: The first principle fundamentally believes that, at least in part, the patient's unconscious has what is required for change. Psychoanalytic therapy emphasizes the first one, preconscious motivation, where most people's actions are thought to result from preconscious desires, fears, and conflicts. These are the processes that are automatical and have their origins in childhood, and they play important roles in how a person perceives, feels, and acts during adulthood (Henkel et al., 2022). The second is the principles regarding defense mechanisms. Psychological defense mechanisms are those processes that run unconsciously in a personality to save it from anxiety and/or feelings of emotional pain. Kernberg, (2016). explained that repression, denial, and projection are ways of handling internal conflicts. These are not necessarily pathological defenses, but they may cause relational problems if put into play excessively. Third, role-determined personality is based on early and late childhood notions. The psychosexual conflicts in childhood, if not resolved, produce psychological disturbance in later years (Kernberg 2016). This framework shows that these early experiences should be incorporated into the therapy. Last but not least, manifestations of transference and countertransference are between the psychoanalytic therapist and client. Countertransference is a process where clients transfer the feelings they harbored toward important figures in their past. In contrast, countertransference refers to the feelings that the therapist develops about the client, wherein feelings are reacted to tell something about the therapist or give a way into the client's unconscious material (Tarzian et al., 2023). Understanding Individual, Couple, and Family Dynamics  Psychoanalytic therapy sees family relationships as internal working models and regressions between them. Such conflicts usually arise in individuals' early childhood family environment. For example, the failure to have dependency needs met during childhood contributes to the problem of attachment in adulthood. These internal contents define people's behavior within the couple or the family as a system. Evaluating couple dynamics involves defining the process due to each partner's subconscious projection of the other. In conflicts, many couples continue the cycle of arguments, resembling issues with persons from childhood or adolescence, due to the selection of couples at a subconscious level. This dynamic is often discussed using object relations theory, a perspective of psychoanalysis that primarily emphasizes the role of early relationships with primary caretakers in constructing later relational styles. In family therapy, systems and values such as family of origin and multigenerational transmission are paramount. Berman, (2023). incorporated psychoanalytic concepts into family systems theory, noting that previous unresolved issues are inherited. Therefore, the socio-psycho-genetic investigation of a family unveils the search for resolutions to present family conflicts. Core Therapy Techniques  Several fundamental methods are used in psychoanalytic therapy to increase the patient's awareness of the unconscious material in analysis and in producing insight. One of the significant approaches is an association, where clients are allowed to say anything they want. It is used to assist the clients in accessing aspects of the material that may reside in the client's subconscious mind and yet impact their overall behavior. The therapist attentively focuses on the material, looking for clues about a patient's psychic structure, which reflects unconscious conflicts. The second technique is dream analysis. Another conception of dreams relates to the one that regards them as reflections of the subconscious want, fear, or aggression. Cognitive therapists assist patients in understanding the meaning that their dream makes in operationally significant ways as a way of helping them locate unexpressed feelings and comprehend their intrapsychic realities (Kernberg, 2016). Interpretation is the hub or core of psychoanalytic therapy. Cognitive model Therapists analyze clients' actions, perceptions, and feelings and explain the signs clients have observed regarding how early experience influences present behavior. Often, these interpretations are built around transference, occurring when clients shift their attitudes to the influential individuals in their lives to the therapist (Kernberg, 2016). Last but not least, working through means going back and over the 'forgotten,' 'repressed' material time and again during the process of therapy. This process of moving through varying stages of their process means that clients can learn to create better patterns to combat their internal conflicts. Intersection with Gender, Socioeconomic Status, Race, Ethnicity, Sexual Orientation, Religion, and Culture  Psychoanalytic theory propounded in Europe in the early 19th century has been criticized for its failure to consider cultural differences. Highly criticized and developed from Western, male, and upper-middle-class norms, most older psychoanalytical models failed to accommodate clients from other cultures. However, as has been mentioned before, modern psychoanalysis is more tolerant. Today's psychoanalytic therapists consider gender and sexual orientation, race, ethnicity, and cultural background. For example, feminist psychoanalysts have questioned Freud's gender prejudice when dealing with the female psychosexual stage of development and the Oedipus complex (Henkel et al., 2022). Today, therapists always consider cultural aspects such as race, class, and sexual orientation as structures of unconscious processes and relating. Further, psychoanalysis has been considered unreliable for low-class societies because of its lengthy and expensive system of treatment. However, approaches such as STDT have made the psychoanalytical model more available to a broader spectrum of clients. As for religion and spirituality, CT was most accustomed to viewing religious manifestations as a neurotic phenomenon characteristic of the primitive mind. However, in current practice, practitioners appreciate the role of spirit and more often include the client's religious or spiritual system where necessary (Berman, 2023). Personal Reactions and Clinical Application  Psychoanalytic therapy is one of the most interesting but, at the same time, quite complicated; it pays great attention to content beyond the level of consciousness, which can help me better understand the psychology of clients. The concept that a child's early experiences affect their adult relationships is supported by my experience working in a clinical capacity. Nevertheless, I also view deficiencies within the historical psychoanalytic model in downplaying cultural diversity and its lengthened process. In my current practice, I would apply psychoanalytic ideas in a more culturally friendly and clinical manner. For example, employing brief psychodynamic therapy can help clients integrate psychoanalytic processes more quickly than could be accomplished with traditional long-term therapy methods. In the clinical setting, I see myself applying free association and transference analysis to help my clients understand their behavior patterns, especially when treating families. The knowledge gained from a family of origin construct on how unresolved strife affects present relationships can be a valuable asset to families, as the need to interrupt the unhealthy cycle and embrace new healthy ones is met. Conclusion Psychoanalytic therapy clarifies the psyche, patterns of behavior, and interpersonal relationships. Despite criticism, the system is not very diverse and accessible in a way that is easy to apply, but modern versions make it more portable and suitable for therapeutic practice. In family therapy, several concepts from psychoanalysis give clinicians tools for understanding the transfer of pathological processes from generation to generation, as well as helping clients overcome unresolved issues from their childhood and gain more adaptive patterns of interaction. As I continue my clinical practice, I eagerly await to apply this gain to practice with people, couples, and families. References Berman, J. (2023). Psychoanalysis: An Interdisciplinary Retrospective. State  University of New York Press. https://doi.org/10.2307/jj.18253204 Henkel, M., Huber, D., Ratzek, M., Benecke, C., & Klug, G. (2022). Can we differentiate between psychoanalytic and psychodynamic psychotherapy? –  An empirical investigation of therapists’ self-reports. Zeitschrift Für  Psychosomatische Medizin Und Psychotherapie, 68(4), 362–377.   https://www.jstor.org/stable/27191176 Kernberg O. F. (2016). The four basic components of psychoanalytic technique and derived psychoanalytic psychotherapies. World psychiatry: official journal of the World Psychiatric Association (WPA), 15(3), 287–288.  https://doi.org/10.1002/wps.20368 Tarzian, M., Ndrio, M., & Fakoya, A. O. (2023). An Introduction and Brief Overview of Psychoanalysis. Cureus, 15(9), e45171. Read the full article
0 notes
Text
Is It Worth Learning the TOSCA Automation Tool?
In today’s fast-paced technological landscape, automation testing has become a crucial skill for quality assurance (QA) professionals. Among the multitude of automation tools available, TOSCA Automation Tool stands out as a robust and user-friendly solution for end-to-end testing needs. Whether you’re a beginner in automation testing or an experienced QA engineer looking to upskill, TOSCA Certification can open doors to new opportunities and career growth.
But is it truly worth learning the TOSCA Automation Tool? Let’s dive into a comprehensive exploration of its benefits, real-world applications, and why taking a TOSCA Automation Tool Course can be a game-changer in your career.
Introduction to TOSCA Automation Tool
TOSCA, developed by Tricentis, is a comprehensive testing solution designed to simplify test automation processes. Unlike traditional tools, TOSCA focuses on model-based testing, eliminating the need for complex coding and enabling faster test execution. Its features are tailored for testing across web applications, mobile platforms, APIs, and enterprise systems like SAP.
Key Highlights of TOSCA
Model-Based Test Automation: Simplifies the creation of automated tests with visual models.
Cross-Platform Testing: Supports diverse environments, from web and mobile to enterprise applications.
Integration Capabilities: Seamlessly integrates with CI/CD pipelines and DevOps tools.
Automated Test Adaptation: Reduces maintenance efforts by automatically adjusting tests when application interfaces change.
These features make TOSCA a preferred choice for organizations looking to scale their automation testing processes efficiently.
youtube
Why TOSCA Is Worth Learning
1. Growing Demand for Automation Testing Skills
Automation testing is no longer optional for businesses aiming to deliver high-quality software at speed. According to recent reports, the global automation testing market is expected to grow at a CAGR of 18.7% from 2023 to 2030. With TOSCA’s widespread adoption in industries such as banking, healthcare, and retail, certified TOSCA professionals are highly sought after.
Furthermore, employers are prioritizing professionals who can bridge the gap between technical expertise and business requirements. TOSCA’s user-friendly interface and intuitive testing workflows make it easier to communicate test outcomes across technical and non-technical teams, further boosting its value in the job market.
2. Ease of Use with Model-Based Testing
Traditional testing tools often require in-depth programming knowledge, which can be a barrier for many professionals. TOSCA’s model-based approach eliminates this hurdle, enabling users to create tests with simple drag-and-drop functionality.
Example:
A business analyst without coding experience can use TOSCA to automate functional tests.
QA engineers can focus on strategic aspects of testing rather than spending hours writing scripts.
This accessibility democratizes automation testing, empowering diverse teams to participate in quality assurance efforts.
3. Integration with DevOps and Agile Practices
In Agile and DevOps environments, continuous integration and delivery (CI/CD) are vital for maintaining rapid release cycles. TOSCA’s integration capabilities with tools like Jenkins, Azure DevOps, and GitHub make it a powerful ally for automation in these workflows. With TOSCA, you can:
Automate regression tests to ensure code stability.
Monitor real-time test results to identify bottlenecks in the development pipeline.
TOSCA also supports shift-left testing, allowing teams to identify and fix defects earlier in the development lifecycle. This proactive approach reduces time-to-market and improves product quality.
4. Career Opportunities with TOSCA Certification
Earning a TOSCA Certification demonstrates your expertise in the tool and sets you apart in the competitive job market. Some career roles that benefit from TOSCA expertise include:
Automation Test Engineer
QA Specialist
DevOps Engineer
Software Development Engineer in Test (SDET)
Salary Insights:
Professionals with TOSCA Certification often earn 20–30% more than their non-certified counterparts. For instance:
In the United States, TOSCA experts can earn an average salary of $100,000–$130,000 per year.
In India, certified TOSCA professionals command salaries ranging from ₹10–20 LPA, depending on experience and industry.
5. Cost and Time Efficiency
TOSCA reduces test maintenance efforts by automatically adapting to changes in the application under test (AUT). This adaptability saves time and ensures consistent testing coverage, making it a cost-effective solution for organizations and a valuable skill for professionals.
Real-World Impact:
Companies using TOSCA report up to 70% reduction in testing time and significant cost savings in regression testing. These efficiencies allow businesses to allocate resources to other critical areas, such as innovation and customer engagement.
How to Learn TOSCA: A Step-by-Step Guide
1. Enroll in a TOSCA Automation Tool Course
The first step to mastering TOSCA is enrolling in a structured training program. Look for courses that cover:
Basic to advanced TOSCA functionalities.
Hands-on projects for real-world experience.
Preparation for the TOSCA Certification exam.
Several online platforms offer comprehensive TOSCA training, with flexible schedules and expert-led instruction.
2. Understand the TOSCA Architecture
Begin by familiarizing yourself with TOSCA’s architecture. Key components include:
TestCase Design: Helps in creating reusable test cases.
TOSCA Commander: The main interface for test creation and management.
ExecutionLists: Enables scheduling and monitoring of test executions.
3. Master Model-Based Test Automation
Practice creating and executing model-based test cases. For example:
Use TOSCA Commander to scan a web application and create modules.
Build reusable test cases by combining these modules.
4. Explore API and Mobile Testing
Expand your skill set by learning TOSCA’s API and mobile testing features. Create automated tests for REST and SOAP APIs or simulate user interactions on mobile applications.
5. Integrate TOSCA with CI/CD Pipelines
Leverage TOSCA’s integration capabilities to automate regression tests within CI/CD workflows. Tools like Jenkins and Azure DevOps can help streamline this process.
Real-World Applications of TOSCA
Case Study 1: Banking Industry
A leading bank used TOSCA to automate their core banking system tests. By leveraging TOSCA’s model-based testing, the bank reduced its test execution time by 40% and achieved higher accuracy in regression testing.
Case Study 2: E-Commerce
An e-commerce giant adopted TOSCA to test its web and mobile applications. The seamless integration with CI/CD tools enabled faster deployment cycles, enhancing the customer experience.
Key Benefits of TOSCA Certification
Enhanced Career Prospects: Certified professionals earn higher salaries and have better job opportunities.
Industry Recognition: TOSCA Certification validates your skills in a globally recognized tool.
Practical Expertise: Certification programs emphasize hands-on learning, preparing you for real-world challenges.
Conclusion
In conclusion, learning the TOSCA Automation Tool is a valuable investment for QA professionals and developers aiming to excel in automation testing. Its ease of use, integration capabilities, and growing demand make it an indispensable skill in today’s IT landscape. By enrolling in a TOSCA Automation Tool Course and earning a TOSCA Certification, you can significantly enhance your career prospects and contribute to efficient software delivery processes.
Ready to take the next step? Enroll in a TOSCA training course today and unlock new career opportunities.
0 notes
Text
My Multi_regression
Assignment 3: Test a Multiple Regression Model
This is the third assignment for the regression modeling practice course, third from a series of five courses from Data Analysis and Interpretation ministered from Wesleyan University. The previous content you can see here.
In this assignment, we have to Test a Multiple Regression Model with our data.
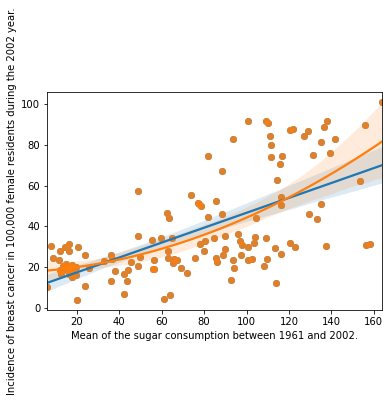
My response variable is the number of new cases of breast cancer in 100,000 female residents during the year 2002. My explanatory variable is the mean of sugar consumption quantity (grams per person and day) between the years 1961 and 2002.
To make the assignment of this week I have added two other explanatory variables:
Mean of the total supply of food (kilocalories / person & day) available in a country, divided by the population and 365 (the number of days in the year) between the years 1961 and 2002. The average of the mean TC (Total Cholesterol) of the female population, counted in mmol per L; (calculated as if each country has the same age composition as the world population) between the years 1980 and 2002. Note that all my explanatory variables are quantitative. Thus, I must center the variables by subtracting the mean from the data values, then the value 0 will be very close to the mean.
All of the images posted in the blog can be better view by clicking the right button of the mouse and opening the image in a new tab.
The complete program for this assignment can be download here and the dataset here.
Test a Multiple Regression Model
The first thing to do is to import the libraries and prepare the data to be used.
Test a Multiple Regression Model
The first thing to do is to import the libraries and prepare the data to be used.
In [144]:
1import numpy
2import pandas
3import matplotlib.pyplot as plt
4import statsmodels.api as sm
5import statsmodels.formula.api as smf
6import seaborn
7
8# bug fix for display formats to avoid run time errors
9pandas.set_option('display.float_format', lambda x:'%.2f'%x)
10
11#load the data
12data = pandas.read_csv('separatedData.csv')
13
14# convert to numeric format
15data["breastCancer100th"] = pandas.to_numeric(data["breastCancer100th"], errors='coerce')
16data["meanSugarPerson"] = pandas.to_numeric(data["meanSugarPerson"], errors='coerce')
17data["meanFoodPerson"] = pandas.to_numeric(data["meanFoodPerson"], errors='coerce')
18data["meanCholesterol"] = pandas.to_numeric(data["meanCholesterol"], errors='coerce')
19
20# listwise deletion of missing values
21sub1 = data[['breastCancer100th', 'meanSugarPerson', 'meanFoodPerson', 'meanCholesterol']].dropna()
The explanatory variables are centered and the first OLS Regression Test was made with only the meanSugarPerson variable.
In [146]:
1# center quantitative IVs for regression analysis
2sub1['meanSugarPerson_c'] = (sub1['meanSugarPerson'] - sub1['meanSugarPerson'].mean())
3sub1['meanFoodPerson_c'] = (sub1['meanFoodPerson'] - sub1['meanFoodPerson'].mean())
4sub1['meanCholesterol_c'] = (sub1['meanCholesterol'] - sub1['meanCholesterol'].mean())
5sub1[["meanSugarPerson_c", "meanFoodPerson_c", 'meanCholesterol_c']].describe()
6
7# linear regression analysis
8reg1 = smf.ols('breastCancer100th ~ meanSugarPerson_c', data=sub1).fit()
9print (reg1.summary()) OLS Regression Results ============================================================================== Dep. Variable: breastCancer100th R-squared: 0.410 Model: OLS Adj. R-squared: 0.406 Method: Least Squares F-statistic: 88.34 Date: Fri, 10 Mar 2023 Prob (F-statistic): 2.99e-16 Time: 10:45:38 Log-Likelihood: -560.18 No. Observations: 129 AIC: 1124. Df Residuals: 127 BIC: 1130. Df Model: 1 Covariance Type: nonrobust ===================================================================================== coef std err t P>|t| [0.025 0.975] ------------------------------------------------------------------------------------- Intercept 37.9876 1.651 23.007 0.000 34.720 41.255 meanSugarPerson_c 0.3667 0.039 9.399 0.000 0.289 0.444 ============================================================================== Omnibus: 3.414 Durbin-Watson: 1.778 Prob(Omnibus): 0.181 Jarque-Bera (JB): 3.052 Skew: 0.291 Prob(JB): 0.217 Kurtosis: 2.522 Cond. No. 42.3 ============================================================================== Notes: [1] Standard Errors assume that the covariance matrix of the errors is correctly specified.
We can see in the OLS Regression Results that the p-value is considerably less than our alpha level of 0.05 wich tells us that we can reject the null hypothesis and concludes that the sugar consumption is significantly associated with the incidence of breast cancer cases.
The coefficient for sugar consumption is 0.3667 and the intercept is 37.9876. This means that the equation for the best line of this graph is:
breastCancer100th = 37.9876 + 0.3667 * meanSugarPerson The column P>| t | give us the p-value for our explanatory variables, association with the response variable. This p-value is 0.000 wich means that it is really small confirming the significance associated with the variables.
Other information that OLS Regression Results give to us is the R-square. This value can be interpreted in the following way: If we know the sugar consumption grams per day of a woman we can predict 41% of the variability we will see in the incidence of breast cancer cases.
After make the linear regression test, we are going to do now the polynomial regression test. For this, we have to add the polynomial second order of the meanSugarPerson variable into the scatterplot and into the regression analysis.
In [147]:
1# first order (linear) scatterplot
2scat1 = seaborn.regplot(x="meanSugarPerson", y="breastCancer100th", scatter=True, data=sub1)
3plt.xlabel('Mean of the sugar consumption between 1961 and 2002.')
4plt.ylabel('Incidence of breast cancer in 100,000 female residents during the 2002 year.')
5
6# fit second order polynomial
7# run the 2 scatterplots together to get both linear and second order fit lines
8scat1 = seaborn.regplot(x="meanSugarPerson", y="breastCancer100th", scatter=True, order=2, data=sub1)
9plt.xlabel('Mean of the sugar consumption between 1961 and 2002.')
10plt.ylabel('Incidence of breast cancer in 100,000 female residents during the 2002 year.')
Out[147]:Text(0, 0.5, 'Incidence of breast cancer in 100,000 female residents during the 2002 year.')
In [148]:
1# quadratic (polynomial) regression analysis
2reg2 = smf.ols('breastCancer100th ~ meanSugarPerson_c + I(meanSugarPerson_c**2)', data=sub1).fit()
3print (reg2.summary()) OLS Regression Results ============================================================================== Dep. Variable: breastCancer100th R-squared: 0.430 Model: OLS Adj. R-squared: 0.421 Method: Least Squares F-statistic: 47.52 Date: Fri, 10 Mar 2023 Prob (F-statistic): 4.18e-16 Time: 10:54:56 Log-Likelihood: -557.98 No. Observations: 129 AIC: 1122. Df Residuals: 126 BIC: 1131. Df Model: 2 Covariance Type: nonrobust ============================================================================================= coef std err t P>|t| [0.025 0.975] --------------------------------------------------------------------------------------------- Intercept 34.4829 2.339 14.742 0.000 29.854 39.112 meanSugarPerson_c 0.3680 0.039 9.556 0.000 0.292 0.444 I(meanSugarPerson_c ** 2) 0.0020 0.001 2.089 0.039 0.000 0.004 ============================================================================== Omnibus: 1.821 Durbin-Watson: 1.808 Prob(Omnibus): 0.402 Jarque-Bera (JB): 1.520 Skew: 0.263 Prob(JB): 0.468 Kurtosis: 3.075 Cond. No. 3.58e+03 ============================================================================== Notes: [1] Standard Errors assume that the covariance matrix of the errors is correctly specified. [2] The condition number is large, 3.58e+03. This might indicate that there are strong multicollinearity or other numerical problems.
For the polynomial OLS Regression Results, we can see that the p-value still less than 0.05 assuming that we can reject the null hypothesis and concludes that the correlation between sugar consumption and incidence of breast cancer is significantly strong.
The coefficient for sugar consumption is 0.3680, for the polynomial sugar consumption we have a value of 0.0020 and for the intercept 34.4829. This means that the equation for the best line of this graph is:
breastCancer100th = 34.4829 + 0.3680 * meanSugarPerson + 0.0020 * meanSugarPerson²
The R-square in this scenario is slightly greater than the previous and can be interpreted as If we know the sugar consumption grams per day of a woman we can predict 43% of the variability we will see in the incidence of breast cancer cases.
After this analysis is time to add another explanatory variable, the amount of food consumption in kilocalories per day.
In [149]:
1# adding food consumption
2reg3 = smf.ols('breastCancer100th ~ meanSugarPerson_c + I(meanSugarPerson_c**2) + meanFoodPerson_c',
3 data=sub1).fit()
4print (reg3.summary()) OLS Regression Results ============================================================================== Dep. Variable: breastCancer100th R-squared: 0.653 Model: OLS Adj. R-squared: 0.645 Method: Least Squares F-statistic: 78.54 Date: Fri, 10 Mar 2023 Prob (F-statistic): 1.27e-28 Time: 10:56:09 Log-Likelihood: -525.90 No. Observations: 129 AIC: 1060. Df Residuals: 125 BIC: 1071. Df Model: 3 Covariance Type: nonrobust ============================================================================================= coef std err t P>|t| [0.025 0.975] --------------------------------------------------------------------------------------------- Intercept 33.5975 1.834 18.320 0.000 29.968 37.227 meanSugarPerson_c 0.1377 0.040 3.476 0.001 0.059 0.216 I(meanSugarPerson_c ** 2) 0.0025 0.001 3.333 0.001 0.001 0.004 meanFoodPerson_c 0.0316 0.004 8.975 0.000 0.025 0.039 ============================================================================== Omnibus: 0.058 Durbin-Watson: 1.720 Prob(Omnibus): 0.971 Jarque-Bera (JB): 0.062 Skew: 0.042 Prob(JB): 0.970 Kurtosis: 2.935 Cond. No. 3.59e+03 ============================================================================== Notes: [1] Standard Errors assume that the covariance matrix of the errors is correctly specified. [2] The condition number is large, 3.59e+03. This might indicate that there are strong multicollinearity or other numerical problems.
The OLS Regression Results demonstrates the p-value and the P>| t | for all variables lower than 0.05. We can conclude that both meanSugarPerson and meanFoodPerson are significantly associated with the incidence of new breast cancer cases.
The R-square increased considerably from 43% to 65.3%.
Thereafter, as the meanFoodPerson improved the study, let’s try to add the cholesterol in blood variable.
In [150]:
1# adding mean cholesterol
2reg4 = smf.ols('breastCancer100th ~ meanSugarPerson_c + I(meanSugarPerson_c**2) + meanCholesterol_c',
3 data=sub1).fit()
4print (reg4.summary()) OLS Regression Results ============================================================================== Dep. Variable: breastCancer100th R-squared: 0.728 Model: OLS Adj. R-squared: 0.722 Method: Least Squares F-statistic: 111.6 Date: Fri, 10 Mar 2023 Prob (F-statistic): 3.40e-35 Time: 11:01:39 Log-Likelihood: -510.23 No. Observations: 129 AIC: 1028. Df Residuals: 125 BIC: 1040. Df Model: 3 Covariance Type: nonrobust ============================================================================================= coef std err t P>|t| [0.025 0.975] --------------------------------------------------------------------------------------------- Intercept 32.7510 1.629 20.111 0.000 29.528 35.974 meanSugarPerson_c 0.0165 0.040 0.410 0.683 -0.063 0.096 I(meanSugarPerson_c ** 2) 0.0029 0.001 4.465 0.000 0.002 0.004 meanCholesterol_c 45.7660 3.909 11.709 0.000 38.030 53.502 ============================================================================== Omnibus: 5.132 Durbin-Watson: 1.947 Prob(Omnibus): 0.077 Jarque-Bera (JB): 5.067 Skew: -0.316 Prob(JB): 0.0794 Kurtosis: 3.736 Cond. No. 8.65e+03 ============================================================================== Notes: [1] Standard Errors assume that the covariance matrix of the errors is correctly specified. [2] The condition number is large, 8.65e+03. This might indicate that there are strong multicollinearity or other numerical problems.
#######When we add the meanCholesterol variable to the multiple regression tests, we can see that this variable made the meanSugarPerson p-value get increased over than 0.5, assuming that the meanCholesterol is a confounding variable for this work.
Q-Q Plot
In [154]:
1#Q-Q plot for normality
2fig4 = sm.qqplot(reg3.resid, line='r')
3plt.show(fig4)
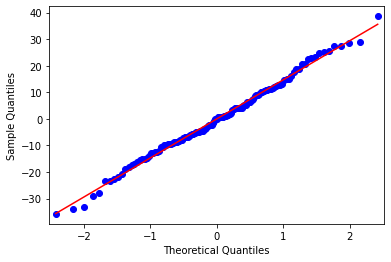
The qqplot for our regression model shows that the residuals generally follow a straight line, but deviate at the lower and higher quantiles. This indicates that our residuals did not follow perfect normal distribution meaning that the curvilinear association that we observed in our scatter plot may not be fully estimated by the quadratic sugar consumption.
In [155]:
1# simple plot of residuals
2stdres = pandas.DataFrame(reg3.resid_pearson)
3plt.plot(stdres, 'o', ls='None')
4l = plt.axhline(y=0, color='r')
5plt.ylabel('Standardized Residual')
6plt.xlabel('Observation Number')
Out[155]:Text(0.5, 0, 'Observation Number')

“The standardized residuals are simply the residual values transformed to have a mean of zero and a standard deviation of one. This transformation is called normalizing or standardizing the values so that they fit a standard normal distribution. In a standard normal distribution 68% of the observations are expected to fall within one standard deviation of the mean. So between -1 and 1 standard deviations. And 95% of the observations are expected to fall within 2 standard deviations of the mean.
With the standard normal distribution, we would expect 95% of the values of the residuals to fall between two standard deviations of the mean. Residual values that are more than two standard deviations from the mean in either direction, are a warning sign that we may have some outliers. However, there are no observations that have three or more standard deviations from the mean. So we do not appear to have any extreme outliers.
In terms of evaluating the overall fit of the model, there’s some other rules of thumb that you can use to determine how well your model fits the data based on the distribution of the residuals. If more than 1% of our observations has standardized residuals with an absolute value greater than 2.5, or more than 5% have an absolute value of greater than or equal to 2, then there is evidence that the level of error within our model is unacceptable. That is the model is a fairly poor fit to the observed data.”
In this work, only 1 point is exceeded an absolute value of 2.5 representing less than 1% and there are 6 points (4.65%) that are greater than or equal to an absolute value of 2.0. This suggests that the model is good.
additional regression diagnostic plots
In [156]:
1# additional regression diagnostic plots
2fig2 = plt.figure(figsize=(12,8))
3fig2 = sm.graphics.plot_regress_exog(reg3, "meanFoodPerson_c", fig=fig2)
4plt.show(fig2)
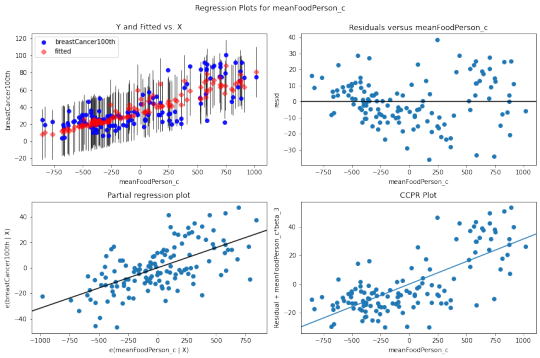
he plot in the upper right hand corner shows the residuals for each observation at different values of mean food consumption. There’s not a clearly pattern on it, as there is points all over the graph, we can assume that model predict food consumption kilocalories as well for countries that have either high or low incidence of breast cancer new cases.
To take a look at the contribution of each individual explanatory variable to model fit we analysis the partial regression residual plot (the third plot). It attempts to show the effect of adding meanFoodPerson as an additional explanatory variable to the model. Given that one or more explanatory variables are already in the model. This plot demonstrates the relationship between the response variable and specific explanatory variable, after controlling for the other explanatory variables. We can see that the meanFoodPerson has a linear pattern meaning that it meets the linearity assumption in the multiple regression.
Leverage Plot
In [157]:
1# leverage plot
2fig3=sm.graphics.influence_plot(reg3, size=8)
3plt.show(fig3)
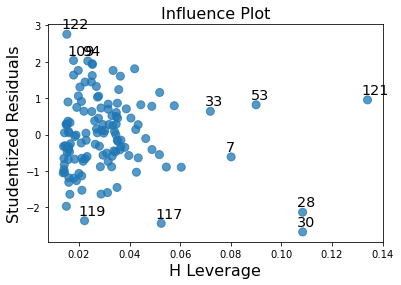
“Finally, we can examine a leverage plot to identify observations that have an unusually large influence on the estimation of the predicted value of the response variable, mean of sugar consumption grams per day, or that are outliers, or both.
The leverage of an observation can be thought of in terms of how much the predicted scores for the other observations would differ if the observations in question were not included in the analysis. The leverage always takes on values between zero and one. A point with zero leverage has no effect on the regression model. And outliers are observations with residuals greater than 2 or less than -2.”
One of the first things we see in the leverage plot is that we have a few outliers, contents that have residuals greater than 2 or less than -2. We’ve already identified some of these outliers in some of the other plots we’ve looked at, but this plot also tells us that these outliers have small or close to zero leverage values, meaning that although they are outlying observations, they do not have an undue influence on the estimation of the regression model. On the other hand, we see that there are a few cases with higher than average leverage. But one in particular is more obvious in terms of having an influence on the estimation of the predicted value of sugar consumption per day. This observation has a high leverage but is not an outlier. We don’t have any observations that are both high leverage and outliers.
In [ ]:
0 notes
Text
Regression Modeling in Practice, Week 4: Trying a logistic regression model
The task for this week is trying a logistic regression model. The dataset used contain information regarding clinical variables of 131 patients of the Jalisco Cancer Institute, from 2022 to 2023.
It is intented to observe how recurrence of breast cancer is related to clinical variables, such as body phase angle, The response variable was whether the patient has presented recurrence of breast cancer, and the explanory variables were age (in years), body mass index (quantitative variable), and vitamin D concentration (quantitative variable). It is expected that the variable are positively related to recurrence of breast cancer, except of vitamin D concentration.
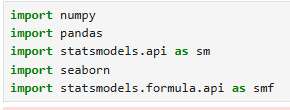
Importing libraries
2. Importing data

3. Data management, logistic regression with breast cancer recurrence
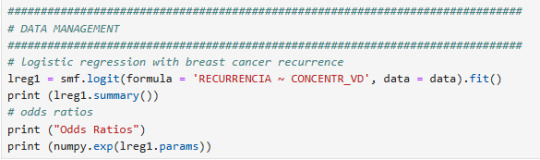
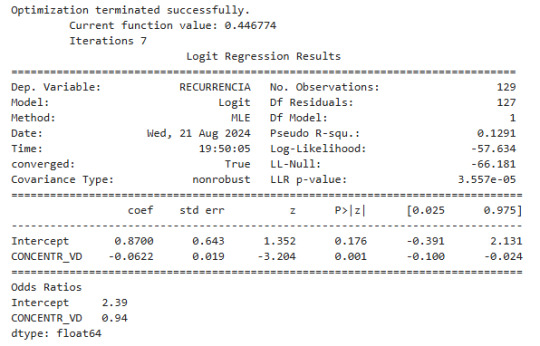

The first variable that its correlation was tested was vitamin D concentration. It can be seen that p value is less than 0.05 (p-value<0.05), which it says the correlation with recurrence is statistically significant. About the odd ratio, it shows a value of 0.94, and this can be interpreted as the vitamin D concentration helps in the recurrence, due the odd ratio is less than one. Furthermore, the negative coefficient of -0.622 lean to a negative correlation.
4. Logistic regression with vitamin D and Age

Both variables presented a significant correlation (p-value<0.05) with recurrence.
5. Logistic regression with vitamin D, age and body mass index


The vitamin D and age variables have a significant correlation with recurrence (p-value<0.05), and does not seem any of them could be a confounding variable in body mass index (p-value>0.05), because they do not affect much the odd ratio of each ratio.
6. Logistic regression with vitamin D and body mass index
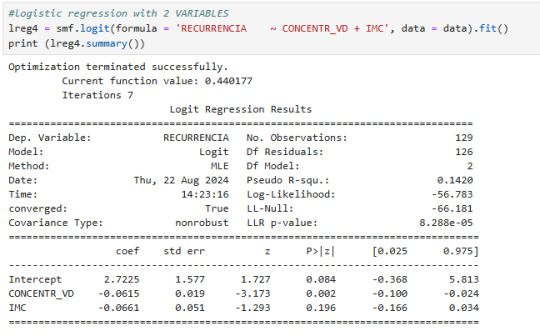
Body mass index does not have a significant correlation with recurrence (p-value<0.05)
7. Logistic regression with Age


Age (p-value<0.05) has a significant correlation with recurrence, and presents and odd ratio of 0.95.
Conclusion
After the results of logistic regressions, it can be observed that vitamin D concentration and age are associated with recurrence of breast cancer.
0 notes
Text
How to Leverage Data Science for Maximum Impact
Data science is a rapidly growing field that has become essential for businesses to stay competitive in today's market. With the rise of big data and the need for data-driven decision-making, data science has become a crucial aspect of many industries.
In this article, we will explore the prerequisites for pursuing a career in data science and how to leverage data science for maximum impact. Whether you are a student looking to enter the field or a business owner looking to incorporate data science into your operations, this article will provide valuable insights.
Data Science Prerequisites TCU
Before diving into the world of data science, it is essential to have a strong foundation in mathematics, statistics, and computer science. These are the three pillars of data science, and having a solid understanding of these subjects is crucial for success in the field.
Mathematics

Mathematics is the language of data science. It is the foundation of statistical analysis and machine learning algorithms. A strong understanding of calculus, linear algebra, and probability theory is essential for data scientists.
Calculus is used to optimize models and algorithms, while linear algebra is used for data manipulation and machine learning. Probability theory is the basis for statistical analysis and helps data scientists make sense of data.
If you are a student looking to pursue a career in data science, it is recommended to take courses in calculus, linear algebra, and probability theory. These courses will provide you with the necessary mathematical skills to excel in data science.
Statistics

Statistics is the science of collecting, analyzing, and interpreting data. It is a crucial aspect of data science as it helps data scientists make sense of large datasets and draw meaningful insights.
A strong understanding of statistics is necessary for data scientists to perform tasks such as hypothesis testing, regression analysis, and data visualization. It is also essential for data scientists to have a good grasp of statistical programming languages such as R and Python.
If you are a student looking to enter the field of data science, taking statistics courses and learning statistical programming languages is recommended. These skills will be invaluable in your data science career.
Computer Science

Computer science is the backbone of data science. It is the field that deals with the design, development, and use of computer systems. Data scientists use computer science to build and deploy models and algorithms that can process and analyze large datasets.
Having a strong foundation in computer science is crucial for data scientists. It is recommended to have a good understanding of programming languages such as Python, R, and SQL. Knowledge of data structures and algorithms is also essential for data scientists.
If you are a student looking to enter the field of data science, it is recommended to take courses in computer science and learn programming languages. These skills will help you build and deploy models and algorithms in your data science career.
Data Science Internships Summer 2023
One of the best ways to gain practical experience in data science is through internships. Data science internships provide students with the opportunity to work on real-world projects and gain hands-on experience in the field.
Benefits of Data Science Internships

Data science internships offer several benefits for students looking to enter the field. Some of these benefits include:
Practical experience: Internships provide students with the opportunity to work on real-world projects and gain hands-on experience in data science.
Networking opportunities: Internships allow students to network with professionals in the field and build valuable connections.
Resume building: Having a data science internship on your resume can make you stand out to potential employers and increase your chances of getting hired.
Job opportunities: Many companies use internships as a way to recruit new employees. A successful internship can lead to a full-time job offer.
How to Find Data Science Internships
Finding data science internships can be challenging, but there are several ways to increase your chances of landing one. Some tips for finding data science internships include:
Networking: Reach out to professionals in the field and attend networking events to build connections and learn about potential internship opportunities.
Online job boards: Many companies post internship opportunities on job boards such as Indeed, Glassdoor, and LinkedIn.
University career services: Many universities have career services departments that can help students find internships in their field of study.
Company websites: Check the websites of companies you are interested in to see if they offer internships in data science.
Leveraging Data Science for Maximum Impact
Now that we have discussed the prerequisites for pursuing a career in data science and how to find internships, let's explore how to leverage data science for maximum impact.
Identify Business Goals

The first step in leveraging data science for maximum impact is to identify your business goals. What are you trying to achieve with data science? Are you looking to increase sales, improve customer satisfaction, or optimize operations?
Identifying your business goals will help you determine which data science techniques and tools to use.
Collect and Clean Data

Data is the fuel that powers data science. To leverage data science for maximum impact, you need to collect and clean data. This involves gathering data from various sources, such as databases, social media, and customer feedback, and preparing it for analysis.
Data cleaning is an essential step in the data science process as it ensures that the data is accurate and free of errors. Data scientists spend a significant amount of time cleaning data to ensure that their analysis is based on reliable data.
Analyze Data

Once you have collected and cleaned your data, the next step is to analyze it. Data analysis involves using statistical techniques and machine learning algorithms to extract insights from data.
Data analysis can help you identify patterns, trends, and correlations in your data that can help you make data-driven decisions.
Visualize Data

Data visualization is the process of presenting data in a visual format, such as charts, graphs, and maps. Data visualization is an essential aspect of data science as it helps communicate complex data in a more accessible and understandable way.
Data visualization can help you identify patterns and trends in your data that may not be apparent in raw data. It can also help you communicate your findings to stakeholders and make data-driven decisions.
#onlinetraining#career#elearning#learning#programming#technology#automation#online courses#security#startups#data science#data analytics#ai generated
0 notes
Text
Researchers create machine learning model predicting long-term vision in high myopia patients, a top cause of irreversible blindness

- By Nuadox Crew -
In a study conducted by Tokyo Medical and Dental University (TMDU) researchers, a machine-learning model has been devised to foresee the future visual outcomes of individuals grappling with severe shortsightedness, scientifically termed high myopia.
This model aims to predict whether these individuals will experience positive or negative vision changes down the line.
High myopia, a condition characterized by the inability to focus on distant objects while maintaining clarity in close-range vision, poses a significant risk of irreversible blindness, making it a pressing global health concern. The research, recently featured in JAMA Ophthalmology, sought to harness the power of machine learning to forecast the likelihood of visual impairment over extended periods.
By scrutinizing data collected from nearly a thousand patients at Tokyo Medical and Dental University's Advanced Clinical Center for Myopia, the team embarked on a comprehensive analysis. They meticulously evaluated 34 key variables routinely recorded during ophthalmic examinations, encompassing factors like age, current visual acuity, and corneal diameter. Employing various machine-learning algorithms, including random forests and support vector machines, the researchers discovered that a logistic regression-based model exhibited the highest efficacy in predicting visual impairment at 3- and 5-year intervals.
Yet, the study didn't stop at predictive accuracy. Recognizing the importance of translating complex data into practical clinical insights, the researchers ingeniously crafted a nomogram. This graphical representation of the model's outcomes serves as a user-friendly tool for both clinicians and patients. Each variable's significance in predicting future visual acuity is visually depicted as a line, convertible into points that collectively signify the risk of impending visual impairment.
The implications of this research extend beyond its technical achievements. For individuals facing the dire consequences of vision loss, both financially and physically, this advancement could offer a beacon of hope. The global economic impact of severe visual impairment was estimated at a staggering USD 94.5 billion in 2019.
While further validation on a larger scale remains imperative, this study underscores the potential of machine-learning models in combating the escalating public health challenge posed by high myopia-induced sight loss.

Image: Myopic maculopathy, also referred to as myopic macular degeneration, stands as a prominent characteristic of pathologic myopia. Within the META-PM classification system, myopic maculopathy lesions are grouped into five categories: from no myopic retinal lesions (category 0) to macular atrophy (category 4), including tessellated fundus (category 1, Figure 1A), diffuse chorioretinal atrophy (category 2, Figure 1B&C), patchy chorioretinal atrophy (category 3, Figure 1D arrows), and macular atrophy (category 4, Figure 1E&F). Credit: Tokyo Medical and Dental University.

Image: A visual representation, known as a nomogram, was built to depict the model's insights. Longer lines indicate stronger variable impact on visual impairment (VI) after 5 years. Each variable corresponds to points, tallying up to calculate total points and the associated risk of VI. Credit: Tokyo Medical and Dental University.
--
Source: Tokyo Medical and Dental University (TMDU)
Full study: Wang Y, Du R, Xie S, et al. Machine Learning Models for Predicting Long-Term Visual Acuity in Highly Myopic Eyes. JAMA Ophthalmol. Published online October 26, 2023. doi:10.1001/jamaophthalmol.2023.4786
Read Also
New AI could predict whether or not those at high risk will develop glaucoma
#medtech#ophthalmology#eye#eyes#blindness#ai#artificial intelligence#diagnostics#health#medicine#health tech#machine learning
0 notes
Text
Transform Your Career: Essential Skills for Data Scientists in 2023

The field of data science offers students, and working professionals an appealing career path as the need for data scientists grows. This includes those who aren't data scientists but are nevertheless fascinated by data and data science, leading them to wonder what qualifications in big data and data science are necessary to work in the field. A data scientist's work includes gathering, organizing, evaluating, and drawing conclusions from vast volumes of data. Below mentioned are the essential skills for data scientists in 2023:
Statistics and probability:
Data scientists must study probability and statistics to create excellent machine-learning models and algorithms. Statistical analysis ideas like linear regression are crucial for machine learning. In addition to having a thorough understanding of terms like mean, median, mode, variance, and standard deviation, data scientists must be able to gather, analyze, organize, and display data.
youtube
Machine learning:
A data scientist should know pattern recognition, supervised and unsupervised learning, and data mining. Learning Python for data science is better for gaining knowledge in a specific field. You can acquire this skill by enrolling in a school that teaches you how to handle and get your hands dirty with data.
Data wrangling and database management:
The process of cleaning and organizing large, complicated data sets to make them easier to access and analyze is known as data wrangling. Making judgments based on data requires manipulating the data, which might take time to classify it according to patterns and trends and input and modify data values. Understanding database management is also necessary for this, and you must be able to extract data from various sources, structure it appropriately for query and analysis, and then load it into a data warehouse system.
Business expertise:
To better grasp the issues the company is attempting to address, data scientists must have a strong background in business within the sector in which they operate. The discipline of data science demands the identification of business-critical issues and the development of novel approaches for using data to address such problems.
Data visualization:
You should develop your data visualization abilities and knowledge of data analysis, organization, and classification. Several institutions offer fewer Python packages for data science, so you can use the opportunity to have a bright future. You can also learn the Python courses online. A data scientist must have the ability to make graphs and charts.
Working with unstructured data:
Data scientists require expertise or experience with unprocessed data from various sources and distribution methods. It is important for a data scientist working on a social media project to be proficient in using social media to produce useful research. This will assist your marketing team in using the information you provide to develop Data science is more practical, workable solutions.
Communication skills:
Communication skills are especially crucial for most sectors, especially for data scientists. A data scientist is a highly skilled person who specializes in extracting, interpreting, and analyzing data. But if they can't share their analysis and conclusions with the rest of their teams, that is a loss for the company. Some teams, like the research or marketing teams, lack the necessary expertise to comprehend the data and draw conclusions. Not only must data scientists locate this knowledge, but they also need to communicate it to others properly.
Interpersonal skills:
Establishing excellent working relationships with your team members and being able to deliver your findings to stakeholders will require you to build workplace skills like communication. Working well in teams is crucial for effectively communicating the data insights that data scientists find, much like data visualization.
Bottom line:
Whether you work as a recruiter or an employer, this list of abilities and traits of successful data scientists will help you find the top applicants. Make sure that, besides technical talents, the applicants you select have a strong combination of data intuition, statistical thinking abilities, a hacker's spirit, and a fair dose of creativity.
0 notes
Link
#Residential property price forecasting model#Supervised learning#Random Forest#Resilient planning#Disaster mitigation
1 note
·
View note
Text
Fwd: Course: Online.IntroBayesianDataAnalysis.Feb12-16
Begin forwarded message: > From: [email protected] > Subject: Course: Online.IntroBayesianDataAnalysis.Feb12-16 > Date: 6 November 2023 at 05:18:13 GMT > To: [email protected] > > > > Dear all, > > registrations are open for the upcoming course on "Bayesian Data Analysis: > Theory & Practice". > > **Course Details:** - **Dates:** February 12-16, 2024 - **Location:** > ONLINE (To encourage international participation) - **Location:** > ( https://ift.tt/0K45Vpw ) > > Our course is designed to provide a practical and application-oriented > introduction to Bayesian data analysis. It equips you with the essential > tools to "think like a Bayesian" by delving into explicit models of > the data-generating process. Throughout the course, you'll gain a solid > understanding of Bayesian data analysis concepts, complete with hands-on > exercises and real-world examples. > > This course is suitable for beginners looking for their first introduction > to Bayesian data analysis and those with prior experience in BDA and > Bayesian regression modeling. Basic familiarity with R is assumed, > and we'll be using the tidyverse. > > **Course Outline:** - **Monday:** Introduction, BDA basics, > generative-process models - **Tuesday:** MCMC methods, Bayesian parameter > inference, simple linear regression - **Wednesday:** Model checking, > generalized linear models - **Thursday:** Bayesian model comparison, > multi-level modeling - **Friday:** Good practices, reporting results, > open discussions > > For the full list of our courses and Workshops, please have a look at: > ( https://ift.tt/YOhxgUT ) > > Best regards, Carlo > > > Carlo Pecoraro, Ph.D > Physalia-courses DIRECTOR > [email protected] > mobile: +49 17645230846 > Follow us on ( https://ift.tt/38q4Zuf ) > > > > "[email protected]"
0 notes
Text
This Week in Rust 502
Hello and welcome to another issue of This Week in Rust! Rust is a programming language empowering everyone to build reliable and efficient software. This is a weekly summary of its progress and community. Want something mentioned? Tag us at @ThisWeekInRust on Twitter or @ThisWeekinRust on mastodon.social, or send us a pull request. Want to get involved? We love contributions.
This Week in Rust is openly developed on GitHub and archives can be viewed at this-week-in-rust.org. If you find any errors in this week's issue, please submit a PR.
Updates from Rust Community
Official
Rustfmt support for let-else statements
Newsletters
This Month in Rust GameDev #46 - May 2023
Project/Tooling Updates
rust-analyzer changelog #188
Pavex DevLog #5: redesigning our runtime types
Bevy XPBD: A physics engine for the Bevy game engine
complgen: Generate {bash,fish,zsh} completions from a single EBNF-like grammar
projectable: a command line TUI file manager
Observations/Thoughts
How To Wrap Your Errors With Enums When Using Error-Stack
Exploring Graphs in Rust. Yikes
Writing a Linked List in Rust: A Walkthrough
Tree-Structured Concurrency
Rust Notes on Temporary values (usage of Mutex) - 4
Method Overloading (kinda), and Advanced Trait Usage
Unlocking Possibilities: 4 Reasons Why ESP32 and Rust Make a Winning Combination
The magic of dependency resolution
Writing E2E Tests for Axum & GraphQL
Detailed web-based 3D rendering of mining spatial data
[video] Choose the Right Option
[video] 4 levels of Rust error handling
Rust Walkthroughs
Build a Ray Tracer, pt. 4 - The Next Dimension
Nine Rules for Running Rust on the Web and on Embedded: Practical Lessons from Porting range-set-blaze to no_std and WASM
Full Stack Rust Workshop: Shuttle, Actix Web, SQLx & Diouxus
Intercepting Allocations with the Global Allocator
A compressed indexable bitset
A persistent task queue in Rust
How I finally understood async/await in Rust (part 2: how does a pending future get woken?)
Miscellaneous
Verify Rust code in VS Code with the Kani VS Code extension
Reduce memory footprint by about 600% for M.E.D. — Performance Matters
New MeetUp Group in Canada: Rust Halifax
Crate of the Week
This week's crate is rustypaste, a minimal file upload/pastebin service.
Thanks to orhun for the self-suggestion!
Please submit your suggestions and votes for next week!
Call for Participation
Always wanted to contribute to open-source projects but did not know where to start? Every week we highlight some tasks from the Rust community for you to pick and get started!
Some of these tasks may also have mentors available, visit the task page for more information.
diesel - Most wanted missing features in diesel 1
diesel - Most wanted missing guide topic 1
css-inline - C bindings
mfcc-rust - create npy files for testing the input and output of cacheable functions
mfcc-rust - make all functions generic over f32 and f64
mfcc-rust - migrate mfcc to depend on mel_spectrogram
ockam - Change argument for ockam credential issue command from Identity to IdentityIdentifier 2
ockam - Use a background node for ockam project enroll 1
ockam - ockam project ticket should return a proper error message 1
RustQuant - Logistic regression is too slow (specifically the matrix inversions).
RustQuant - Implement a user interface (TUI or GUI).
RustQuant - Implement a Postgres interface. 1
RustQuant - Pricing model calibration module.
RustQuant - Add/improve documentation (esp. math related docs).
RustQuant - Increase test coverage (chore). 1
RustQuant - Compute returns from Yahoo finance data reader.
mirrord - mirrord shows loopcrashbackoff pods as possible targets 1
mirrord - Log problem in layer and exit when agent image is not found 1
Hyperswitch - Implement Code coverage for local system using Makefile
Hyperswitch - Add scoped error enum for customer error
Hyperswitch - move redis key creation to a common module
If you are a Rust project owner and are looking for contributors, please submit tasks here.
Updates from the Rust Project
410 pull requests were merged in the last week
support embedding LLVM bitcode on AIX
support for native WASM exceptions
fix(resolve): skip assertion judgment when NonModule is dummy
thir: Add Become expression kind
account for late-bound vars from parent arg-position impl trait
add -Zremark-dir unstable flag to write LLVM optimization remarks to YAML
add bidirectional where clauses on RPITIT synthesized GATs
add check for ConstKind::Value(_) to in_operand()
avoid calling queries during query stack printing
better messages for next on a iterator inside for loops
detect actual span for getting unexpected token from parsing macros
don't perform selection if inherent associated types are not enabled
don't suggest move for borrows that aren't closures
encode item bounds for DefKind::ImplTraitPlaceholder
error when RPITITs' hidden types capture more lifetimes than their trait definitions
export AnalysisResults trait in rustc_mir_dataflow
fix dropping_copy_types lint from linting in match-arm with side-effects
fix associated items effective visibility calculation for type privacy lints
fix type privacy lints error message
fix unset e_flags in ELF files generated for AVR targets
implement deep normalization via the new solver
implement most of MCP510
implement proposed API for proc_macro_span
implement selection via new trait solver
lint/ctypes: ext. abi fn-ptr in internal abi fn
make associated type bounds in supertrait position implied
make compiletest aware of targets without dynamic linking
make the Elaboratable trait take clauses
normalize opaques with late-bound vars again
normalize types when applying uninhabited predicate
privacy: type privacy lints fixes and cleanups
properly implement variances_of for RPITIT GAT
refactor metadata emission to avoid visiting HIR
resolve: remove artificial import ambiguity errors
simplify computation of killed borrows
suggest slice::swap for mem::swap(&mut x[0], &mut x[1]) borrowck error
add suggestion for bad block fragment error
use structured suggestion when telling user about for<'a>
mark wrapped intrinsics as inline(always)
make simd_shuffle_indices use valtrees
make UnwindAction::Continue explicit in MIR dump
mir opt + codegen: handle subtyping
miri: cargo-miri: better error message when RUSTC is not set
miri: make --quiet actually do something
miri: optional semantics for Unique
shrink error variants for layout and fn_abi
a mish-mash of micro-optimizations
codegen_gcc: add support for #[cold] attribute
allow comparing Boxes with different allocators
make rustc_on_unimplemented std-agnostic
stabilize const_cstr_methods
cargo: add READMEs for the credential helpers
cargo: don't try to compile cargo-credential-gnome-secret on non-Linux platforms
rustdoc: fix display of long items in search results
rustdoc: fix display of long inline cfg labels
rustdoc: allow whitespace as path separator like double colon
rustdoc: render generic params & where-clauses of cross-crate assoc tys in impls
rustfmt: don't skip semicolon if expressions follow
rustfmt: implement single_line_let_else_max_width
rustfmt: rewrite float literals ending in dots with parens in method calls
rustfmt: switch to tracing for logging
clippy: new lints: manual_try_fold, needless_raw_string_hashes, redundant_at_rest_pattern, tuple_array_conversions, manual_range_patterns, type_id_on_box, needless_pub_self, pub_with_shorthand and pub_without_shorthand
clippy: significant_drop_tightening: fix incorrect suggestion
clippy: arc_with_non_send_sync: don't lint if type has nested type parameters
clippy: let_and_return: lint 'static lifetimes, don't lint borrows in closures
clippy: missing_fields_in_debug: make sure self type is an adt
clippy: needless_raw_string_hashes: only reset hashes needed if not following quote
clippy: option_if_let_else: suggest .as_ref() if scrutinee is of type &Option<_>
clippy: question_mark: don't lint inside of try block
clippy: unused_async: don't lint if function is part of a trait
clippy: useless_vec: add more tests and don't lint inside of macros
clippy: useless_vec: use the source span for initializer
clippy: don't lint manual_let_else in cases where ? would work
clippy: don't lint code from external macros for 8 lints
clippy: make eq_op suggest .is_nan()
clippy: suggest is_some_and over map().unwrap
rust-analyzer: check Workspace Edit ResourceOps
rust-analyzer: disable mir interpreter for targets with different pointer size from host
rust-analyzer: editor/code: enable noImplicitOverride ts option
rust-analyzer: editor/code: use @tsconfig/strictest to define type checking rules
rust-analyzer: don't add panics to error jump list by default
rust-analyzer: fix self and super path resolution in block modules
rust-analyzer: fix data layout of reference to nested unsized structs
rust-analyzer: fix layout of simd types and respect align in mir interpreter
rust-analyzer: fix overflow checking in shift operator
rust-analyzer: fix panic in handle_code_action
rust-analyzer: fix realloc problem in allocating smaller amounts
rust-analyzer: fix runnable detection for #[tokio::test]
rust-analyzer: follow raw pointers in autoderef chain when resolving methods with custom receiver
rust-analyzer: map our diagnostics to rustc and clippy's ones
rust-analyzer: support #[derive_const(Trait)]
Rust Compiler Performance Triage
A quiet week, with a mixed set of improvements and regressions. Overall slightly more improvements than regressions.
Triage done by @simulacrum. Revision range: b5e51db16..52d8c490
4 Regressions, 4 Improvements, 2 Mixed; 0 of them in rollups
51 artifact comparisons made in total
Full report here
Approved RFCs
Changes to Rust follow the Rust RFC (request for comments) process. These are the RFCs that were approved for implementation this week:
No RFCs were approved this week.
Final Comment Period
Every week, the team announces the 'final comment period' for RFCs and key PRs which are reaching a decision. Express your opinions now.
RFCs
[disposition: merge] RFC: Start working on a Rust specification
Tracking Issues & PRs
[disposition: merge] Enable coinduction support for Safe Transmute
[disposition: close] feat: split unsafe_code lint into lint group
[disposition: merge] Correct the Android stat struct definitions
New and Updated RFCs
[new] Create a Testing sub-team
[new] Add f16 and f128 float types
[new] RFC: Nested Cargo packages
[new] Additional float types
Call for Testing
An important step for RFC implementation is for people to experiment with the implementation and give feedback, especially before stabilization. The following RFCs would benefit from user testing before moving forward:
No RFCs issued a call for testing this week.
If you are a feature implementer and would like your RFC to appear on the above list, add the new call-for-testing label to your RFC along with a comment providing testing instructions and/or guidance on which aspect(s) of the feature need testing.
Upcoming Events
Rusty Events between 2023-07-05 - 2023-08-02 🦀
Virtual
2023-07-05 | Virtual (Indianapolis, IN, US) | Indy Rust
Indy.rs - with Social Distancing
2023-07-05 | Virtual (Stuttgart, DE) | Rust Community Stuttgart
Rust-Meetup
2023-07-06 | Virtual (Ciudad de México, MX) | Rust MX
Rust y Haskell
2023-07-11 | Virtual (Buffalo, NY, US) | Buffalo Rust Meetup
Buffalo Rust User Group, July Meetup
2023-07-11 | Virtual (Dallas, TX, US) | Dallas Rust
Second Tuesday
2023-07-11 - 2023-07-13 | Virtual (Europe) | Mainmatter
Web-based Services in Rust, 3-day Workshop with Stefan Baumgartner
2023-07-13 - 2023-07-14 | Virtual | Scientific Computing in Rust
Scientific Computing in Rust workshop
2023-07-13 | Virtual (Edinburgh, UK) | Rust Edinburgh
Reasoning about Rust: an introduction to Rustdoc’s JSON format
2023-07-13 | Virtual (Nuremberg, DE) | Rust Nuremberg
Rust Nürnberg online #27
2023-07-18 | Virtual (Berlin, DE) | OpenTechSchool Berlin
Rust Hack and Learn
2023-07-19 | Virtual (Vancouver, BC, CA) | Vancouver Rust
Rust Study/Hack/Hang-out
2023-07-20 | Virtual (Tehran, IR) | Iran Rust Meetup
Iran Rust Meetup #12 - Ownership and Memory management
2023-07-25 | Virtual (Dallas, TX, US) | Dallas Rust
Last Tuesday
Asia
2023-07-08 | Bangalore, IN | Rust India
Rust India monthly meetup
Europe
2023-07-05 | Lyon, FR | Rust Lyon
Rust Lyon Meetup #5
2023-07-11 | Breda, NL | Rust Nederland
Rust: Advanced Graphics and User Interfaces
2023-07-13 | Berlin, DE | Rust Berlin
Rust and Tell - beer garden Edition
2023-07-13 | Reading, UK | Reading Rust Workshop
Reading Rust Meetup at Browns
2023-07-21 | Nuremberg, DE | Rust Nuremberg
Rust Nuremberg Get Together #2
North America
2023-07-07 | Chicago, IL, US | Deep Dish Rust
Rust Lunch
2023-07-12 | Austin, TX, US | Rust ATX
Rust Lunch - Fareground
2023-07-12 | Waterloo, ON, CA | Rust KW
Overengineering FizzBuzz
2023-07-13 | Lehi, UT, US | Utah Rust
Writing Kuberenetes Operators in Rust
2023-07-13 | Mountain View, CA, US | Mountain View Rust Meetup
Rust Meetup at Hacker Dojo
2023-07-13 | Seattle, WA, US | Seattle Rust User Group
July Meetup
2023-07-18 | San Francisco, CA, US | San Francisco Rust Study Group
Rust Hacking in Person
Oceania
2023-07-11 | Christchurch, NZ | Christchurch Rust Meetup Group
Christchurch Rust meetup meeting
2023-07-11 | Melbourne, VIC, AU | Rust Melbourne
(Hybrid - in person & online) July 2023 Rust Melbourne Meetup
If you are running a Rust event please add it to the calendar to get it mentioned here. Please remember to add a link to the event too. Email the Rust Community Team for access.
Jobs
Please see the latest Who's Hiring thread on r/rust
Quote of the Week
I'm not here to tell you that Rust is the best language....... you should have figured that out by now.
– Jester Hartman on youtube
Thanks to newpavlov for the suggestion!
Please submit quotes and vote for next week!
This Week in Rust is edited by: nellshamrell, llogiq, cdmistman, ericseppanen, extrawurst, andrewpollack, U007D, kolharsam, joelmarcey, mariannegoldin, bennyvasquez.
Email list hosting is sponsored by The Rust Foundation
Discuss on r/rust
0 notes
Note
i like your art style a lot–have you always drawn this way, or is it something u developed over time? do u have any tips for drawing in the general sparklecat/old internet art style or similar?
1. Thank uuuuu <3
2. Under cut ⬇️
It's a mix of both- my current sort of diary art/stress relief/ wholesome style is a replication of my elementary school art style! (Like 5th grade, not 2nd lol. I was still drawing stick guys blowing up zombies with tanks and crap back then)
Otherwise, my other styles are style emulations, essentally!
I'll break it down rq:
Mostly based off my own childhood art:

Natural progression of my art as I grew up:

Style "emulation" (le me making an amalgamation of liek 20000 old deviantart artists into one image)

Most of the sparklecat and scenedog art I draw like the above, is inspired by the works I stockpile from deviantart deep dives, and archive blogs. They're not emulations of one style, but multiple styles, taking parts I like or think are the most 'authentic'- essentially, I do what your young brain would have done without thinking, but I have to do it on purpose haha
My tip: while practicing, I'd say absolutely do studies of peoples entire DA galleries and figure out what works best for you.
Above all else I can't say anything else but like. Age regress lmao. If you can't do that, just do everything you can otherwise to put yourself in the headspace of the art you're emulating.
Put on old Amnesia playthroughs on YouTube, listen to Yaoi Nightcore playlists, edgy scourge AMVs, Naruto YTP, the whole Twilight movie- really whatever you listened to back in the day. Put that back on in the BG. Open current MsPaint or your preferred emulation of old MsPaint, or a free art software like medibang. (Don't download cool brushes. Work with Pen 1 and Airbrush or whatever.)
Use references of the era you want to emulate and use only those. Take all your current knowledge of art and BIN IT. The #1 problem in most emulation art even I have a really, really hard time with- is your stuff looking too modern because your art style is modern. Your tools are modern. Your mindset is modern. It will make your art look uncanny.
Don't try hard. It's really temping to draw the most rawrxd scenecore webcore hot topic revival 100 gecs whatever, I get that I guess- but it won't look like it's from the era. It's really hard to get x3randum ☆~ iTs rAinIng TACOOZZZZZZ ~☆ humor right, so don't try it for your first and submerge yourself in the era first. Tryhard sparkles are a real issue and you risk making your art look like it's snark.
Small canvases and or destroy your image quality. I don't do this as much as I should but it definitely adds to the look LULs
I will say, I have no idea otherwise because I come from a very privileged background when it comes to style emulation which is that I grew up planning to be an animator and thus, in my critical years, I was basically 100% drive on the ability to draw characters in many styles, on model. If you don't have this skill, it'll be a lot harder I'm sure.
Use your non dominant hand for especially young looking art. (If you have one. If not... uh... try your mouth?) (~that's what she said~)
(I mean. If you're *going for* the look of 'yes it's 2023 yes I'm bringing back this' go ahead, it just won't look genuine in the slightest and I am someone who's art journey is about doing all I can to emulate authenticity. Just adding this because I know a lot of people are! Go make that modern sparkledog eyeburner mary sue antisnark! It's just not my cup of tea. And I can't really give any pointers kthxbai)
#its kinda hard to say im always at least waist deep in the simulacrum#i basically run vista and play early xbox and playstation games while drinking mtn dew all day#ride my dirt bike. watch twilight and the hunger games on my#portable dvd player. play on one of my DS.#listen to scremo posthardcore crap on my ipod. epic fail on my skateboard (tfw no paved driveway)#for all intents and purposes i am a 20 year old adulthood dropout and professional teenager who dabbles in toddlerhood#when i draw idk... broseph. jesus takes the wheel#just stare at some black airbrush shaded firestar on deviantart for 300 hours and eventually itll click#wishing you the best of luck and please update me im always lewkin for ppl to colab wit and stuffs#but yea#go study the art of being a kid and im not joking#adulthood? poisoning my art? morelikely than u think...#but if you buy old rubber meme bracelets with grumpy cat or troll faces before me im PUNCHIN YR LIGHTS OUT#roflroflrofl
12 notes
·
View notes