#SoilMapping
Explore tagged Tumblr posts
Visit Tumblr Blog
Explore Tumblr blogs with no restrictions, modern design and the best experience.
Last Seen Tumblr Blogs


Fun Fact
Tumblr posted its first advertisements in May 2012 and subsequently earned $13M in revenue.
Text
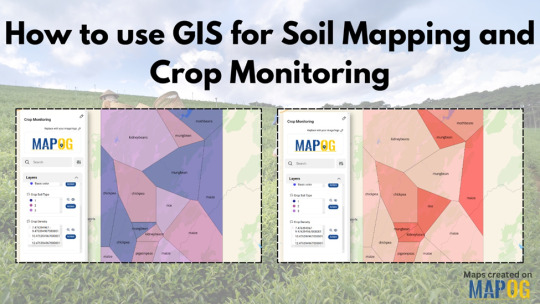
How to use GIS for Soil Mapping and Crop Monitoring
Soil health and crop productivity are directly tied to how well we understand the land beneath our feet. Yet, one of the biggest challenges farmers, agricultural scientists, and policymakers face is making sense of diverse, scattered data about soil types, nutrient availability, and crop coverage. That’s where GIS come in. GIS allows us to consolidate, visualize, and analyze this data spatially—helping turn raw numbers into decisions that improve yields and sustainability.
GIS: Bridging Soil Science and Smart Agriculture
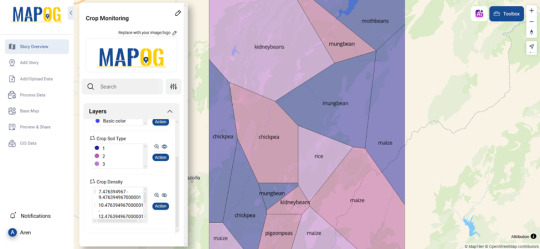
GIS isn’t just about maps—it’s a full-blown analytical system that lets you layer, compare, and interpret complex datasets. When applied to soil and crop monitoring, GIS becomes a powerful tool to visualize patterns across large areas: where soil is fertile, where it's degrading, or where certain crops are thriving or failing. Instead of working with spreadsheets or text reports, you can literally see what's happening in the field.
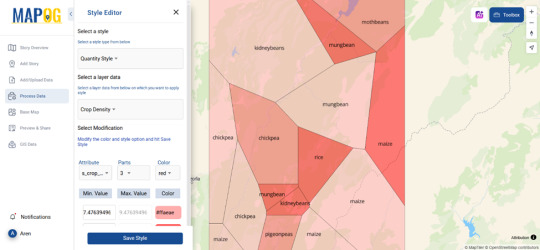
For example, by collecting point-based data on soil moisture, pH, or nutrient density, and then converting it into polygon layers, one can observe how these attributes vary across a landscape. You can even overlay crop yield data to detect trends, inefficiencies, or threats like erosion or over-farming. Visualization modes like “by category” or “by quantity” help highlight differences in soil types or crop densities across regions, letting you respond with targeted action.
Industries Benefiting from GIS in Agriculture
Modern agriculture is already shifting from intuition-based to data-driven decision making, and GIS is central to that transition. Large-scale farms use it for precision farming—deciding which parts of a field need more or less irrigation or fertilization. Government agencies use GIS-based maps to monitor food security, plan subsidies, or enforce land-use policies. Agri-tech startups, environmental consultancies, and even NGOs are leveraging it to create sustainable farming models that can be scaled across regions.
A Practical Way to Begin
If you're curious about applying GIS without diving into complex software, One such example is MAPOG, where you can upload your geospatial data and transform it into interactive stories or analysis-ready visualizations. It’s especially helpful for users looking to combine GIS with storytelling—ideal for reports, presentations, or even education.
Conclusion:
Whether you're managing a farm, analyzing policy impact, or running sustainability programs, GIS offers a way to make soil and crop monitoring clearer, faster, and more effective. When data meets maps, decision-making becomes smarter. If you’re dealing with agricultural data and looking for a tool to visualize and understand it better, it’s worth trying platforms like MAPOG to see how it can elevate your analysis.
#mapog#gis#spatial analysis#mapping#SoilMapping#CropMonitoring#GISinAgriculture#sustainablefarming#agritech#agriculture
0 notes
Text
0 notes
Text


This map is called "Reign of Italy, according to new borders". A 1922 map realized by the IG De Agostini and we deeply restored it nad realized this shaded relief map.
Map info: Carta del regno d'Italia secondo i nuovi confini, Istituto Geografico De Agostini. 1922. Source: BnF Gallica
If you like our work, want to see our daily updates (or want to say hello to our studio), consider to follow our Instagram or Twitter account. Otherwise if are interested in our prints or have a custom request check our shop.
#italy🇮🇹#mappa#italymountains#alps#italygram#visititaly#soilmap#mapart#shadedrelief#3dmap#3dart#blenderart#digitalartist#3drender#b3d#italymap#travelitaly#italyturism#italyravellers
1 note
·
View note
Photo

get me off my crutches n back to my office plz #soilmapping (at Blue Ridge, Georgia)
0 notes
Text
Works Referenced
Land Area - world statistics and charts as map, diagram and table. (n.d.). Retrieved November 26, 2017, from http://world.bymap.org/LandArea.html
Rosenberg, M. (n.d.). Important Facts About Mount Everest. Retrieved November 26, 2017, from https://www.thoughtco.com/mount-everest-overview-1435553
Hays, J. (n.d.). YELLOW RIVER. Retrieved November 26, 2017, from http://factsanddetails.com/china/cat15/sub103/item448.html
(n.d.). Retrieved November 26, 2017, from http://www.sciencemag.org/site/feature/misc/webfeat/soilmap/soil_chinaer.html
Baranov, A. N. (1968). The world atlas. Moskow.
0 notes
Text
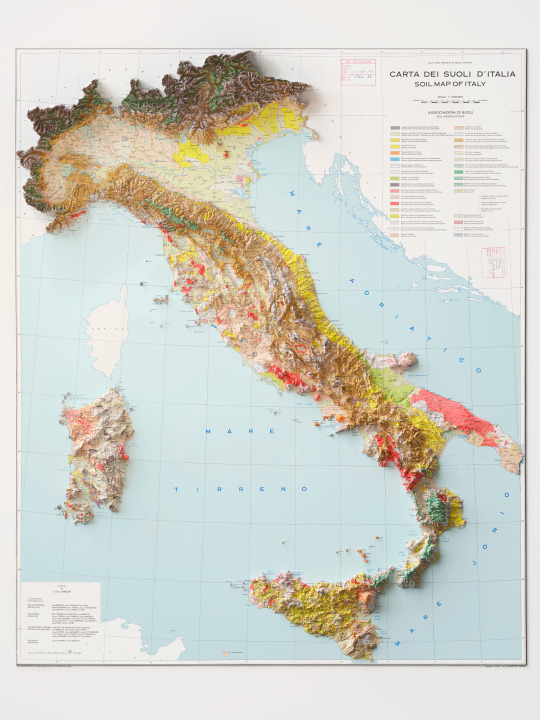
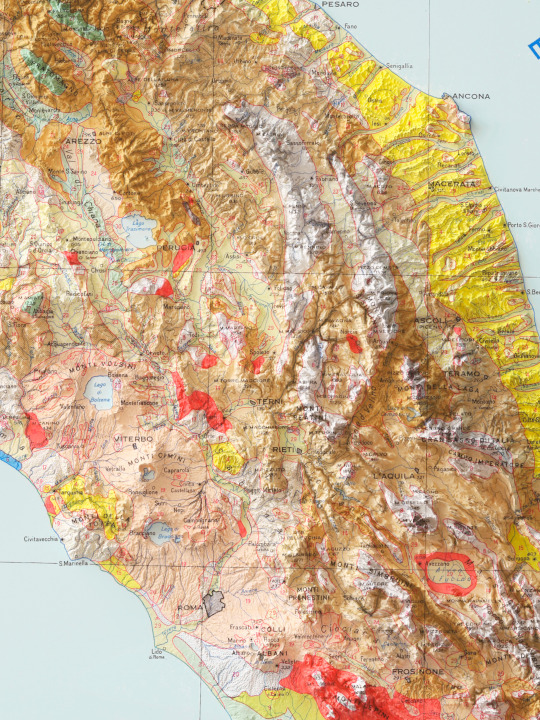
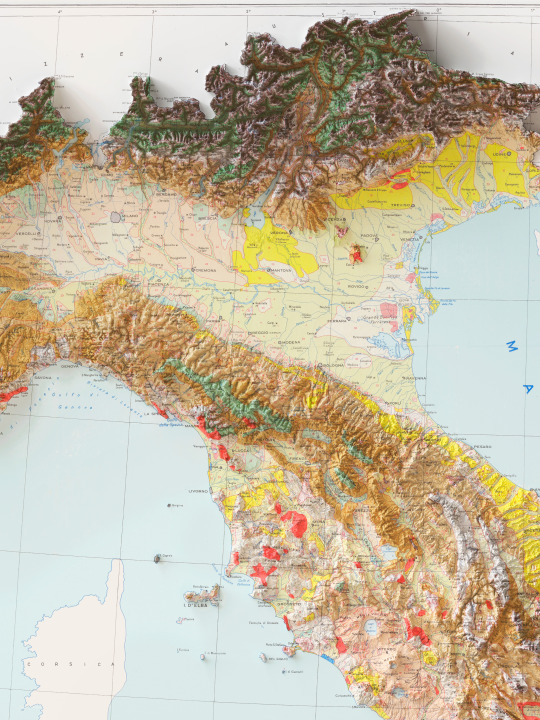

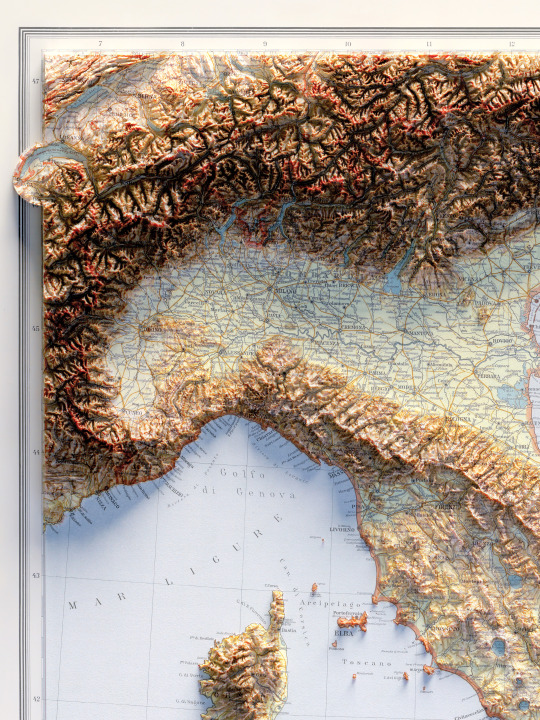
Here we are with our final Soil map of Italy, from 1966. 🗺️ 𝗠𝗔𝗣 𝗜𝗡𝗙𝗢 Soil Map of Italy - Carta dei suoli d'Italia. Società Geografica, Mancini F.;1966. Source: EUDASM.
If you like our work, want to see our daily updates (or want to say hello to our studio), consider to follow our Instagram or Twitter account. Otherwise if are interested in our prints or have a custom request check our shop.
#italy🇮🇹#mappa#italymountains#alps#italygram#visititaly#soilmap#mapart#shadedrelief#3dmap#3dart#blenderart#digitalartist#3drender#b3d#italymap#travelitaly#italyturism#italyravellers#cartography#soil map
1 note
·
View note