#TrendReversal
Explore tagged Tumblr posts
Visit Tumblr Blog
Explore Tumblr blogs with no restrictions, modern design and the best experience.
Last Seen Tumblr Blogs


Fun Fact
China blocked Tumblr because of pornography and censorship problems in 2013.
Link
#chartpatterns#FibonacciLevels#FibonacciRetracementTrading#GoldenRatio#MarketPrediction#marketvolatility#priceaction#ProfitTaking#riskmanagement#StockMarket#supportandresistance#technicalanalysis#TradeEntryPoints#TradingSignals#TradingStrategy#TrendReversal
0 notes
Text
Enhance Your Trading Strategy with the Relative Vigor Index (RVI)
Ever feel like your trading strategy could use a little boost? Enter the Relative Vigor Index (RVI), a technical analysis tool that’s like a double shot of espresso for your trading game. Just as we tend to feel energized when things are on the up (or after a good coffee), asset prices typically close higher during uptrends. Let’s dive into how the RVI indicator can help you identify these momentum-packed market moves.
Read more: https://www.investchannels.com/boost-your-trading-strategy-with-the-relative-vigor-index-rvi/
What is the Relative Vigor Index (RVI)?
The Relative Vigor Index, or RVI, is a momentum oscillator that helps traders gauge the strength and direction of a market trend. It operates by comparing an asset’s closing price with its overall trading range and then smoothing this data with a simple moving average (SMA). The core idea behind the RVI is to capitalize on a common market behavior: during uptrends, prices tend to close higher than they open, and the opposite happens in downtrends. This characteristic makes the RVI a useful tool for traders seeking a clear view of the market’s momentum.
How Does the Relative Vigor Index (RVI) Work?
As traders analyze the RVI, they’ll notice its values increase as an uptrend builds. In this bullish setting, an asset’s closing price generally gravitates toward the top of its trading range, while the opening price sits closer to the bottom. Essentially, when markets are trending upwards, prices tend to close stronger than they opened; conversely, downtrends see prices weakening toward the end of the trading session.
Much like other oscillators, such as the Moving Average Convergence Divergence (MACD) or the Relative Strength Index (RSI), the RVI oscillates around a central line. Rather than tracking price movements directly, it rotates around this central point, which is often displayed separately beneath the main price chart. Understanding this nuance is essential for using the RVI effectively within a trading toolkit.
Building a Strategy with the Relative Vigor Index (RVI)
There are several methods traders can use with the RVI to understand market trends and identify potential entry points. Two of the most widely used techniques are spotting divergences and observing crossovers. Let’s explore each approach in more detail.
Divergence in the RVI
One of the primary functions of the RVI is to identify divergences, which happen when the RVI moves in one direction while the asset price moves in another. Such divergence can indicate a likely trend reversal in the direction of the RVI. For example, if an asset’s price is rising, but the RVI is falling, this could be a signal that a reversal is imminent.
As a leading indicator, the RVI often highlights possible trend changes before they appear on the price chart. When the RVI’s movement diverges from the asset’s price, it frequently serves as an early warning of a potential shift in trend. This divergence can offer traders an advantage by allowing them to adjust their strategies ahead of the curve.
RVI Crossovers
Another popular way to read the RVI is through crossovers, which occur when the RVI line crosses above or below its centerline. If the RVI line crosses above the centerline, it signals a potential uptrend, while crossing below suggests a possible downtrend. These crossovers serve as early indicators of where the price might move next, helping traders to position themselves accordingly.
Including the RVI in your trading arsenal can provide an added layer of insight into market momentum, helping you stay one step ahead of potential price moves. Whether you’re looking for divergences or following crossovers, the RVI provides key insights that can help refine your strategy and boost your confidence in navigating the markets.
Optimizing the Relative Vigor Index (RVI) Settings
To improve the RVI’s accuracy, traders might consider adjusting its timeframe settings. Extending the timeframe can help smooth out short-term fluctuations, enabling the RVI to capture the broader market trend more reliably. This adjustment allows the RVI to focus on the bigger picture, providing clearer signals by filtering out some of the short-term market noise.
If you’re trading on platforms like IQ Option, you can easily find and apply the RVI by going to the “Indicators” section, searching for “Relative Vigor Index,” and adjusting settings directly on the price chart. Testing different configurations can help you find the setup that best aligns with your trading style and goals.
Relative Vigor Index (RVI) vs. Relative Strength Index (RSI)
Since both the RVI and RSI belong to the oscillator category, they share certain similarities. However, they serve distinct purposes and can provide traders with different insights, making it essential to know when to use each.
The RSI is primarily designed to identify overbought and oversold conditions, which helps traders recognize extreme market levels. The RVI, in contrast, focuses on the direction and momentum of the trend, offering clues about the current market sentiment—whether it’s bullish or bearish. While the RSI evaluates the trend’s strength, the RVI guides traders toward the prevailing sentiment, making it useful for capturing opportune moments to enter a trade.
Combining Indicators for a More Comprehensive Strategy
Many experienced traders enhance their strategies by combining several indicators to get a more comprehensive view of market behavior. By blending multiple tools, traders can achieve a clearer and more accurate reading, which helps them make informed trading decisions. For example, pairing the RVI with indicators like the RSI or MACD can reveal insights that may not be as apparent with just one tool.
Experimenting with different indicators can help you develop a toolkit that aligns with your trading approach. Whether you prefer to rely on the RVI, RSI, or a combination, taking the time to test different strategies can help you craft a unique approach that suits your specific goals and risk tolerance.
By exploring the Relative Vigor Index and integrating it into your trading strategy, you can unlock deeper insights into market momentum and potential reversals. With practice and patience, the RVI can become a valuable tool in your trading toolkit—empowering you to identify trend shifts, anticipate moves, and navigate the markets with greater precision and confidence.
#TradingStrategy#TechnicalAnalysis#ForexTrading#CryptoTrading#StockMarket#Forex#DayTrading#RelativeVigorIndex#RVI#TradingIndicators#MomentumIndicators#RVIIndicator#Oscillator#MarketAnalysis#PriceAction#TrendReversal#TradingSignals#ForexStrategy#CryptoAnalysis#SwingTrading#Investing#FinancialMarkets#StockAnalysis#CryptoInvesting#ForexCommunity#TradingTools#FinancialEducation
0 notes
Text
Forex Best Indicator for Trend Reversal: Maximize Your Trading Success
Looking for the Forex best indicator for trend reversal. Discover proven tools like the MACD, RSI, and Parabolic SAR on MiyagiTrading, designed to enhance trading precision by signaling market shifts with accuracy. These powerful indicators are customizable and ideal for spotting entry and exit points, helping you stay ahead of trends. Tailor your strategy with MiyagiTrading’s advanced tools to gain reliable insights in dynamic markets and boost your trading outcomes.
Visit:- https://miyagitrading.com/best-trend-reversal-indicator/
0 notes
Text
Trend reversal patterns | tradesense institute
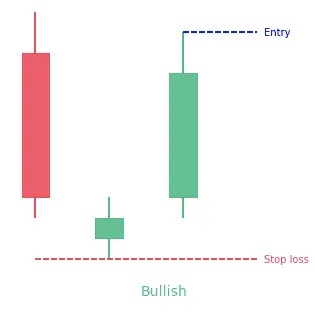
The trend reversal candlestick patterns are commonly used in technical analysis to indicate indecision in the market. They indicate that the market's trend, which may have been going either up or down, is probably going to change.
Traders can use these patterns to help them decide whether to purchase or sell a specific security when making investing decisions.
There are various types of trend reversal patterns five of which are listed below:
Morning star
Evening star
Bullish engulfing
Bearish engulfing
Tweezer bottom
View on wordpress
#Chart patterns#Price action trading#Trading basics#Technical analysis#Candlestick patterns#Reversal patterns#trendreversal#morningstar candlestick#eveningstar candlestick
1 note
·
View note
Text
youtube
Identify trend direction quickly and get precise entry and exit points. Non-repainting and identifies best trade opportunities. Make the most out of it now. https://www.youtube.com/watch?v=DqIsCEmx-yM
#trendpower#nonrepainting#accurateindicator#mt4indicatormt5#mt5indicator#takeprofit#stoploss#trendreversal#tradingsystem#tradersir#Youtube
0 notes
Text
Heikin-Ashi Trading Strategy: A Game-Changer for trader
Discover the Heikin-Ashi Trading Strategy, a unique approach to Forex trading that combines candlestick charts and momentum indicators. Learn how this powerful strategy can help you identify trend reversals and improve your trading performance.

The Heikin-Ashi charting technique is a unique and popular tool used by traders in the financial markets, particularly in the forex market. It provides a different perspective compared to traditional candlestick charts and offers valuable insights into price trends and reversals. This article will delve into the intricacies of the Heikin-Ashi Trading Strategy, exploring its calculation method, advantages, and how to effectively trade with it.
Understanding Heikin-Ashi Charts:
Heikin-Ashi charts resemble candlestick charts in appearance, but their construction and plotting differ significantly. Candlestick charts display the Open, Close, High, and Low prices for each period, whereas Heikin-Ashi charts utilize calculations based on the previous candle to plot the current one. This unique approach contributes to the smoothness of the Heikin-Ashi candles and provides a different perspective on market trends.
Here is how the four components of a Heikin-Ashi candle are calculated:
It is important to note that Heikin-Ashi candles are interdependent as the close and open prices of each candle are calculated using the previous candle's close and open prices. Moreover, the high and low prices are influenced by the preceding candle. This interrelation between candles contributes to the smoothing effect and delayed signals of Heikin-Ashi charts.
Advantages of Heikin-Ashi Trading:
Trading with Heikin-Ashi:
The Heikin-Ashi Trading Strategy combines the power of Heikin-Ashi reversal patterns with popular momentum indicators to enhance trading decisions. Here is a step-by-step guide on how to trade with Heikin-Ashi:
The Heikin-Ashi Trading Strategy is a powerful approach for traders in the forex market. By incorporating Heikin-Ashi charts and combining them with momentum indicators like the Stochastic Oscillator, traders can improve the accuracy of their trading decisions. The strategy's advantages, including smoothed price action, delayed signals, and clear trend identification, have contributed to its popularity among forex traders. However, it is essential to practice proper risk management and thoroughly backtest the strategy before applying it to live trading.
Please note that the answers provided above are for informational purposes only and should not be considered as financial advice. Trading in financial markets carries risks, and individuals should conduct thorough research and seek professional guidance before making any trading decisions.
#ForexTrading #TradingStrategy #HeikinAshi #CandlestickCharts #MomentumFilters #TrendReversals #TechnicalAnalysis
0 notes
Photo
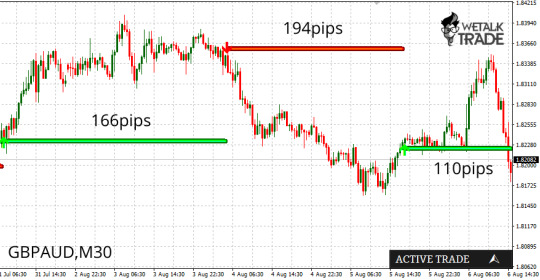
470 pips in GBP/AUD! Want to make such a large amount of pips? And regularly? Try Pipbreaker, the technical indicator that hits the target with accuracy! https://wetalktrade.com/best-indicator-for-mt4/ Reach us anytime and get more proofs and reviews. https://lc.chat/qa/6835931
#pipbreaker#supportandresistance#movingpattern#metals#trendreversal#buysellpoints#positiontrader#GBPAUD#wetalktrade
2 notes
·
View notes
Text
How to Read and Interpret Candlestick Charts in Trading
Mastering the Art of Analyzing Candlestick Charts for Effective Trading By Amir Shayan Candlestick charts are one of the most popular and widely used tools in technical analysis. They provide valuable insights into price action, market sentiment, and potential trading opportunities. If you're new to trading or want to enhance your chart analysis skills, learning how to read and interpret candlestick charts is essential. In this article, we will guide you through the process of understanding candlestick charts and using them effectively in your trading strategy.
What are Candlestick Charts?
Candlestick charts originated in Japan in the 18th century and have become a staple in technical analysis. They visually represent price movements over a specific time period, displaying the opening, closing, and high, and low prices of an asset. Each candlestick consists of a rectangular body and two wicks, also known as shadows or tails. The body of the candlestick represents the price range between the opening and closing prices. If the closing price exceeds the opening price, the body is typically filled or colored green, indicating a bullish or positive candle. Conversely, if the closing price is lower than the opening price, the body is typically hollow or colored red, indicating a bearish or negative candle. The wicks represent the price extremes reached during the time period. The upper wick extends from the top of the body and represents the highest price reached, while the lower wick extends from the bottom of the body and represents the lowest price reached.
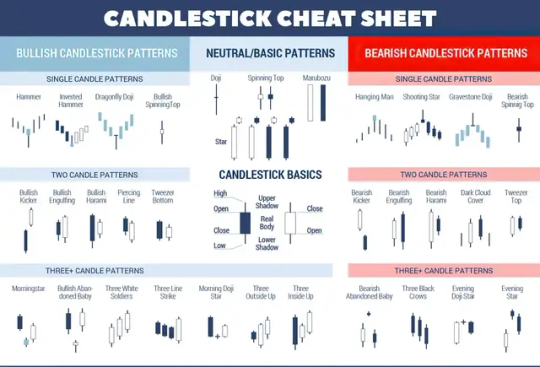
Reading Candlestick Patterns
Candlestick patterns consist of one or more candlesticks arranged in specific formations. These patterns provide traders with valuable information about market sentiment and potential trend reversals. Here are some common candlestick patterns and their interpretations: - Bullish Engulfing Pattern: This pattern occurs when a small bearish candle is followed by a larger bullish candle that completely engulfs the previous candle. It indicates a potential reversal from a bearish to a bullish trend. - Bearish Engulfing Pattern: The opposite of the bullish engulfing pattern occurs when a small bullish candle is followed by a larger bearish candle that engulfs the previous candle. It suggests a potential reversal from a bullish to a bearish trend. - Hammer: A hammer candlestick has a small body and a long lower wick, resembling a hammer. It indicates a potential reversal from a downtrend to an uptrend and is considered a bullish signal. - Shooting Star: The shooting star candlestick has a small body and a long upper wick, resembling a shooting star. It suggests a potential reversal from an uptrend to a downtrend and is considered a bearish signal. - Doji: A doji candlestick has a small body and occurs when the opening and closing prices are virtually the same. It indicates indecision in the market and suggests a potential trend reversal.
Interpreting Candlestick Chart Patterns
While individual candlestick patterns can provide valuable insights, it is important to consider them within the context of the overall chart and other technical indicators. Here are some tips for interpreting candlestick chart patterns: - Trend Confirmation: Candlestick patterns can help confirm the continuation or reversal of an existing trend. For example, a series of bullish candlestick patterns in an uptrend may indicate the continuation of the upward movement. - Support and Resistance Levels: Candlestick patterns can provide clues about support and resistance levels. For instance, a bullish reversal pattern forming near a strong support level may suggest a potential bounce in prices. - Volume Analysis: Combining candlestick patterns with volume analysis can provide additional confirmation. Higher volume during a bullish pattern or lower volume during a bearish pattern can strengthen the validity of the signal. - Timeframe Consideration: Different candlestick patterns may have varying degrees of significance depending on the timeframe you're analyzing. A pattern that is significant on a daily chart may have less relevance on a shorter intraday chart. Candlestick patterns are best used in conjunction with other technical analysis tools and indicators to form a comprehensive trading strategy. Here are some additional factors to consider when interpreting candlestick charts: - Chart Patterns: Look for the formation of chart patterns alongside candlestick patterns. For example, a bullish candlestick pattern occurring within a bullish continuation pattern, such as a flag or a triangle, can strengthen the bullish bias. - Confluence of Signals: Seek confluence between candlestick patterns, support/resistance levels, trendlines, and other technical indicators. When multiple signals align, it increases the probability of a successful trade. - Market Conditions: Consider the broader market conditions and fundamental factors that may influence price movements. Candlestick patterns are more reliable when they align with the overall market trend and relevant news events. - Risk Management: Always implement proper risk management techniques, such as setting stop-loss orders and calculating risk-reward ratios. Candlestick patterns provide insights into potential market reversals, but risk management is crucial to protect your capital. - Practice and Observation: As with any trading skill, practice is essential. Familiarize yourself with different candlestick patterns and observe how they perform in real-market scenarios. Keep a trading journal to track the effectiveness of different patterns and refine your trading strategy over time.
Conclusion
Mastering the art of reading and interpreting candlestick charts can significantly enhance your trading decisions. Candlestick patterns offer valuable insights into market sentiment, trend reversals, and potential trading opportunities. However, it is important to remember that candlestick analysis should not be used in isolation but as part of a comprehensive trading strategy that incorporates other technical analysis tools and fundamental analysis. By combining candlestick patterns with other indicators and considering the broader market context, you can improve your trading accuracy and make informed decisions in the dynamic world of trading. Remember to practice and gain experience in applying candlestick patterns to different market scenarios. With time, patience, and diligent analysis, you can harness the power of candlestick charts to become a more proficient and successful trader. Read the full article
#bearishpatterns#bullishpatterns#candlestickcharts#chartanalysis#marketsentiment#priceaction#Technicalanalysis#tradingstrategy#Tradingtools#trendreversal
0 notes
Link
#Asianmarkets#candlestickpatterns#MildlyHigher#positive#riskmanagement#technicalanalysis#tradingstrategies#trendreversal#Trends#Tuesday#USmarkets
0 notes
Link
#chartpatterns#EntryandExitPoints#markettrends#marketvolatility#MomentumTrading#OverboughtandOversold#priceaction#ProfitTaking#RelativeStrengthIndex#riskmanagement#RSITrading#StockMarket#technicalanalysis#TradingSignals#TradingStrategy#TrendReversal
0 notes
Photo
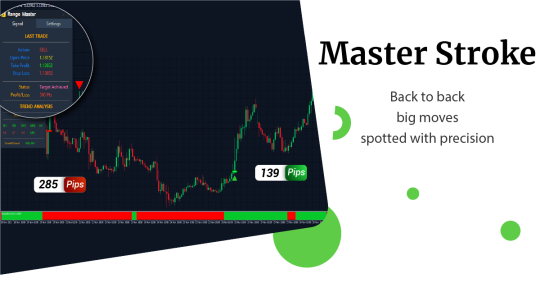
Can you spot back-to-back big moves in the market? Range Master's advanced algorithm can spot trend reversal swiftly. It gives the users an edge by getting in early and exiting when others enter.
Trade like a master with Range Master now. http://fmentor.com/
0 notes
Photo

Could be costly!
0 notes
Photo
If the trend is your friend, then trend reversal is your foe. Knowing your foes is as important as knowing your friends. So, get to know the potential trend reversal points with Harmonic patterns here. https://frxe.com/harmonic-patterns/
#frxe#harmonicpattern#gartleypattern#butterflypattern#crabpattern#prictionactiontrading#priceaction#trendreversal#trendisyourfriend#technicalanalysis#bitcointrading#eurusd#gbpusd#gbpjpy#eurgbp#btcusd
0 notes
Photo

Morning & Evening #DojiStar #CandleStick #StockAnalysis for timing your entry #TrendReversal #fidelity #stocks #nyse #nasdaq #fidelityinvestments #etf #mutualfunds #invest #cryptocurrency #crypto #bitcoin #finance #stockmarket #brokerage https://www.instagram.com/p/B_19WeKnV4i/?igshid=v6727oxb6xoy
#dojistar#candlestick#stockanalysis#trendreversal#fidelity#stocks#nyse#nasdaq#fidelityinvestments#etf#mutualfunds#invest#cryptocurrency#crypto#bitcoin#finance#stockmarket#brokerage
0 notes
Link
Identify trend direction quickly and get precise entry and exit points. Non-repainting and identifies best trade opportunities. Make the most out of it now. https://www.youtube.com/watch?v=DqIsCEmx-yM
#trendpower#nonrepainting#accurateindicator#mt4indicator#mt5indicator#takeprofit#stoploss#trendreversal#tradingsystem#tradersir
0 notes
Photo

#OnInvesting #Buying&Selling The Best Time To Buy Is When The Price Starts Gaining After Losing A Lot... And The Best Time To Sell Is When The Price Starts Losing After Gaining A Lot... (Carefully..., Have A Closer Look At The TrendLine) #TrendReversal #Trends #TrendConfirmation Read my thoughts on @YourQuoteApp #yourquote #quote #stories #qotd #quoteoftheday #wordporn #quotestagram #wordswag #wordsofwisdom #inspirationalquotes #writeaway #thoughts #poetry #instawriters #writersofinstagram #writersofig #writersofindia #igwriters #igwritersclub https://www.instagram.com/p/BwruwObg9by/?utm_source=ig_tumblr_share&igshid=ehh71z39mroz
#oninvesting#buying#trendreversal#trends#trendconfirmation#yourquote#quote#stories#qotd#quoteoftheday#wordporn#quotestagram#wordswag#wordsofwisdom#inspirationalquotes#writeaway#thoughts#poetry#instawriters#writersofinstagram#writersofig#writersofindia#igwriters#igwritersclub
0 notes