#Candlestick patterns
Explore tagged Tumblr posts
Visit Tumblr Blog
Explore Tumblr blogs with no restrictions, modern design and the best experience.
Last Seen Tumblr Blogs


Fun Fact
In 2020, Tumblr had 29.4 million users in the US.
Text
Bullish Marubozu: An Important Signal for Uptrend
Among candlestick patterns in market analysis, the Bullish Marubozu candlestick is a bullish indicator that is simple to understand and very effective. Unlike other candlesticks, which may show shadows or wicks, the Bullish Marubozu is unique in its simplicity—it has no shadows.
What Is the Bullish Marubozu?
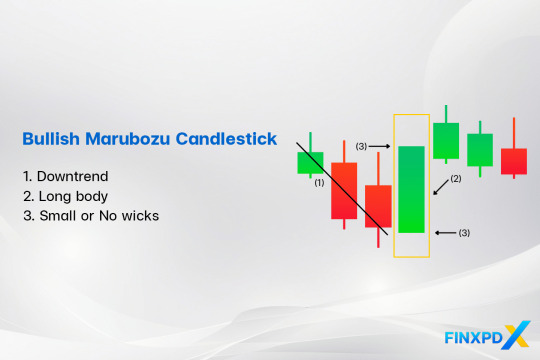
The Bullish Marubozu candlestick is a bullish candlestick pattern that shows strong buying pressure throughout the trading session. It has a long white or green body with no shadows or wicks, meaning the price opened at its lowest and closed at its highest point.
The name “White Marubozu” is another name for a Bullish Marubozu candlestick that combines its appearance and Japanese origins. “White” refers to the bullish candle color, and “Marubozu,” meaning “bald” in Japanese, describes its lack of wicks.
Characteristics of the Bullish Marubozu Candlestick
Bullish Marubozu: Features a long, solid green body with little to no wicks.
Full Bullish Marubozu: No wicks at all, showing the strongest bullish control throughout the session.
Open Bullish Marubozu: No lower wick but a small upper wick, indicating a strong upward move with slight selling pressure at the end.
Close Bullish Marubozu: A small lower wick but no upper wick, reflecting strong buying with a slightly higher open.
Read more: FinxpdX
Download PDF: 35 Powerful Candlestick Patterns
#investing#finance#investment#financial#stocks#forex#forextrading#forex market#candlestick#candlestick patterns#Marubozu#bullish#forex indicators
4 notes
·
View notes
Text
The Japanese Candlestick Charting Technique
The Japanese candlestick charting technique second edition book was written by Steve Nison. He wrote the book to understand the candlestick patterns and analyze the market.
Steve Nison structures the book from basics to advanced strategies
This Second Edition book contains:
More about intraday markets
More focus on active trading for swing, and day traders
New tactics for getting maximum use from intraday charts
New Western techniques in combination with candles
A greater focus on capital preservation.
4 notes
·
View notes
Text
Candlestick Charting: A Tale of Tradition and Innovation from Japan
Candlestick charting's rich origins in Japan reveal timeless insights into market sentiment. Embrace the past's wisdom as we navigate today's markets, confident that understanding emotions will illuminate brighter trading paths! 🚀📈 #FinancialWisdom
Candlestick charting, a vital tool for traders globally, originated in 18th-century Japan amid a feudal society and a thriving rice market. Developed by legendary trader Munehisa Homma, it visualised price movements using candlesticks, revealing market psychology and predicting trends. Steve Nison’s introduction of candlestick charting to the West in the 1980s revolutionised technical analysis.…

View On WordPress
#Bullish and Bearish Patterns#Candlestick Patterns#Feudal Japan#Financial Education#Japan#Market Psychology#Modern Trading#Price Action#Risk management#Technical Analysis
4 notes
·
View notes
Text
Candlestick Patterns: Mastering Market Moves with Accurate and Profitable Setups
In technical analysis, Candlestick Patterns are among the most powerful tools traders use to predict price movements. These patterns, originating from Japanese rice traders in the 18th century, provide visual cues about market sentiment, momentum, and potential reversals.
While there are dozens of candlestick formations, not all are equally reliable or easy to use. In this guide, we will focus on the most accurate and easy-to-understand candlestick patterns that offer strong profit potential, especially for swing traders and intraday traders.

What Are Candlestick Patterns?
A candlestick represents the price movement of an asset within a specific timeframe (e.g., 5-minute, daily, weekly). Each candlestick shows four key prices:
Open
High
Low
Close
The body (thick part) shows the range between the open and close. The wicks (or shadows) show the highs and lows. A green (or white) body shows a bullish candle, while a red (or black) one shows a bearish candle.
When grouped, Candlestick Patterns reveal momentum, reversals, or continuation of trends—making them highly valuable for timing trades.
1. Bullish Engulfing Pattern – Strong Buy Signal
Structure: A small red candle followed by a larger green candle that completely engulfs the previous day’s red candle.
Meaning: It indicates a strong reversal from bearish to bullish sentiment.
Best Used In: Downtrends or near support zones.
✅ Why It Works: It shows buyers stepping in with strong conviction, overpowering the previous day’s sellers.
2. Bearish Engulfing Pattern – Strong Sell Signal
Structure: A small green candle followed by a larger red candle that engulfs the previous green one.
Meaning: Suggests a reversal from bullish to bearish sentiment.
Best Used In: Uptrends, especially after a rally.
✅ Why It Works: It often signals that buyers are exhausted and sellers are gaining control.
3. Hammer – Bullish Reversal Pattern
Structure: Small body with a long lower wick, usually forming after a downtrend.
Meaning: Buyers rejected lower prices, showing potential for reversal.
Best Used In: Downtrends or oversold markets.
✅ Why It Works: Signals exhaustion of selling pressure and potential entry of buyers.
4. Shooting Star – Bearish Reversal Pattern
Structure: Small body with a long upper wick after an uptrend.
Meaning: Price attempted to rise but failed, indicating weakness.
Best Used In: Uptrends or near resistance.
✅ Why It Works: It highlights a failed rally, often followed by price correction.
5. Doji – Indecision, But Powerful with Confirmation
Structure: Very small body with long wicks, showing close is near the open.
Meaning: Market is undecided—watch for what happens next.
Best Used In: At the top or bottom of trends.
✅ Why It Works: Dojis often precede reversals, especially when followed by strong confirmation candles.
6. Morning Star – Bullish Reversal
Structure: A three-candle pattern: a long red candle, followed by a small body (Doji or Spinning Top), and a strong green candle.
Meaning: Shift from bearish to bullish momentum.
Best Used In: Downtrends or after corrections.
✅ Why It Works: Indicates transition from selling pressure to strong buying.
7. Evening Star – Bearish Reversal
Structure: Long green candle, followed by a small-bodied candle, then a long red candle.
Meaning: Sign of exhaustion in an uptrend, often preceding a downtrend.
Best Used In: Uptrends or after a bullish rally.
✅ Why It Works: Shows that buyers are losing steam and sellers are gaining control.
How to Maximize Profits with Candlestick Patterns
🔎 1. Combine with Support and Resistance
Candlestick patterns are more effective when they occur at key technical levels. For example, a Bullish Engulfing pattern at strong support offers a higher probability of success.
⚙️ 2. Use in Conjunction with Indicators
Pair candlestick patterns with tools like Relative Strength Index (RSI) or Moving Averages to confirm trend reversals or continuations.
⏱️ 3. Focus on Volume Confirmation
High volume on the reversal candle adds credibility to the signal. Volume confirms the participation of institutional players.
📈 4. Time Your Entry and Exit
Don’t trade on the pattern alone. Wait for confirmation candles or enter on the next candle’s break of the reversal level. Set clear stop-losses below/above the pattern for safety.
Final Thoughts
Candlestick Patterns are essential for anyone looking to understand price action and predict market behavior. When used correctly, patterns like the Bullish Engulfing, Hammer, and Morning Star can offer high-probability entry points for profitable trades.
What separates successful traders from the rest is not just identifying patterns but using them in the right context—with support, volume, and indicators backing them up. Simplicity, accuracy, and discipline are the keys to making candlestick patterns a reliable part of your trading strategy.
0 notes
Text
How to Trade the Bearish Engulfing Pattern: Complete Guide with Strategies and Examples
Candlestick patterns are powerful tools in the arsenal of a technical trader. Among the most reliable reversal patterns is the Bearish Engulfing Pattern—a strong signal that can hint at the start of a downward trend. In this guide, we’ll explain how to identify this pattern, why it works, and most importantly, how to trade it effectively with multiple strategies and examples. 📌 What is a Bearish…
#Bearish candle formation#Bearish engulfing candlestick pattern explained#Bearish Engulfing Pattern#Bearish engulfing pattern trading strategy#Bearish reversal pattern#Bearish trend confirmation#Can you trade bearish engulfing in forex?#Candlestick pattern for bearish reversal#candlestick patterns#Confirmation signals for bearish engulfing#EMA confluence with candlestick patterns#Engulfing candle trading rules#Entry and exit with candlestick patterns#Forex bearish engulfing strategy#How to confirm a bearish engulfing signal?#How to trade the bearish engulfing pattern#Is the bearish engulfing pattern reliable?#learn technical analysis#Multi-timeframe candlestick pattern strategy#Price action trading setup#Reversal Candlestick Patterns#Risk management for pattern trading#stock markets#Stock trading with bearish engulfing pattern#support and resistance levels#Swing trading with bearish engulfing#technical analysis#Trading bearish engulfing with moving averages#Trading Strategies#Using bearish engulfing with RSI
0 notes
Text
0 notes
Text
Top 8 Must-Know Chart Patterns in Technical Analysis | NTA®
Discover the 8 essential chart patterns every trader should master. Enhance your trading strategy with insights into market trends and price action analysis.
0 notes
Text
youtube
⚡ Comprendre tous les patterns de bougies japonaises en 5 minutes Vous voulez lire les marchés comme un pro ? Apprenez à interpréter les bougies japonaises, un outil essentiel en analyse technique.
📌 Dans cette vidéo, vous apprendrez : ✅ Comment intuitivement cmprendre les patterns de retournement et de continuation les plus connus ✅ Comment les repérer facilement sur vos graphiques sans les connaître ✅ Comment utiliser les time frames pour améliorer vos entrées
Une formation express pour mieux trader, dès aujourd’hui !
#stock market#indicateurs trading#bougies japonaises#signaux trading#day trading#swing trading#crypto trading#tendance haussière#tendance baissière#astuces trading#price action trading#stratégie de trading#trading efficace#retournement bourse#price action#méthode trading visuelle#chandeliers japonais#patterns trading#analyse technique#apprendre trading#signaux de bougies#bougies japonaises trading#bougie engulfing#hammer#candlestick patterns#Youtube
1 note
·
View note
Text
Unlocking the Power of TradingView: The Best Charting Platform for Traders
A sleek and modern TradingView dashboard displaying real-time charts, candlestick patterns, and powerful technical indicators like RSI and MACD. Are you looking for a powerful, easy-to-use charting tool to enhance your trading? Whether you’re a beginner or an experienced trader, TradingView is one of the best platforms for technical analysis, market insights, and strategy building. And here’s…
#Affiliate Marketing#Automated trading#Candlestick patterns#Crypto trading#Day trading#Forex trading#Investing#MACD#Market analysis#Online trading#passive income#RSI#Stock market#Swing trading#Technical analysis#Trading alerts#Trading bots#Trading platform#Trading signals#Trading strategies#Trading tools#TradingView#TradingView charts#TradingView indicators#TradingView plans#TradingView pricing#TradingView review
0 notes
Text
Unlock your full potential by delving into the world of trading without any cost. Our app is tailored to equip you with the knowledge and skills needed to navigate the complexities of the market, fostering financial independence through informed trading decisions.
Our aim is to make high-quality financial education accessible to everyone for free while ensuring both absolute beginners and trading beasts both have new knowledge to unlock.
With this candlestick patterns app you will go from a stock market noob to an expert day trader at the speed of sound using 5 powerful tools to help you learn Candlestick Patterns, Technical Analysis & Fundamental Analysis with ease.
• Expertly Written Lessons, To Help You Learn With Ease
• A Candlestick Simulator To Help You Practice
• A Profile Page To Make It Easier To Track Your Progress
• Quizzes & Tests To Help You Test Your Knowledge
• A Settings Page To Help You Customize Your Full App Experience
With these 5 POWERFUL features you could quickly and easily become a stock market expert and start making money on the stock market.
Candlestick patterns are used by professionals all the time to help them predict the markets and help them make money, So why shouldn't you use those tools as well?
Just a friendly heads-up: Trading can be a rollercoaster ride, with its ups and downs, and there's a chance you could lose some, or even all, of your capital invested. Everything you learn in the candlestick patterns app is here to enlighten and educate, not to serve as financial advice or an investment recommendation. So, enjoy the journey, but remember to buckle up!
Download ‘Learn Candlestick Patterns’ To Start Learning Now!
0 notes
Text
10 Candlestick Patterns for Effective Trading
Candlestick patterns are a powerful tool for traders to analyze price movements and predict future market behavior. Developed in Japan over 300 years ago, these patterns are widely used in modern technical analysis. This article will explore ten essential candlestick patterns that can help traders make informed decisions and enhance their trading strategies. What are Candlestick…
#Bearish Patterns#Bullish Patterns#Candlestick Patterns#Downtrend#Entry and Exit Points#Forex#Forex Traders#Forex Trading#Market Reversal#Price Movements#Risk Management#Stop-Loss#Take-Profit#Technical Analysis#Trading Psychology#Trading Strategies#Trading Strategy#Trend Direction#Trend Identification#Uptrend
1 note
·
View note
Text
Introduction to Candlestick Patterns and Hammer Candlestick Pattern for Beginners
Candlestick patterns are fundamental to technical analysis, offering traders visual insights into market sentiment and potential price movements. Among the plethora of candlestick patterns, the hammer candlestick pattern is particularly notable for its clear indication of a potential reversal. This guide is designed for beginners, providing an in-depth look at candlestick patterns and a detailed explanation of the hammer candlestick pattern.
What Are Candlestick Patterns?
Candlestick patterns are graphical representations of price movements in trading. They are composed of individual candlesticks, each representing a specific period's price action, including the open, high, low, and close prices. The body of the candlestick shows the range between the opening and closing prices, while the wicks (or shadows) display the highest and lowest prices reached during the period.
Candlestick patterns are crucial in identifying market trends and potential reversals. They are divided into single, double, and multiple-candlestick patterns, each with unique characteristics and implications.
Understanding the Hammer Candlestick Pattern
The hammer candlestick pattern is a single-candle pattern that signals a potential bullish reversal. It typically forms at the end of a downtrend, indicating that the market may start to move upwards.
Characteristics of the Hammer Candlestick Pattern
Long Lower Shadow: The lower shadow of the hammer candlestick pattern is at least twice the length of the body. This long shadow indicates that sellers initially drove the price down significantly during the trading session.
Small Real Body: The body of the hammer candlestick pattern is small and located at the upper end of the trading range. This suggests that, despite the initial selling pressure, buyers were able to push the price back up near the opening level.
Little to No Upper Shadow: The hammer candlestick pattern has little or no upper shadow, reinforcing the idea that sellers were unable to maintain the lower prices.
How to Identify the Hammer Candlestick Pattern
Identifying the hammer candlestick pattern involves recognizing its distinct characteristics within the context of a downtrend. Here’s how you can spot it:
Context: Ensure the pattern appears after a downward trend. The hammer candlestick pattern is only significant if it forms at the bottom of a downtrend.
Appearance: Look for a candlestick with a small body at the top, a long lower shadow, and little to no upper shadow.
Volume: Higher trading volume during the formation of the hammer candlestick pattern can add validity to the signal.
Trading Strategies Using the Hammer Candlestick Pattern
Incorporating the hammer candlestick pattern into your trading strategies can help you capitalize on potential bullish reversals. Here are some strategies to consider:
1. Confirmation with Next Candlestick
Wait for the next candlestick to confirm the reversal. If the following candlestick closes above the hammer’s close, it confirms the bullish reversal signaled by the hammer candlestick pattern.
2. Combining with Technical Indicators
Enhance the reliability of the hammer candlestick pattern by combining it with other technical indicators like the Relative Strength Index (RSI) or Moving Average Convergence Divergence (MACD). These indicators can help confirm the bullish reversal and provide additional entry signals.
3. Setting Stop Loss and Take Profit Levels
When trading the hammer candlestick pattern, it’s crucial to manage risk. Set a stop loss below the hammer’s low to protect against false signals. Determine take profit levels based on resistance levels or using a risk-reward ratio.
Conclusion
The hammer candlestick pattern is an essential tool for beginners in technical analysis. Its distinct characteristics and reliable signals make it a valuable addition to any trader’s toolkit. By understanding the hammer candlestick pattern and incorporating it into your trading strategies, you can enhance your ability to identify potential bullish reversals and make informed trading decisions.
0 notes
Text
Pin Bar Candlestick Pattern: A Trader’s Guide to Smart Entries and Exits
Have you ever noticed a candle on a chart that looks like a pin or a needle? That structure is known as a pin bar, and it can give traders powerful insights into future price movement. Whether you're entering or exiting a trade, the pin bar can help you make smarter, more strategic decisions.
If you've found it challenging to recognize or understand this pattern, you're not alone. In this Market Investopedia guide, we’ll walk you through everything you need to know about pin bars—how they work, their pros and cons, and how to trade them effectively.
What Is a Pin Bar?
A pin bar is a candlestick formation that signals a potential price reversal or continuation. It’s made up of:
A small body (green or red),
A long wick on one end,
And a short wick on the opposite end.
This structure reveals price rejection—meaning the market attempted to move in one direction but was strongly pushed back, hinting at an upcoming shift.
Key Features of a Pin Bar
To identify a pin bar, look for the following elements on your chart:

Small Candle Body
The body should be short, showing little difference between the opening and closing prices. This indicates a balance—or struggle—between buyers and sellers.
Wicks (Shadows)
There are two wicks on a pin bar. One is very long, and the other is short. The long wick reveals where the price was rejected, and it's the most important part of the pin bar.
Closed Candle
Never trade a pin bar that hasn’t closed yet. Wait for the candle to close before making a decision based on its signal.
Types of Pin Bars
Bullish Pin Bar
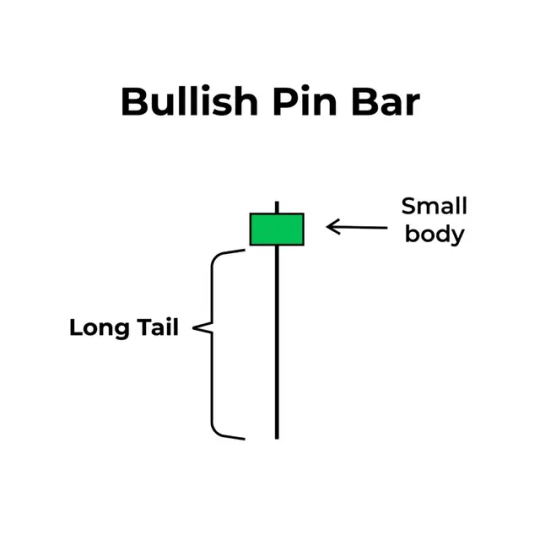
Appears during a downtrend
Has a small green body
Features a long lower wick
Signals a potential upward reversal
The long lower wick suggests sellers pushed the price down, but buyers fought back, rejecting the lower levels. This often indicates a buying opportunity.
Bearish Pin Bar
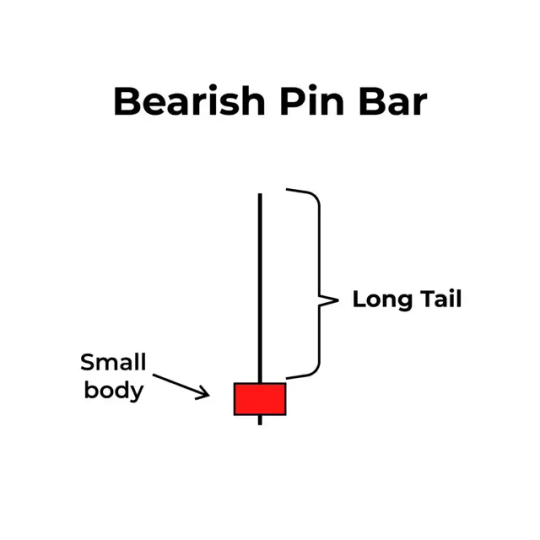
Appears during an uptrend
Has a small red body
Features a long upper wick
Signals a potential downward reversal
Here, buyers tried to push the price higher, but sellers stepped in and rejected the highs. This often signals a selling opportunity.
How to Trade Using Pin Bars

1. Identify a Pin Bar
Scan your chart (preferably 4-hour, daily, or weekly) for a small-bodied candle with a long wick on one end and a short wick on the other.
2. Use Confirmation Tools
Combine pin bars with tools like:
RSI (Relative Strength Index)
Fibonacci Retracement
Bollinger Bands These indicators can help confirm whether the signal is strong enough to act on.
3. Trade Reversals
When a pin bar forms at a key support or resistance level, it often signals a reversal. Trade in the direction opposite the long wick.
4. Trade Trend Continuations
Not every pin bar signals a reversal. In some cases, especially during a trend pause, a pin bar can indicate that the current trend is about to continue. For example, a bullish pin bar during an uptrend suggests that buyers are still in control.
How to Spot High-Quality Pin Bars
Not all pin bars are equal. Here's what to look for in a strong setup:
Key Levels: Look for pin bars forming at significant support or resistance zones.
Longer Time Frames: Pin bars on 4H, daily, or weekly charts tend to be more reliable than those on 5-minute or 15-minute charts.
Wick Length: The longer the wick (at least two-thirds of the candle's length), the stronger the signal.
Smaller Body: A smaller body means less indecision and more rejection.
Volume Confirmation: Higher trading volume strengthens the validity of the pattern.
Pros of Trading Pin Bars
Easy to recognize, even for beginners
Work well with various assets—Forex, stocks, crypto, commodities Clearly define potential entry and exit levels
Combine well with trendlines, moving averages, and other tools Suitable for multiple timeframes
Cons of Trading Pin Bars
Less effective in choppy or sideways markets
Relies on probabilities—there’s no guarantee the signal will play out
Can produce false signals without proper confirmation
Final Thoughts
The pin bar candlestick is a powerful yet simple tool that traders can use to spot trend reversals or continuations. It's easy to learn, and when combined with other forms of analysis, it can provide high-probability trade setups.
However, like any trading method, pin bars are not foolproof. It's important to assess each one carefully, confirm the signal, and avoid trading them in low-quality setups or during erratic market conditions.
Ready to dive deeper into price action and trading strategies? Explore more articles on Market Investopedia or join our free webinar for hands-on learning with real chart examples.
0 notes
Text
Candlestick Patterns
Master candlestick patterns with FuturesElite to improve your trading strategies. Learn to identify key signals for better market analysis and decision-making. Enhance your trading skills and maximize profits with expert insights today!
0 notes
Text
Binance Exclusive: Start Trading with $100 for Free!

Take your first steps into the exciting realm of cryptocurrency trading with Binance! Sign up now and receive a complimentary $100 to kickstart your trading journey. Explore a diverse selection of cryptocurrencies, hone your trading skills, and potentially turn that initial $100 into something more. Don't miss this exclusive offer – seize the opportunity to trade on Binance with free funds! #binance #cryptotrading #freemoney Link Below : https://bit.ly/BinanceFree100
#Cryptocurrency#Forex#Stocks#Day Trading#Swing Trading#Technical Analysis#Fundamental Analysis#Trading Strategies#Risk Management#Options Trading#Futures Trading#Bull Market#Bear Market#Market Trends#Stop-Loss#Take Profit#Margin Trading#Leverage#Candlestick Patterns#Market Volatility
0 notes
Text
Unveiling the Magic of Shooting Star Candlestick Pattern
Title: Unveiling the Magic of Shooting Star Candlestick Pattern: A Step-by-Step Guide Introduction:Candlestick patterns are essential tools for technical analysts in the world of trading. Among the myriad patterns, the Shooting Star stands out as a powerful indicator of potential trend reversals. In this blog post, we will delve into the nuances of the Shooting Star candlestick pattern,…

View On WordPress
#candlestick#candlestick chart#candlestick patterns#candlestick trading#candlestick trading patterns#candlestick trading setup#candlestick trading strategies#candlesticks#candlesticks pattern#elemer of the briar#forex trading against the trend#history of the elder scrolls#japanese candlesticks#making of the elder scrolls#swing trading guide#swing trading patterns#technical analysis chart patterns#the elder scrolls: arena - a complete retrospective
1 note
·
View note