#backtest
Explore tagged Tumblr posts
Visit Tumblr Blog
Explore Tumblr blogs with no restrictions, modern design and the best experience.
Last Seen Tumblr Blogs


Fun Fact
Kazakhstan’s Minister of Communications and Informatics has blocked the Tumblr site because it contained 60 sites of terrorism, extremism, and pornography in 2015.
Text
nifty and bank nifty movers 23 jan 2024


#nifty50#nifty prediction#nifty fifty#bank nifty#nifty today#niftytrading#nifty index#backtesting#backtestmojo#Backtest#free Backtest
1 note
·
View note
Text

Free Backtesting
#freebackktesting#backtest#backtesting#freebacktest#niftybacktesting#optionbacktesting#freeoptionbackteting#bankniftybacktesting
1 note
·
View note
Text
Bullish Backtest -- Update
On Tuesday we discussed how stocks retraced to backtest their breakout from the election. We watching for a swing low and close back above the 10 day MA. Which is what happened. Stocks are currently in a daily uptrend. Closing back above the 10 day MA indicates a continuation of their daily uptrend and signals a cycle band buy signal. A break above the day 5 high of 6017.31 will assure us of…

View On WordPress
0 notes
Text
NRX INDICATOR AND OPTIMIZATION
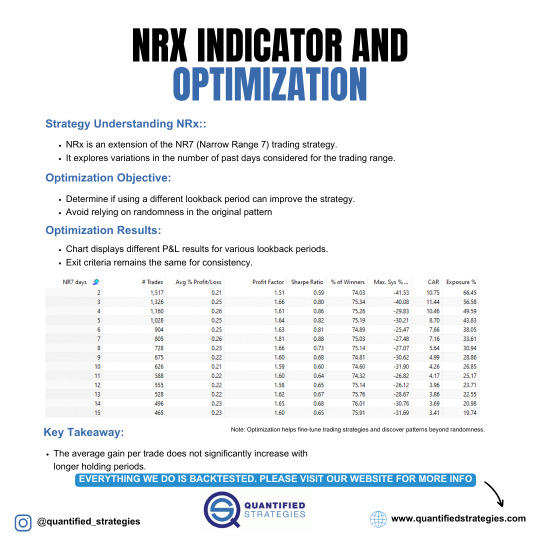
The NRX Indicator extends the NR7 trading strategy by varying the lookback period for identifying narrow range days. The goal of optimization is to determine if altering the lookback period improves performance while avoiding randomness. Results show minimal improvement in the average profit with longer lookback periods, indicating diminishing returns. The strategy maintains consistent exit criteria, with higher profit factors and Sharpe ratios around the 3-7 day range.
#TradingStrategy#NR7#NRXIndicator#Optimization#Backtest#TradingPerformance#SharpeRatio#ProfitFactor#MarketAnalysis
1 note
·
View note
Text
NDIV11: O Primeiro ETF Brasileiro que Paga Dividendos Mensais
Recentemente, foi lançado o NDIV11, o primeiro ETF brasileiro que distribui dividendos mensalmente. Essa novidade chamou a atenção dos investidores, e neste artigo, vamos analisar os principais aspectos desse ETF e avaliar se vale a pena incluí-lo em sua carteira de investimentos. O que é o NDIV11? O NDIV11 é um ETF (Exchange-Traded Fund) que busca replicar o desempenho do índice Bovespa Smart…

View On WordPress
#backtest#bitributação#Bovespa Smart Dividendos#carteira de investimentos#consultor financeiro#desempenho passado#dividendos#dividendos mensais#ETF brasileiro#imposto de renda#investimento direto em ações#investimentos#NDIV11#Nubank#renda regular#taxa de administração#tributação
0 notes
Text
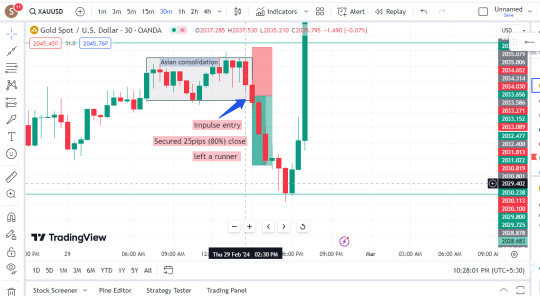
Gold! Remember to backtest and journal your trades. Simplify your charts for clearer opportunities. Keep it straightforward, folks! Clean charts enhance opportunity visibility.
2 notes
·
View notes
Text
🚀Project Title: Real-Time Cryptocurrency Price Action Modeling and Algorithmic Trading Strategy Backtesting Engine. ⚽
ai-ml-ds-finance-crypto-trading-backtesting-022 Filename: crypto_trading_backtester.py Timestamp: Mon Jun 02 2025 19:45:14 GMT+0000 (Coordinated Universal Time) Problem Domain:Algorithmic Trading, Quantitative Finance, Cryptocurrency Markets, Time Series Analysis, Financial Engineering, Risk Management, High-Frequency Data Analysis. Project Description:This project develops a comprehensive…
#AlgorithmicTrading#Backtesting#CCXT#CryptoTrading#DeFi#NumPy#pandas#python#QuantitativeFinance#TechnicalAnalysis#TradingBot
0 notes
Text
Bullish Backtest
Stocks rallied in response to the election. After hitting resistance stocks retraced to backtest their breakout from the election. Stocks are currently in a daily uptrend. If stocks form a swing low and close back above the 10 day MA that will indicate a continuation of their daily uptrend and signal a cycle band buy signal.

View On WordPress
0 notes
Text
JUNK BOND TREND-FOLLOWING BACKTEST

The trend-following backtest analysis for junk bonds revealed that such strategies tend to perform better than those for stocks. A highlighted strategy demonstrated a compound annual growth rate (CAGR) of 9.6% while being invested 73% of the time, outperforming a buy-and-hold approach. The analysis also noted the positive impact of lower interest rates on junk bonds, but cautioned about potential changes as rates rise.
0 notes
Text
youtube
🔧 Comment utiliser vos indicateurs perso en backtest ProRealTime
Vous avez développé vos propres indicateurs sur ProRealTime ? Parfait. Mais les avez-vous testés dans de vraies conditions historiques avant de les utiliser en live ? Dans cette vidéo, découvrez comment intégrer et tester vos indicateurs personnalisés dans le moteur de backtest de ProRealTime, pour valider vos stratégies avant de les mettre en pratique.
📌 Dans cette vidéo, vous apprendrez : ✅ Comment insérer vos indicateurs perso dans une stratégie Prorealtime ✅ Comment écrire un code simple pour déclencher un backtest ✅ Comment utiliser des indicateurs importés dans une backtest
#stock market#ProRealTime#backtest ProRealTime#indicateur personnel ProRealTime#stratégie ProRealTime#indicateur trading#tester ses indicateurs#ProRealTime tutoriel#backtest trading#indicateur personnalisé#trading algorithmique#ProRealCode#coder stratégie trading#valider stratégie trading#stratégie automatique#comment backtester#tutoriel PRT#optimiser stratégie trading#créer indicateur trading#ProRealTime code#apprendre ProRealTime#Youtube
0 notes
Text
https://www.storeboard.com/sachinjoshi1/images/how-to-customise-algorithmic-trading-software-to-suit-your-trading-style/1136694

Algorithmic trading, or algo-trading, has revolutionised the financial markets. It involves using computer programs to execute trading strategies automatically based on predefined rules and parameters.
#Algorithmic Trading Software#Customise Algorithmic Trading Software#pre-built algorithmic trading#robust backtesting
0 notes
Text
4/9-Weekly EMA Crossover Strategy
I recently came across a reddit post from some random guy in Brazil. He mentioned the 4/9 EMA cross was pretty successfull so I wanted to try it.
Period = Weekly Initial Size = $1000 Stop Loss = -$50 Opening Condition = 4 period EMA > 9 period EMA Closing Conditions = Close < 20EMA

0 notes