#backtest trading
Explore tagged Tumblr posts
Visit Tumblr Blog
Explore Tumblr blogs with no restrictions, modern design and the best experience.
Last Seen Tumblr Blogs


Fun Fact
In 2020, Tumblr had 29.4 million users in the US.
Text
youtube
🔧 Comment utiliser vos indicateurs perso en backtest ProRealTime
Vous avez développé vos propres indicateurs sur ProRealTime ? Parfait. Mais les avez-vous testés dans de vraies conditions historiques avant de les utiliser en live ? Dans cette vidéo, découvrez comment intégrer et tester vos indicateurs personnalisés dans le moteur de backtest de ProRealTime, pour valider vos stratégies avant de les mettre en pratique.
📌 Dans cette vidéo, vous apprendrez : ✅ Comment insérer vos indicateurs perso dans une stratégie Prorealtime ✅ Comment écrire un code simple pour déclencher un backtest ✅ Comment utiliser des indicateurs importés dans une backtest
#stock market#ProRealTime#backtest ProRealTime#indicateur personnel ProRealTime#stratégie ProRealTime#indicateur trading#tester ses indicateurs#ProRealTime tutoriel#backtest trading#indicateur personnalisé#trading algorithmique#ProRealCode#coder stratégie trading#valider stratégie trading#stratégie automatique#comment backtester#tutoriel PRT#optimiser stratégie trading#créer indicateur trading#ProRealTime code#apprendre ProRealTime#Youtube
0 notes
Text
https://www.storeboard.com/sachinjoshi1/images/how-to-customise-algorithmic-trading-software-to-suit-your-trading-style/1136694

Algorithmic trading, or algo-trading, has revolutionised the financial markets. It involves using computer programs to execute trading strategies automatically based on predefined rules and parameters.
#Algorithmic Trading Software#Customise Algorithmic Trading Software#pre-built algorithmic trading#robust backtesting
0 notes
Text
4/9-Weekly EMA Crossover Strategy
I recently came across a reddit post from some random guy in Brazil. He mentioned the 4/9 EMA cross was pretty successfull so I wanted to try it.
Period = Weekly Initial Size = $1000 Stop Loss = -$50 Opening Condition = 4 period EMA > 9 period EMA Closing Conditions = Close < 20EMA

0 notes
Text
Smart Money Trading Indicator on TradingView: A Comprehensive Guide

In the world of trading, the quest for actionable insights and reliable tools is never-ending. TradingView has emerged as a leading platform for chart analysis and trading strategies. Among its myriad features and tools, smart money trading indicators stand out as a powerful resource for both novice and professional traders. This article dives deep into the concept of smart money trading, the indicators available on TradingView, and how to effectively leverage them for optimal results.
What is Smart Money Trading?
Smart money trading is a strategy that tracks the moves of institutional investors, often referred to as the “smart money.” These large players, such as hedge funds, banks, and professional traders, have the resources and knowledge to influence market movements significantly. By observing their trading patterns, retail traders can align their strategies with the market’s broader trends, increasing their chances of success.
Smart money trading indicators are designed to help traders identify key market dynamics, such as:
Liquidity zones: Areas where institutional traders are likely to enter or exit positions.
Volume spikes: Indications of significant market activity driven by large players.
Price imbalances: Insights into market inefficiencies where opportunities may lie.
Key support and resistance levels: Zones of high activity and potential reversals.
Popular Smart Money Trading Indicators on TradingView
TradingView offers a variety of indicators that cater to smart money trading strategies. These indicators are highly customizable, user-friendly, and come with detailed documentation. Here are a few noteworthy options:
Order Block Indicators: Highlight areas of institutional buying or selling, giving traders insights into potential future price movements.
Volume Profile Tools: Analyze trading activity at different price levels, revealing strong support and resistance areas.
Liquidity Sweep Alerts: Detect stop-hunt zones where smart money clears liquidity before a major price move.
Market Structure Tools: Identify breakouts, consolidations, and reversals in real-time.
MiyagiTrading: Revolutionizing Smart Money Indicators
MiyagiTrading is a trusted name in the TradingView community, offering cutting-edge best paid TradingView indicators designed to simplify and enhance your trading journey. Their suite of indicators combines precision, reliability, and ease of use, making them an excellent choice for traders of all levels.
Miyagi 10in1 Alerts & Backtest
A comprehensive tool that integrates ten powerful indicators into one. This all-in-one package allows traders to:
Generate real-time alerts for various trading conditions.
Backtest strategies with historical data to optimize performance.
Save time and boost accuracy with its user-friendly interface.
Miyagi 6in1 Alerts & Backtest
This versatile tool is tailored for traders seeking flexibility and efficiency. Key features include:
Six essential indicators in a single package.
Customizable alerts for quick decision-making.
A robust backtesting engine to validate strategies.
Miyagi 4in1 Alerts & Backtest
Perfect for traders who prefer simplicity without compromising effectiveness. Highlights include:
Four indispensable indicators for market analysis.
Alerts and backtesting capabilities for streamlined trading.
Miyagi PSAR & STrend
Designed for trend traders, this indicator excels in identifying market trends and momentum shifts. Features include:
A refined Parabolic SAR (PSAR) with added functionalities.
STrend analysis for detecting trend strength and direction.
Miyagi Backtester
A standalone backtesting tool that empowers traders to test any strategy thoroughly. Its advanced analytics ensure that you have complete confidence in your trading plan.
Why Choose MiyagiTrading Indicators?
User-Friendly: Intuitive design ensures a seamless experience for traders of all skill levels.
Customizable: Tailor the settings to match your unique trading style.
Proven Accuracy: Trusted by thousands of traders for their precision and reliability.
Comprehensive Support: Access detailed guides, tutorials, and responsive customer support.
Get Started with MiyagiTrading Today!
Take your trading game to the next level with MiyagiTrading’s premium indicators on TradingView. Whether you’re a beginner or a seasoned trader, these tools provide the edge you need to succeed in today’s dynamic markets.
Explore their offerings and gain access to the best-paid indicators for TradingView:
Miyagi 10in1 Alerts & Backtest
Miyagi 6in1 Alerts & Backtest
Miyagi 4in1 Alerts & Backtest
Miyagi PSAR & STrend
Miyagi Backtester
Don’t miss the opportunity to revolutionize your trading experience. Visit MiyagiTrading and start your journey to smarter, more informed trading today!
0 notes
Text
In the fast-paced world of trading, the integration of REST APIs with trading algorithms has become an essential tool for traders looking to enhance their strategies. REST APIs, or Representational State Transfer Application Programming Interfaces, allow seamless communication between different software applications. When integrated with trading algorithms, REST APIs enable traders to automate processes, access real-time data, and execute trades more efficiently.
#integrated with trading algorithms#API trading#trading algorithms#backtest your trading algorithm#trading platform
0 notes
Link
🚀 Ready to elevate your trading game? Learn how to backtest your strategies with Coinrule and optimize your performance like a pro! 🏆📈 Check out our latest guide and see how you can transform your portfolio into a success story. 💹✨
🔍 Dive into real-world case studies, expert tips, and actionable insights to make your trading strategies work for you. Start mastering your trades today! 🚀🔧
#crypto trading#trading strategies#backtesting#crypto investment#trading tips#financial freedom#blockchain#trading success#invest smart#crypto market#trading tools
0 notes
Video
youtube
Live Data Collection/Refinement (200%+ Backtest) - Part 1
#youtube#EliteTradingNetwork trading crypto trader forex investing bitcoin cryptocurrency stockmarket backtest daytrader livedata
0 notes
Text
Automated Forex Trading: Benefits and Risks of Using Trading Robots
Automated forex trading has revolutionized the way traders engage with the forex market. By utilizing trading robots, also known as expert advisors (EAs), traders can execute trades automatically based on pre-defined criteria. While automated forex trading offers numerous benefits, it also comes with inherent risks. This article explores the advantages and disadvantages of using trading robots…

View On WordPress
#Automated Forex Trading#Backtesting#Expert Advisors#Forex Diversification#Forex Indicators#Forex Market#Forex Security#Forex Trading#Forex Trading Plan#Market Analysis#Market Efficiency#Risk Management#Technical Analysis#Trading Automation#Trading Costs#Trading Performance#Trading Robots#Trading Strategies#Trading Technology
0 notes
Text

#backtesting#nifty#nifty50#banknifty#option trading tips#option trading strategy#option backtesting#options#nifty today
1 note
·
View note
Text
With the modern world being much more reliant on technology, the financial market is not identical to other markets. Trading has, thus, also transformed thanks to the emergence of algorithmic trading systems which enable traders to make immediate trades based on technical indicators without manual execution.
0 notes
Text
Weekly RSI Ascending/Descending (pt2)
Using daily candles for better precision. A continuation of https://www.tumblr.com/patrickbatoon/772173459217383424/weekly-rsi-ascendingdescending?source=share
---
The Weekly RSI trend strategy was incredibly promising, so I wanted to take this further with more granular data. For this exploration I ended up using Daily candle data of the Russell1000 with the same timeframe of 01-JAN-2020 to 01-JAN-2025
The core strategy remains the same:
Entry: 3 consecutive increases in weekly RSI(14) using RSI-smoothed(14). For daily candles this can be computed using RSI(70) and RSI-smoothed(70).
Exit: Close < EMA20: If the close of the stock crosses below the 20-day EMA, fully exit the position.
I ended up removing the 50-week EMA filter since I found it excludes key reversals.
Broad market entry conditions as filters:
$VIX - week over week decrease. The VIX measures expected 1-year volatility as a percentage. Increases in this measure is driven by Put/Call options pricing, however its primarily associated with Put buying for downside protection
$RSP - Closeempirically found that this acts as a filter for potential key reversals and breakouts
Results:
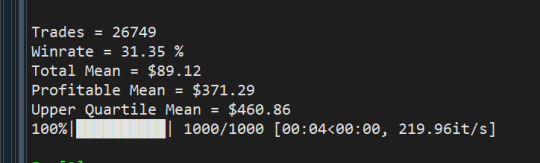
From 01-JAN-2020 to 01-JAN-2025 it appears that the winrate is much lower than the weekly backtests suggested, but it ends up catching more false signals on the day-to-day.
Trades = 6420 Winrate = 35.72 % Total Mean = $39.84 Profitable Mean = $194.94 Upper Quartile Mean = $266.74
From 01-JAN-2020 to 01-JAN-2025
Trades = 19168 Winrate = 38.62 % Total Mean = $40.43 Profitable Mean = $177.11 Upper Quartile Mean = $257.12
---
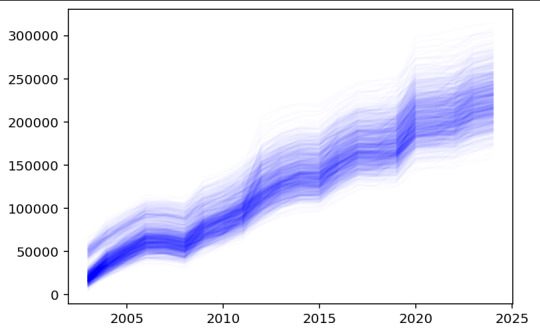
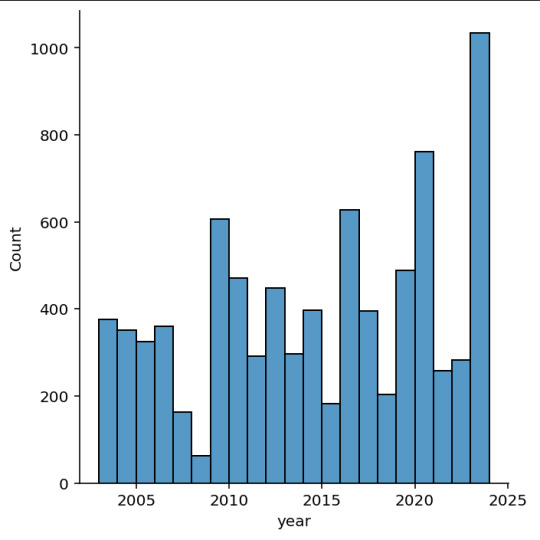
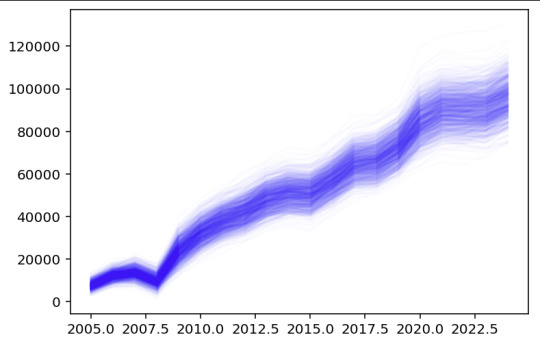
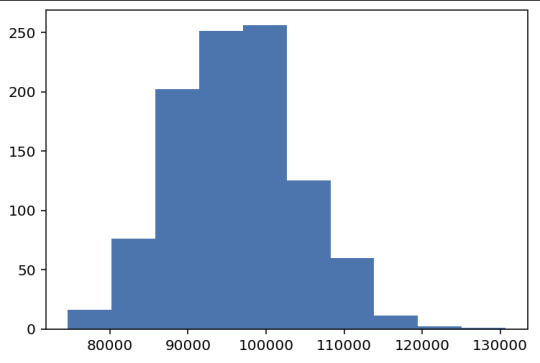
Lastly, with the vast number of trades included in the backtest, I wanted to simulate the universe of possible outcomes through a Monte Carlo simulation. This was done by sampling 120 trades per year (10 trades per month) and determining the portfolio growth.
0 notes
Text
Traders Family Komunitas Trading Terbaik di Jogja

View On WordPress
#account traders family#apa itu traders family#apakah traders family aman#apk traders family#aplikasi traders family#astronacci vs traders family#backtest traders family#broker traders family#calculator traders family#cara daftar traders family#cara kerja traders family#cara menggunakan traders family#cara trading di traders family#cashback traders family#family trading account#family trading and projects#family trading cards#family trading company#mrg traders family#pengalaman kerja di traders family#pt traders family international#sasi traders family#trader family bonus#traders family#traders family adalah#traders family affiliate#traders family apk#traders family bappebti#traders family broker#traders family calculator
0 notes
Text
Binary Option Ultimate Backtester-V.1
The Binary Option strategy backtester gives the user extensive power to test any kind of strategy with advance trade management rules. The strategy tester accepts external scripts as strategy sources. You can add your strategy and test it for historical stats. Few assumption regarding strategy tester:
We are opening position at next candle after signal come
We are taking the position at opening price
Our call will be profitable if we get a green candle and put will be profitable if we get a red candle
We can open only one trade at a time. So if we are in trade, subsequent signals will be ignored.
How to make your strategy code compatible for strategy backtesting? In your strategy code file add following lines: Signal = is_call ? 1 : is_put ? -1 : 0 plot(Signal, title="🔌Connector🔌", display = display.none) Is_call and is_put is your buy and sell signal. Plot the signal without displaying it in the chart. The new TradingView feature display = display.none, will not display the plot.
All Input options Group: STRATEGY Add Your Binary Strategy: External strategy to back test. Trade Call/Put: Select CALL, to trade Call, PUT, to trade Put. Default is BOTH, Trading Call and Put both. Number of Candles to Hold: How many candles to hold per trade. Default 1. If you want to hold the option for 30 minutes and you are testing your strategy in 15m intervals, use 2 candle holding periods.
GROUP: MARTINGALE Martingale Level: Select up to 15 Martingale. Select 1 for no Martingale. Use Martingale At Strategy Level: Instead of using Martingale per trade basis, using Martingale per signal basis. Like if we make a loss in the first signal, instead of starting martingale immediately we’ll wait for the next signal to put the martingale amount. For example if you start with $1 and you lose, at the next signal you will invest $2 to recover your losses. Strategy Martingale Level: Select up to 15 Martingale at strategy signal level. Only workable if Use Martingale At Strategy Level is selected. Type of Trade: Martingale trade type. Only workable if we are using Martingale Level more than 1. It can be: “SAME”:If you are trading CALL and incur a loss, you are taking CALL in subsequent Martingale levels. “OPSITE”: if you are trading CALL and incur a loss, you are taking PUT in subsequent Martingale levels. “FOLLOW CANDLE COLOR”: You are following candle color in Martingale levels, i.e if the loss candle is RED, you are taking PUT in subsequent candles. “OPPOSITE CANDLE COLOR”: You are taking opposite candle color trade, i.e if the loss candle is RED, you are taking CALL in subsequent candle.
GROUP: TRADE MANAGEMENT Initial Investment Per Option: Initial investment amount per trade Payout: Per trade payout in percentage Use Specific Session: Select to test trade on specific session. Trading Session: Select trading session. Only workable if Use Specific Session is selected. Use Date Range: Select to use test trades between dates. Start Time: Select Start Time. Only workable if Use Date Range is selected. End Time: Select end Time. Only workable if Use Date Range is selected. Early Quit: Select to quit trade for the day after consecutive win or loss Quit Trading after Consecutive Win: Number of consecutive wins. Only workable if early Early Quit is selected. Quit Trading after Consecutive Loss: Number of consecutive losses. Only workable if early Early Quit is selected. Buy/Sell Flip: Use buy signal for sell and sell signal for buy.
GROUP:STATS Show Recent Stats: Show win trades in last 3,5,10,15,25 and 30 trades. Show Daily Stats: Day wise win trades and total trades. Show Monthly Stats: Month wise win trades and total trades.
Result and stat output:
Back tester without any strategy.
Strategy added with default option.
Stats with 7 Martingales. You can test up to 15.
Optional Stats:
#binary options#forex#options#statistics#binaryoptionstrategies#backtesting#binary-options-trading-strategy
0 notes
Text
Trading Strategies with Funded Traders Global
This blog explores various trading strategies and provides valuable insights into market analysis, risk management, and developing a successful trading strategy. It covers the three pillars of market analysis: fundamental analysis, technical analysis, and sentiment analysis, and emphasizes the resources and tools offered by Funded Traders Global to enhance traders' market analysis skills. The blog also delves into long-term and short-term trading strategies, including buy and hold, trend following, value investing, day trading, swing trading, and scalping. Additionally, it highlights the importance of risk management in safeguarding capital and explores risk awareness, position sizing, stop-loss orders, and risk-reward ratios. The blog concludes with discussions on developing a trading strategy, backtesting, forward testing, and advanced trading strategies like options, algorithmic, and event-driven trading. Throughout the blog, Funded Traders Global is presented as a trusted partner providing educational materials, expert insights, and cutting-edge tools to support traders in their journey toward success in the financial markets.
#Trading strategies#market analysis#fundamental analysis#technical analysis#sentiment analysis#long-term trading#buy and hold#trend following#value investing#short-term trading#day trading#swing trading#scalping#risk management#risk awareness#position sizing#stop-loss orders#risk-reward ratios#developing a trading strategy#backtesting#forward testing#advanced trading strategies#options trading#algorithmic trading#event-driven trading#Funded Traders Global.#ftg#trading potential#financial markets
0 notes
Text
Algorithmic Trading Consulting Services
We can backtest and optimize your trading strategies against historical data.
We can also automate your trading strategies by writing C++/python code to interact directly with the exchange
Do you have an idea for a trading strategy, but want to prove that it will work through backtesting against historical data? Or do you have a successful trading strategy but want to optimize the parameters of the strategy to maximise returns?
Or perhaps you’ve heard about machine learning and would like to find out how you could incorporate it into your trading. Machine learning can be used to trawl through large amounts of data looking for statistically significant signals to use in your trading. It can also be used to determine the optimal way to combine a number of possible signals or ideas into a single algorithm.
We provide cloud-based PhD quant support for traders. We offer trading algorithm development services for equity and FX markets on all major exchanges. We also offer bitcoin and cryptocurrency algorithmic trading services on major exchanges like Binance and Bitmex.
In fact, we offer a wide range of quant (quantitative finance) consulting services including algo trading, derivative pricing and risk modelling. We also offer more general mathematical and algorithmic consulting services.
Find out more about or algo trading and quant consulting services
#algo trading consulting#algorithm consulting#quant consulting#backtesting consulting#algorithmic trading consulting#trading strategy consulting
0 notes
Text
Why "One Size Fits All" Fails in Technical Analysis: The Case for Tailored Trading Strategies
Technical analysis is one of the most popular approaches to trading in financial markets, used by traders to analyze price movements and make informed decisions. While its principles are widely applicable, assuming that a single strategy can work for everyone is a recipe for disappointment. The reason is simple: trading strategies need to align with an individual’s specific trading style, risk…
#Backtesting#Crypto Trading#Custom Trading Plans#day trading#forex trading#learn technical analysis#Market Analysis#Risk Management#stock market#stock markets#stock trading#successful trading#swing trading#Tailored Trading#technical analysis#Trading Indicators#Trading Psychology#Trading Strategies#Volatility Strategies
0 notes