#data visualiztion
Explore tagged Tumblr posts
Visit Tumblr Blog
Explore Tumblr blogs with no restrictions, modern design and the best experience.
Last Seen Tumblr Blogs


Fun Fact
In 2020, Tumblr had 29.4 million users in the US.
Text
i fuckign love biostats i jop when so happy talking to my professor 😊😊🤗🤯
#never thought i would like this class but like WOAH MATH IN RELATION TO SCIENCE. SO COOL. SO COOL. SO COOL. SO C#and my profs so epic hes like somebody who actually gives a shit abt teaching (MIND BLOWN)(NOT CLICKBAIT)(ONE IN A MILLION SCORE)#talkin to him abt math behind data visualiztions n diff ways to do jt and its like . I HUNGER FOR MORE KNOWLDGE. FIGURES AND COLORS SO COOL.#.#AUTISMNATIONSTRONG💪
2 notes
·
View notes
Photo

Mapping the World’s Supply Chains. Leonardo Bonanni, Founder and CEO of Sourcemap, Talks About a Newer, Better Way of Doing Business
https://www.fronetics.com/mappingtheworldssupplychains/
0 notes
Text


Image 1- Data Visualiztion (Ted Talk):
The infographic/data visulization that I included camr from Statista and is about Ted Talks. It is titled “The Most Popular Ted Talks of All Time”. I think this graph has an underlying agenda because under the title it specifies that it is according the most viewed on youtube. This makes me think that it is not including the actual most popular Ted Talks which would be viewed on many different platforms. I think besides highlighting popular Ted Talks, this graphic is also trying to get more views on youtube, for these already highly viewed videos.
Image 2- Identity System (CeraVe):
This CeraVe container has a label which is consistently used in their brand. Although it may not always be the same color or size there is always the diagonal color block on the label which includes the “Ve” while the rest remains white and includes the “Cera”. The color block which in this case is a teal color, is also used for the name of the product as well as the cap on the top of the bottle. There are multiple colors which CeraVe uses which makes the products seems different and distinguishable for certain uses. The typeface for the “CeraVe” word on the product is always the same (san-serif and which helps identify their brand. The unique colors which the brand uses on different products as well as the distinct color blocking on the logo helps the brand achieves consistency and become recognizable to shoppers and buyers
0 notes
Text
Udemy Paid Courses with Certificates for Free II – 22/05/2021
Limited Time Offers(24Hrs Max.) Links directly to course pages with coupons applied. See first list here. 1. Learn cPanel 2. Learn Fonts Awesome 3. Google Data Studio for Data Visualiztion and Dashboards 4. Build Android Widgets from Scratch 5. Create Marketing Video for Business or Products 6. Logo Design Essentials 7. Mock Tests on GST(Goods and Services Tax) 8. Time Management and…

View On WordPress
#Continuous Learning#coupon#course#free certificates#Free Udemy#Freemium Courses#Frontend#IT Skills#learning#paid udemy courses for free#Software Development#Udemy#udemy free#Web Development
0 notes
Text
WEEK4
code: #visualiztion seaborn.displot(data["PPINCIMP"].dropna(),kde="False") plt.xlabel("Categories") plt.title("Household Income ") print(data["W1_A1"].describe()) print("XXXXx") print(data["PPETHM"].describe()) print("XXXXx") print(data["PPINCIMP"].describe()) print("XXXXx")
seaborn.catplot(x="W1_A1",y="PPETHM",data=data,kind="bar",ci=None) seaborn.catplot(x="W1_A1",y="PPINCIMP",data=data,kind="bar",ci=None)
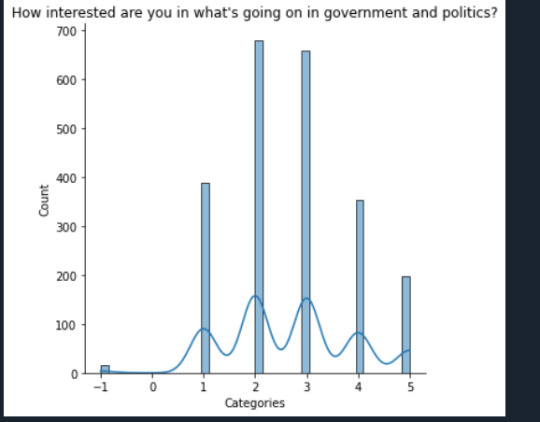
count 2294.000000 mean 2.663906 std 1.213723 min -1.000000 25% 2.000000 50% 3.000000 75% 3.000000 max 5.000000
The majority of people (2) are very interested in politics
----
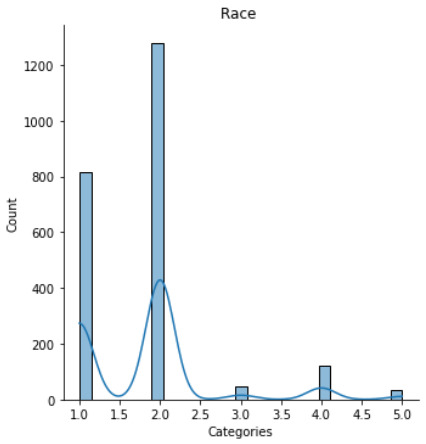
count 2294.000000 mean 1.815606 std 0.827725 min 1.000000 25% 1.000000 50% 2.000000 75% 2.000000 max 5.000000
Black people are the most
----
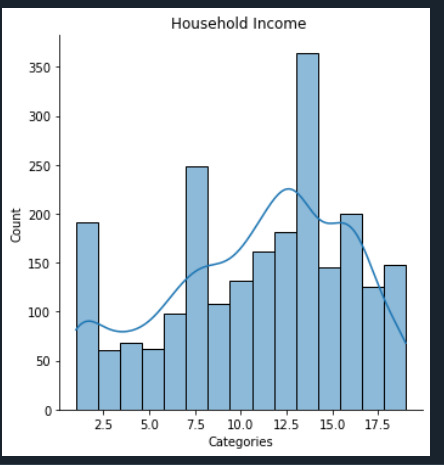
count 2294.000000 mean 10.831299 std 4.938952 min 1.000000 25% 7.000000 50% 12.000000 75% 15.000000 max 19.000000
People with incomes ($ 60,000 to $ 74,999) are the most
----

from the graph the black ppl(5) more Interest in politics than other race
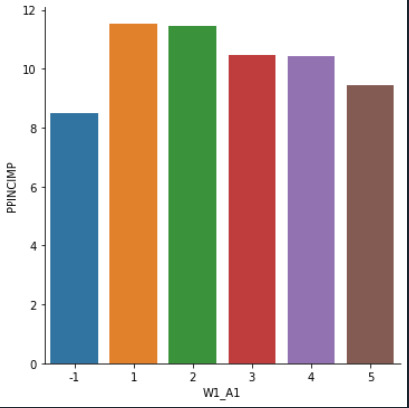
from the graph ppl with more income more Interest in politics than low income ppl
0 notes
Text
[Sharing] Những khóa học ngắn hạn dành cho sinh viên Kinh tế
Mùa hè cũng là mùa của rất nhiều khóa học ngắn hạn dành cho sinh viên. Xuất phát từ mong muốn thực tế của bản thân, rằng "giá có ai đó nói với mình những điều này sớm hơn", mình chia sẻ với các bạn một số khóa học hữu ích dành cho sinh viên Kinh tế và có định hướng nghiên cứu. Mặc dù hầu hết các khóa học ở đây không giới hạn độ tuổi tham dự, nhưng mình nghĩ sinh viên sẽ là đối tượng phù hợp nhất - có nhiều thời gian và đang cần tìm định hướng cho tương lai. Mình sẽ sắp xếp các khóa học theo mức độ "hardcore" tăng dần, tức là tăng dần cả về kiến thức chuyên môn và học phí. Nếu các bạn biết khóa học nào hay ho nữa thì chia sẻ thêm nhé :)
1. Vietnam Summer School of Science (VSSS)
- Thành lập bởi một nhóm các nhà nghiên cứu trẻ (giới thiệu là vậy nhưng mình thấy toàn là những người gạo cội trong ngành), hoạt động theo hình thức phi lợi nhuận và xin tài trợ.
- Địa điểm học: Quy Nhơn, Bình Định
- Số lượng học viên: khoảng 150 - 180 (số lượng người đăng ký tăng dần qua mỗi năm theo cấp số nhân @@)
- Thời gian học: 3 - 4 ngày, thường vào tháng 7 hàng năm
- Phí: được bao toàn bộ chỗ ở, học phí, ăn uống. Chi phí đi lại sẽ được trao cho 1 số học viên (năm 2019 số người được hỗ trợ là 70/180).
- Nội dung học: Trường hè không dạy kiến thức về ngành khoa học nào cụ thể. Mục đích chính của trường hè là lan tỏa tinh thần khoa học, hay cụ thể hơn là dạy về đạo đức trong nghiên cứu, những kỹ năng cơ bản trong nghiên cứu và viết CV xin học bổng. Các bạn có thể tham khảo về nội dung của trường hè (năm 2017) của mình tại đây (ghi chú thêm là nội dung học mỗi năm không hoàn toàn giống nhau).
- Giảng viên: các giảng viên trường hè đến từ nhiều ngành khoa học khác nhau, nhưng như năm 2017 mình học thì khoa học tự nhiên chiếm phần lớn nhất, chỉ có duy nhất 1 giảng viên về kinh tế (cũng là sếp của mình ahihi). Ngoài ra còn có phần do các anh chị cựu học viên đã đi du học chia sẻ về kinh nghiệm viết CV, xin học bổng.
- Bình luận cá nhân:
Theo mình biết thì tiêu chí chọn học viên của VSSS thường là dựa trên sự đam mêm với nghiên cứu khoa học, được thể hiện qua bài luận, còn thành tích cá nhân là yếu tố xếp sau (lý do mình sẽ nói sau).
Nội dung của trường hè không nhắm vào dạy kiến thức chuyên môn nên các bạn không nên kỳ vọng nhiều, mà chủ yếu nên tận dụng cơ hội để mở rộng mối mạng lưới quan hệ của mình, nên học tập với tinh thần cởi mở và tự tin chia sẻ, chắc chắn nó sẽ giúp ích cho con đường nghiên cứu sau này của bạn rất nhiều.
2. VEPR Summer School
- Tổ chức bởi Viện Nghiên cứu Kinh tế và Chính sách - thuộc Đại học Quốc gia Hà Nội
- Địa điểm học: miền Bắc và miền Nam (thường là đi đến 1 điểm nghỉ dưỡng nằm ngoài Hà Nội/TP. HCM)
- Số lượng học viên: khoảng 30 người cho mỗi miền
- Thời gian học: 4 ngày, thường vào tháng 7 hàng năm
- Phí: 500.000 - 700.000đ, các chi phí còn lại bao gồm chỗ ở, học phí, ăn uống, chi phí đi lại (thường là từ Hà Nội/TP. HCM đến địa điểm học) sẽ được miễn phí.
- Nội dung học: kiến thức nền tảng về nền kinh tế thị trường.
- Giảng viên: các chuyên gia kinh tế như TS. Nguyễn Đức Thành (giám đốc của VEPR), anh Đinh Tuấn Minh. Ngoài ra, hình như là vì anh Đức Thành rất quan tâm đến lịch sử và nghệ thuật, nên thường có thêm khách mời là các nghệ sĩ, nhạc sĩ,...
- Bình luận cá nhân:
Với kinh nghiệm trượt 1 lần và trúng 1 lần của bản thân và bạn bè, theo mình tiêu chí chọn học viên quan trọng nhất của khóa học này là thành tích nghiên cứu khoa học. Lý do mình nghĩ rằng với trường hè ở trên (VSSS) thì thành tích nghiên cứu khoa học chỉ là yếu tố thứ 2 là vì cùng 1 năm mình đăng ký 2 khóa học thì đậu VSSS và trượt VEPR huhu.
Đến lúc đậu khóa học này thì mình lại không học nên không có trải nghiệm cá nhân ở đây, nhưng cũng quen rất nhiều người học khóa học này nên theo mình đây cũng là 1 khóa học hữu ích, đặc biệt trong việc mở rộng mối quan hệ với những người cùng có mối quan tâm về kinh tế học. Các học viên học xong thường cũng được recommend đọc cuốn "Kinh tế học cấm đoán".
3. Vietnam Summer School in Research (VSSR)
- Được thành lập bởi 2 nhà nghiên cứu trẻ từng học tập tại Mỹ.
- Địa điểm học: Hà Nội và TP. HCM
- Số lượng học viên: khoảng 25 - 30 học viên cho mỗi lớp, mỗi khu vực sẽ có 4 lớp học cho 4 môn học khác nhau.
- Thời gian học: 4 ngày, thường vào tháng 7 hàng năm
- Phí: 2.000.000đ/môn, có tài trợ học bổng cho một số người tham dự.
- Hình thức lựa chọn học viên: thông qua bài kiểm tra đầu vào. Theo mình đánh giá thì bài test ở đây không quá khó, nhưng cần đầu tư thời gian để làm (trừ bài test cho môn quantitative method năm 2018 thì phải dành nhiều thời gian ôn lại kiến thức cũ thì mới làm được).
- Nội dung học: tuy mới diễn ra đến năm thứ 2 nhưng nội dung và chủ đề học của VSSR đã thay đổi nhiều, nội dung các môn học năm 2019 là: Public Policy, International Finance & Macroeconomics, Data visualiztion, và Applied Machine Learning.
- Giảng viên: đều là Tiến sĩ/nghiên cứu sinh Tiến sĩ trẻ, học tập tại Mỹ, nên môi trường ở đây khá cởi mở và năng động.
- Bình luận cá nhân:
Mình chưa tham gia khóa học này, nhưng một lần nữa, đây cũng là cơ hội để mở rộng mạng lưới quan hệ và đặc biệt hơn là tích lũy những kiến thức rất mới mẻ và hợp thời về kinh tế cho bản thân.
4. IFREE Summer School on Experimental Economics
- Được tài trợ bởi tổ chức International Foundation for Research in Experimental Economics (IFREE)
- Địa điểm học: TP. HCM
- Thời gian học: 3 ngày, vào tháng 7/8
- Phí: miễn phí, bao gồm học phí và coffee breaks, có tài trợ chi phí đi lại cho một số học viên ở xa, ưu tiên những người đang làm nghiên cứu.
- Nội dung học: giới thiệu về kinh tế học thí nghiệm và những ứng dụng thực tế.
- Giảng viên: đến từ nhiều trường Đại học ở nước ngoài
- Bình luận cá nhân: mình mới chỉ biết đến khóa học này nhưng thấy chủ đề này rất hay, các bạn hãy vào trang web để tìm hiểu thêm.
5. Khóa học về phân tích dữ liệu và ứng dụng
- Mình follow facebook của thầy Nguyễn Tuấn thì thấy thầy giảng nhiều bài về phân tích dữ liệu và xây dựng mô hình, thường do một đơn vị khác tổ chức, ví dụ trường ĐH Dược Hà Nội, Viện Y học Đinh Tiên Hoàng. Khóa học mình nhắc đến ở đây là chuỗi các bài giảng của thầy Nguyễn Tuấn, gần nhất sẽ là khóa học về xây dựng mô hình tiên lượng tại Hà Nội.
- Địa điểm học: Hà Nội và TP. HCM
- Thời gian học: thường là 6 - 7 ngày, tổ chức nhiều lần trong năm
- Phí: khoảng 3.000.000đ - 3.500.000đ đối với các khóa học kéo dài 6 - 7 ngày
- Nội dung học: phân tích dữ liệu và xây dựng mô hình
- Giảng viên: GS Nguyễn Văn Tuấn - Viện Nghiên cứu Y khoa Garvan, Úc
- Bình luận cá nhân:
Mình chưa từng tham gia lớp học nào của thầy Tuấn, nhưng có theo dõi những bài viết và bài giảng của thầy, thì thấy kiến thức của thầy rất chắc. Mặc dù các bài giảng của thầy đều lấy ví dụ về ngành y, nhưng về nội dung và phương pháp cũng rất hữu ích đối với ngành kinh tế.
Có nhiều khóa học từ cơ bản đến nâng cao (mặc dù không được tổ chức thành các lớp học cố định), phù hợp với nhiều đối tượng với background khác nhau (nhưng tất nhiên là đều phải có kiến thức cơ bản về thống kê).
Vì có nhiều khóa học không được thông báo công khai, mà chỉ có thông báo dành cho cán bộ trong trường (VD như khóa học ở Đại học Dược), trong khi vẫn chấp nhận người ở ngoài đăng ký, nên thường sẽ phải gọi điện hỏi trực tiếp. Bạn có thể theo dõi blog/facebook của thầy Nguyễn Tuấn để biết thêm thông tin về những khóa học tiếp theo.
6. VCREME
- Được tổ chức bởi Trung tâm nghiên cứu kinh tế, quản trị và môi trường Việt Nam (cái tên này không quan trọng, mà quan trọng là người đứng đằng sau nó), đứng đầu là GS. Lê Văn Cường - Giám đốc nghiên cứu ở Trung tâm Nghiên cứu Khoa học Quốc gia Pháp (CNRS).
- Địa điểm học: Hà Nội và TP. HCM
- Thời gian học: 1 năm thường có 2 khóa học, về các lĩnh vực Kinh tế, Tài chính và Kinh doanh; mỗi lĩnh vực sẽ có 4 môn học, mỗi môn có 7 buổi; học viên có quyền lựa chọn đăng ký một/nhiều môn học khác nhau.
- Phí: 5.000.000đ/môn học
- Nội dung học: với khóa học về kinh tế, nội dung học sẽ gồm 4 môn: Optimization, Macroeconomics, Microeconomics, và Econometrics. Kiến thức ở đây thường là kiến thức nền tảng, nhưng là đào sâu tận rễ chứ không hời hợt như ở trong trường Đại học, thêm nữa là kiến thức thường sẽ rất khó và rất nhiều toán, bạn sẽ phải cật lực để vượt qua bài kiểm tra đầu ra.
Các khóa học về Tài chính và Kinh doanh sẽ có 1 vài môn học khác đi (nhưng mình lười xem lại quá nên các bạn quan tâm thì tự tìm hiểu nhé).
- Giảng viên: đều là các giảng viên có kinh nghiệm, trình độ Tiến sĩ trở lên, nhiều giảng viên đã và đang giảng dạy ở nước ngoài, nên có thể yên tâm về kiến thức học được ở đây.
- Bình luận cá nhân:
Mục đích của khóa học này là giúp củng cố kiến thức về toán và giúp bạn có thêm 1 lá thư giới thiệu xịn xò từ thầy Cường, và để có thư giới thiệu thì bạn phải học ít nhất 4 môn học (tương đương học phí 20 triệu ahuhu). Vì vậy, khóa học này thường phù hợp với những bạn xác định chắc chắn muốn đi du học, và muốn theo học tại những trường ĐH mà lá thư giới thiệu của thầy Cường có hiệu lực, ví dụ như Glassgow (Anh), Toulouse (Pháp),... Ngoài ra, học ở đây có lợi ích là có thể được tham gia vào những dự án nghiên cứu của các thầy (nếu học giỏi), quen thêm nhiều anh chị khóa trước để nếu có đi học thì không bị bơ vơ.
Một điểm trừ của khóa học này (ngoài việc học phí cao) là các môn học thường diễn ra theo kiểu cuốn chiếu, thường chỉ kéo dài trong 1 tuần và vào buổi tối, nếu là cuối tuần thì sẽ học cả ngày nên sẽ cần chuẩn bị cả về sức khỏe và tinh thần. 7 buổi là không quá dài nên mặc dù kiến thức sâu nhưng cũng không thể kỳ vọng quá nhiều, đó sẽ chỉ là nền tảng để bạn tự mở rộng kiến thức của mình về sau.
Viết đến đây mỏi tay quá, nhưng mình vẫn muốn recommend thêm cho các bạn một chỗ hay ho nữa - Fgroup Việt Nam. Được sáng lập bởi anh Đinh Tuấn Minh (mà mình có nhắc đến ở trên ấy), Fgroup quy tụ rất nhiều bạn trẻ yêu thích nghiên cứu kinh tế (tuy nhiên cũng có nhiều lĩnh vực khác nữa). Fgroup có nhiều hoạt động hữu hữu ích dành cho cộng đồng, như các buổi Giao lưu học thuật, Webminar, giới thiệu sách,...tuy vậy, chủ đề mà Fgroup giới thiệu thường hơi kén người nghe.
Trên đây mới chỉ là một vài khóa học ngắn hạn, ngoài ra, nếu bạn có định hướng nghiên cứu kinh tế, thì sẽ cần phải học thêm rất rất nhiều nữa. Hy vọng những chia sẻ của mình sẽ có ích với các bạn :D
------------------------- Cảm ơn các bạn đã quan tâm. Youtube: https://youtube.com/c/beeline92 Facebook: https://www.facebook.com/xoiduamedia/ Website: http://xoidua.com
0 notes
Photo

Fascinating and visually stunning. The second half of the book was certainly more mathematical than I expected--but what a fascinating subject! I can see why the author is considered one of the top 50 creative/innovative people in the world. If you're interested in the way we categorize information and knowledge (particularly in the Big Data age), this book is for you. Go to Amazon
A MUST BUY - Make time for this one! This is an incredibly beautiful book. I've been spellbound. If you purchase only one book this year, it should be this one. Follow the tree charts, and they will take you to places you've never imagined. Do make sure you have some time for it, else you'll be frustrated... ;-) Go to Amazon
Four Stars Great representations and description. The historical context is great as well. Go to Amazon
Five Stars Bought this for my brother in law, perused it during the Christmas visit. Interesting stuff. He likes it. Go to Amazon
Five Stars Great Product!! Go to Amazon
If only the text were as gorgeous as the images If ever there were a book to make you feel bad about your PowerPoint skills and ability to create tables and graphs in Excel, this is it. Manuel Lima, working within the limitations of graphical representations based upon trees, nevertheless presents a panoply of images spanning nearly three millennia, though the focus is from on 1000 AD to present. During that time, trees - or things more or less recognizable as trees - have been used to trace genealogies, chronologies, taxonomies, and belief systems of all types, and Lima presents examples of all these manifold uses. The text itself is dry, and frankly I thought the descriptions of each diagram could have been a little more in-depth, but the images are clearly the draw here, and draw you they will. I admit that my interest flagged a bit toward the end, as the "trees" became less and less representative and more and more likely to deal with the inner workings of a computer, but by then my mind was so blown by the ability of good design to represent various types of data that the less-interesting bits gave me time to process everything I'd seen. A feast for the eyes and mind alike. Go to Amazon
Four Stars beautiful graphics and very interesting historical perspective on graphical visualiztion Go to Amazon
Beautiful and fascinating great book, truly. Amazing photos and illustrations, highly recommend Go to Amazon
Two Stars Four Stars Beautifully illustrated. A keeper. Beautiful but not nourishing Beautifully conceived work, well worth it... Excellent Book! Five Stars from the roots to the leaves Great gift
0 notes
Photo

Google Sheets Now Leverage ML for Effortless Data Visualiztion http://bit.ly/2sAVwCO
0 notes
Link
The contrast of the two satellite images below is striking. The one on the right,taken in 1972, shows Tanzanias Gombe National Park awash with splotches of bright green, an indicator of forest cover. The one on the left, captured in 1999, is dominated by swathes of dull brown the result of years of deforestation.
In just under three decades,80 percent of Gombes forests had been destroyed.
NASA/Goddard Scientific Visualiztion Studio/Cindy Starr
In the video above, published by NASA on Tuesday, the space agency explains how satellite images like these ones have helped save wildlife and improve livelihoods in Gombe National Park.
Since 2000, the Jane Goodall Institute, a conservation nonprofit thats worked extensively in Gombe, specifically with the parks endangered chimpanzees, has been using NASAs and the U.S. Geological SurveysLandsat satellite imagesto inform their chimp conservation strategies and boosttheir efforts to improve the living standards of local communities.
Unlike maps, which dont show the chimpanzees habitat side-by-side with human activities,Landsat imagery shows both scientists and the villagers the direct result of various land uses farming and logging for example and how they shaped the surrounding terrain and forests, NASA wrote in a news release this week.
The images have allowed conservationists to pinpoint where chimps are most at risk in the park and to design the best strategies to protect them.
NASA satellite data helps us understand what it means to be a chimp by overlaying distribution of the habitat with the chimpanzee behavior and ranging data, Lilian Pintea, vice president of conservation science at the Jane Goodall institute, said in a statement.
WikiCommons
A baby chimpanzee in Gombe National Park, Tanzania.
TONY KARUMBA/Getty Images
Dr. Jane Goodall, famed primatologist, said she realized conservationists needed the support and input of local communities in Gombe National Park to really make an impact protecting chimpanzees. “Unless we improve the lives of the people, we can’t even start to try to save the chimpanzees,” she said in a NASA video this week.
James Akena/Reuters
Satellite images have helped conservationists plan better chimpanzee conservation strategies in Gombe National Park, and have also empowered local communities to make better land use decisions.
The images have also helped villagers in the region to implement better land use strategies. Deforestation,caused by unchecked agriculture, local logging and charcoal production, has for decades posed a major threat to both chimps and people living in and around Gombe. The apes have lost critical feeding and nesting grounds, while people have suffered the degradation of valuable forest resources like honey and important tree species. Local water cycles have also been altered, triggering widespread erosion and flash flooding.
Conservationist Jane Goodall,founder of the institute that bears her name, recalled seeing the bare hills of Gombe when she flew over the park in 1990.
We flew over … and it was absolutely horrifying to me to see that, she said during a 2011 talk. Yes, I knew there was deforestation outside the park but I had not realized it was total deforestation.
Local communities, she said, were hard-hit by the forests destruction. People were clearly struggling to survive, Goodall said in the NASA video published this week.
She and her colleagues needed a way to engage with villagers to help them understand the extent of the deforestation crisis and empower them to make better land use choices that would not just be beneficial to their communities but to chimps and other wildlife too.
Gombe has taught us that long-term conservation is not possible without engaging local populations as partners and addressing their basic needs, the Jane Goodall Institute writes on its website. At the same time, Gombe has also shown us that the long-term prosperity of people depends upon protection of natural resources.
The satellite images, Pintea said, were the perfect tool to educate and inspire.
[The villagers would] tell stories about how the hills were covered in forest, he said in the clip. But then when you show them a picture, its very shocking to everybody, realizing what has been lost.
The images motivated villagers to form partnerships with the Jane Goodall Institute to help protect valuable forest reserves and to find better ways to sustainably manage their land. This technology, NASA said, has been agame changer for improving local conservation efforts.
Today, the forests of Gombe are steadily recovering. Satellite images show the hills of the park growing greener by the year.
Pintea said scientists have been using Landsat satellite images to help monitor and study chimps across their entire range, not just those in Gombe.
About one million chimpanzeesroamed the Earth at the start of the 20th century, according to the Jane Goodall Institute. Today, that number has plummeted mostly due to habitat lossto under 300,000.
Current trends indicate that African ape populations will decline by an additional 80 percent in the next 30-40 years, the institute writes on its website. We have a generation and a half possibly two to alter the trend.
Related Coverage
Watch How Climate Change Is Rapidly Transforming Our Planet
This Chain-Smoking Chimpanzee Is Trapped In A North Korean Zoo
Trump's Behavior Similar To Male Chimpanzee, Says Jane Goodall
This Lawyer Is Fighting To Give Chimpanzees Legal Rights
Deforestation Rates Skyrocket In Brazil As Country Struggles To Save The Amazon
Read more: http://ift.tt/2jvHNbv
The post How NASA Satellites Are Helping To Protect Endangered Chimpanzees appeared first on MavWrek Marketing by Jason
http://ift.tt/2kM8RUL
0 notes
Link
0 notes