#data_visualisation
Explore tagged Tumblr posts
Visit Tumblr Blog
Explore Tumblr blogs with no restrictions, modern design and the best experience.
Last Seen Tumblr Blogs


Fun Fact
Hackers stole 65M passwords from Tumblr in 2013.
Photo

Complexity can develop in any organisation. However, when it comes to infrastructure and major programmes, leveraging #cloud_technology, #data_visualisation and #Agile_Scrum becomes necessary for a complete #system_integration and to process and rationalise thousands of interfaces between engineering disciplines, suppliers, development standards, requirements, and other programme-level constraints - organisational performance improvement - multi-methodology programme delivery
1 note
·
View note
Text
Mars Craters- Size and Position Distributions
The Python code below shows the Distribution of Craters on the surface of Mars Graphically.

The Result of the above code gives the various Plots;
The Univariate Graph showing size distribution of Craters;

The Univariate Graph showing Position Distribution of Craters;

Finally, the Bivariate graph showing the Position and Size Distribution of the Craters
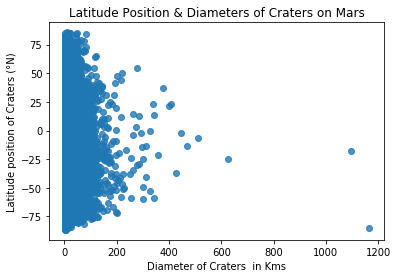
The Conclusion from the above Graphs are;
Most Craters are with diameters between 1-10 Kms in Diameters.
The density of Craters are the most near the Equator of Mars
The relatively Larger Craters are spread across the surface of Mars nearer to equator.
1 note
·
View note
Audio
(EduKite)
#SoundCloud#music#EduKite#Data_visualisation_course#data_visualisation#Visualizing_Data#free_online_courses
0 notes
Photo

#skilldevelopment #Analytics #analyticsplatform #development #talent #opportunity #data_visualisation #emergingskills #expertise_ensuring #marketingstrategy #professionaldevelopment #industry
0 notes
Link
Interactive data visualisations, created via d3.js, which facilitate an exploration of disease burden
0 notes
Text
Data visualisation (2)
Voici une sélection de mes sites de visualisation de données préférés : (source : http://www.webdesignerdepot.com/2009/06/50-great-examples-of-data-visualization/) Les sujets, les catégories, les concepts reliés entre eux ..... pendant une semaine dans le Guardian : http://www.designingthenews.com/2008/04/05/one-week-of-the-guardian-thursday/ Web trend map 4 : http://informationarchitects.jp/web-trend-map-4-final-beta/ Twingly screensaver : la blogosphère en temps réel (que sur pc - désolée pour les 34,28 % de mes lecteurs qui sont sur mac ...) : http://www.twingly.com/screensaver We feel fine : une manière de visualiser les émotions de la planète : http://www.wefeelfine.org/index.html schemaball : un visualisateur de base de données SQL : http://mkweb.bcgsc.ca/schemaball/?home Map of knowledge : http://www.ductil.org/mapa/english/ "... is the new ..." mapping des occurences où on utilise cette expression (par exemple "brown is the new black") : http://thediagram.com/6_3/leisurearts.html moins joli mais très pratique : on tape un nom et on voit un mapping des concepts/noms associés à partir du service news d'un site italien http://arianna.libero.it/graph/search/abin/graphnews?lemma=APPLE
0 notes
Photo

Traditional #change_management needs to change. Powerful #transformation_offices must leverage flexible project methodologies, i.e. #Agile_Scrum and should enable #CxOs to make informed decisions by providing #information_management and #data_visualisation capabilities, i.e. #Power_BI and #Tableau - business analysis enables organisations to transform - business change
#change_management#transformation_offices#agile_scrum#cxos#information_management#data_visualisation#power_bi#tableau
0 notes
Text
Mars Craters - Frequency Distribution , Latitude, Size
The Python Code below gives the Frequency distribution of Craters on Mars Surface at various Latitudes. Also, it includes the Distribution of Crater size.
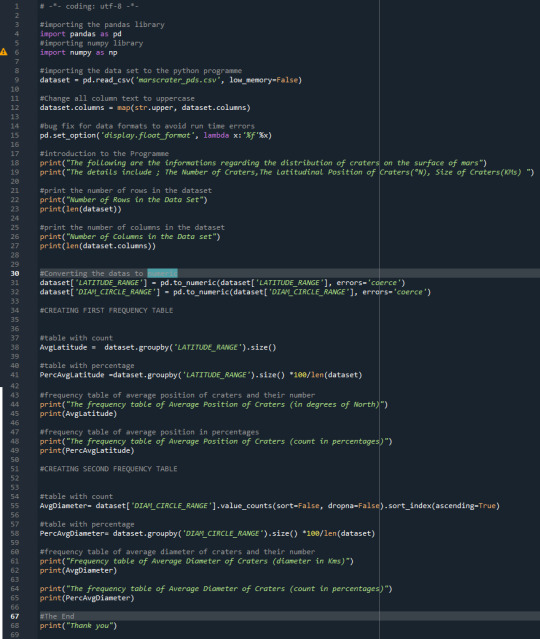
The Result of the above program is below;

The Result clarifies the following;
The major portion of the craters are concentrated near the Equatorial region.
More than 90% of the craters have diameters of about 5Kms.
Number of craters near the Polar region is the least.
Since there were no uncategorised craters in the Data set,Hence there is no missing data.
0 notes
Audio
(EduKite)
#SoundCloud#music#EduKite#Data_visualisation_course#data_visualisation#Visualizing_Data#free_online_courses
0 notes
Photo

#skilldevelopment #Analytics #analyticsplatform #development #talent #opportunity #data_visualisation #emergingskills #expertise_ensuring #marketingstrategy #professionaldevelopment #industry
0 notes
Text
#Employees today, are not just looking for #companies that provide #salaries and perks. They want #organizations that provide #engagement and #promote #generalwellness. They are looking for jobs that help them #strike a good #work_life balance. As a result, HR fast needs to become an #employees friend rather than a #guardian, as it has #traditionally been. This #transition is not going to be easy.
#development #analytics #Data_Visualisation #talent #expertise_ensuring
0 notes
Photo

#skilldevelopment #Analytics #analyticsplatform #development #talent #opportunity #data_visualisation#emergingskills #expertise_ensuring #marketingstrategy #professionaldevelopment #industry #globally #ACCEPTED #certificate
0 notes
Text
MBA students
Supply #chainanalytics #Analytics is taking new leap with supply #chainanalytics. An exclusive #program #designed by industry experts from #Amazon, #IBM, #Infosys and Lowes for MBA #Supply_Chain Students, Supply Chain #professionals and #researchers. #Development #analytics #skilldevelopment #Data_Visualisation
0 notes
Photo

#skilldevelopment #Analytics #analyticsplatform #development #talent #opportunity #data_visualisation#emergingskills #expertise_ensuring #marketingstrategy #professionaldevelopment #industry
0 notes
Photo

#skilldevelopment #Analytics #analyticsplatform #development #talent #opportunity #data_visualisation
0 notes