#dataflow gen2
Explore tagged Tumblr posts
Visit Tumblr Blog
Explore Tumblr blogs with no restrictions, modern design and the best experience.
Last Seen Tumblr Blogs


Fun Fact
Tumblr has been banned in Indonesia for providing people with access to pornographic content.
Text
[Fabric] Dataflows Gen2 destino "archivos" - Opción 1
La mayoría de las empresas que utilizan la nube para construir una arquitectura de datos, se están inclinando por una estructura lakehouse del estilo "medallón" (bronze, silver, gold). Fabric acompaña esta premisa permitiendo estructurar archivos en su Lakehouse.
Sin embargo, la herramienta de integración de datos de mayor conectividad, Dataflow gen2, no permite la inserción en este apartado de nuestro sistema de archivos, sino que su destino es un spark catalog. ¿Cómo podemos utilizar la herramienta para armar un flujo limpio que tenga nuestros datos crudos en bronze?
Para comprender mejor a que me refiero con "Tablas (Spark Catalog) y Archivos" de un Lakehouse y porque si hablamos de una arquitectura medallón estaríamos necesitando utilizar "Archivos". Les recomiendo leer este post anterior: [Fabric] ¿Por donde comienzo? OneLake intro
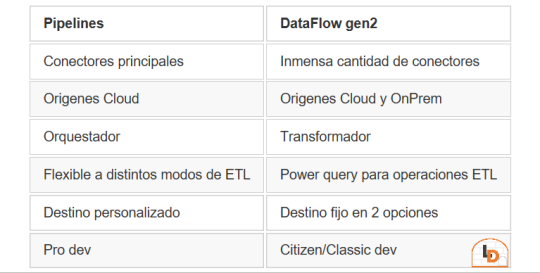
Fabric contiene un servicio llamado Data Factory que nos permite mover datos por el entorno. Este servicio tiene dos items o contenidos que fortalecen la solución. Por un lado Pipelines y por otro Dataflow Gen2. Veamos un poco una comparación teórica para conocerlos mejor.
NOTA: al momento de conectarnos a origenes on premise, leer las siguientes consideraciones: https://learn.microsoft.com/es-es/fabric/data-factory/gateway-considerations-output-destinations
Esta tabla nos ayudará a identificar mejor cuando operar con uno u otro. Normalmente, recomendaria que si van a usar una arquitectura de medallón, no duden en intentarlo con Pipelines dado que nos permite delimitar el destino y las transformaciones de los datos con mayor libertad. Sin embargo, Pipelines tiene limitada cantidad de conectores y aún no puede conectarse onpremise. Esto nos lleva a elegir Dataflow Gen2 que dificilmente exista un origen al que no pueda conectarse. Pero nos obliga a delimitar destino entre "Tablas" del Lakehouse (hive metastore o spark catalog) o directo al Warehouse.
He en este intermedio de herramientas el gris del conflicto. Si queremos construir una arquitectura medallón limpia y conectarnos a fuentes onpremise o que no existen en Pipelines, no es posible por defecto sino que es necesario pensar un approach.
NOTA: digo "limpia" porque no considero prudente que un lakehouse productivo tenga que mover datos crudos de nuestro Spark Catalog a Bronze para que vaya a Silver y vuelva limpio al Spark Catalog otra vez.
¿Cómo podemos conseguir esto?
La respuesta es bastante simple. Vamos a guiarnos del funcionamiento que Dataflow Gen2 tiene en su background y nos fortaleceremos con los shortcuts. Si leemos con detenimiento que hacen los Dataflows Gen2 por detrás en este artículo, podremos apreciar un almacenamiento intermedio de pre viaje a su destino. Esa es la premisa que nos ayudaría a delimitar un buen orden para nuestro proceso.
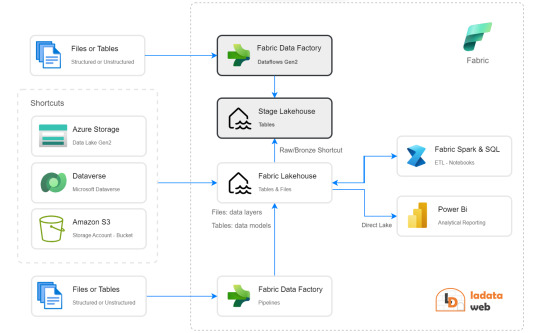
Creando un Lakehouse Stage (no es el que crea Fabric de caja negra por detrás sino uno creado por nosotros) que almacene los datos crudos provenientes del origen al destino de Tables. Nuestro Lakehouse definitivo o productivo haría un shortcut desde la capa Bronze a este apartado intermedio para crear este puntero a los datos crudos. De esta manera podemos trabajar sobre nuestro Lakehouse con un proceso limpio. Los notebooks conectados a trabajar en bronze para llevar a silver lo harían sin problema. Para cuando lleguemos a "Tables" (spark catalog o hive metastore), donde normalmente dejaríamos un modelo dimensional, tendríamos las tablas pertinentes a un modelo analítico bien estructurado.
Algunos ejemplos de orígenes de datos para los cuales esta arquitectura nos servirían son: Oracle, Teradata, SAP, orígenes onpremise, etc.
Espero que esto los ayude a delimitar el proceso de manera más limpia. Por lo menos hasta que Pipelines pueda controlarlo como lo hace Azure Data Factory hoy.
¿Otra forma?
Seguramente hay más, quien sabe, tal vez podamos mostrar un segundo approach más complejo de implementar, pero más caja negra para los usuarios en un próximo post.
#power bi#powerbi#ladataweb#fabric#microsoft fabric#fabric tips#fabric tutorial#fabric training#dataflow gen2#fabric data factory#data factory#data engineering
0 notes
Text

🔍 What are Dataflows (Gen 2)? 💬 They are a cloud-based ETL solution designed to create and run scalable data transformation workflows.
📣 Now it’s your turn! How would you define Dataflows Gen 2 in your own words? Drop your answer below 👇
#MicrosoftFabric#Dataflows#ETL#PowerBI#DataEngineering#DataTransformation#CloudData#Gen2#MicrosoftPowerPlatform#DataIntegration
0 notes
Text
Integrating Microsoft Fabric After Tableau Migration: Next-Level Analytics
Migrating from Tableau to Power BI is just the beginning of an advanced analytics journey. Once your data ecosystem shifts to Microsoft's environment, leveraging Microsoft Fabric can push your business intelligence to the next level. This unified platform empowers teams to build powerful, scalable, and collaborative data experiences that go beyond traditional dashboards.
What is Microsoft Fabric?
Microsoft Fabric is an all-in-one analytics solution that unites data engineering, data integration, data science, real-time analytics, and business intelligence under one unified SaaS umbrella. It’s tightly integrated with Power BI, enabling seamless analytics workflows. Post-migration, Fabric acts as the glue that connects your newly transformed Power BI environment with the broader data infrastructure.
Why Use Microsoft Fabric After Tableau Migration?
When organizations migrate from Tableau to Power BI, they often do so to gain access to deeper integration with Microsoft’s ecosystem. Microsoft Fabric amplifies this advantage by:
Eliminating Data Silos: Fabric allows your teams to ingest, transform, and store data in a single environment using OneLake, a unified data lake that ensures consistency and accessibility.
Accelerating Time to Insight: With capabilities like real-time data flows, lakehouses, and semantic models, analysts and decision-makers can generate insights faster than ever before.
Enhancing Collaboration: Shared workspaces in Fabric allow teams to co-author data models, reports, and pipelines — all while maintaining governance and security.
Key Integration Benefits
1. Unified Data Layer with OneLake Microsoft Fabric introduces OneLake, a single logical data lake built for all workloads. Unlike Tableau, which typically required third-party data lakes or external connectors, Fabric brings everything into a unified space — making storage, querying, and access more seamless after migration.
2. End-to-End Data Pipelines With built-in Data Factory capabilities, users can automate ingestion from multiple sources, transform it using Spark or SQL, and deliver clean data directly to Power BI datasets. This eliminates the need for maintaining separate ETL tools post-migration.
3. AI-Powered Analytics with Copilot After moving to Power BI, organizations can use Copilot in Microsoft Fabric to generate DAX formulas, write code, or even build reports using natural language prompts. This is a huge leap forward from Tableau’s more manual development environment.
4. Real-Time Analytics for Business Agility Microsoft Fabric’s Real-Time Analytics feature allows users to analyze event-driven data — ideal for finance, operations, or customer service teams who need immediate insights from streaming sources.
Strategic Approach to Integration
To fully harness Microsoft Fabric after Tableau migration:
Start with Data Modeling: Review and optimize your Power BI data models to work efficiently within Fabric’s lakehouse or warehouse environment.
Automate Pipelines: Rebuild any Tableau Prep workflows using Fabric’s Dataflow Gen2 or Data Factory pipelines.
Train Teams: Enable your analysts and developers with Fabric-specific training to maximize adoption.
Governance First: Set up data lineage tracking, access controls, and workspaces early to ensure scalability and compliance.
Final Thoughts
The move from Tableau to Power BI sets the foundation — but integrating Microsoft Fabric is what truly unlocks the future of enterprise analytics. With a seamless environment for data storage, modeling, automation, and visualization, Microsoft Fabric empowers organizations to be data-driven at scale.
Ready to elevate your analytics journey? Learn more at 👉 https://tableautopowerbimigration.com/
0 notes
Text
Transform and load data
Most data requires transformations before loading into tables. You might ingest raw data directly into a lakehouse and then further transform and load into tables. Regardless of your ETL design, you can transform and load data simply using the same tools to ingest data. Transformed data can then be loaded as a file or a Delta table.
Notebooks are favored by data engineers familiar with different programming languages including PySpark, SQL, and Scala.
Dataflows Gen2 are excellent for developers familiar with Power BI or Excel since they use the PowerQuery interface.
Pipelines provide a visual interface to perform and orchestrate ETL processes. Pipelines can be as simple or as complex as you need.
0 notes
Text
Integrate Dataflows Gen2 and Pipelines in Microsoft Fabric
Dataflows Gen2 provide an excellent option for data transformations in Microsoft Fabric. The combination of dataflows and pipelines is useful when you need to perform additional operations on the transformed data. Data pipelines are a common concept in data engineering and offer a wide variety of activities to orchestrate. Some common activities include: Copy data Incorporate Dataflow Add…
View On WordPress
0 notes
Text
Mastering Power BI Data Migration with Dataflows
Data migration is a vital step for organizations looking to modernize their data infrastructure, and Power BI dataflows provide an efficient way to handle this transition. With features like centralized data preparation, reusability, and seamless integration with Azure Data Lake Storage, dataflows streamline the ETL (Extract, Transform, Load) process for businesses.
Why Choose Power BI Dataflows for Data Migration?
🔹 Reusability – Apply transformations across multiple Power BI reports, ensuring consistency. 🔹 Simplified ETL Process – Use Power Query Editor to transform and clean data effortlessly. 🔹 Azure Data Lake Integration – Secure and scalable storage for large datasets. 🔹 Improved Data Consistency – Centralized data management eliminates inconsistencies across reports.
Step-by-Step Guide to Dataflow Migration
📌 Migrating Queries from Power BI Desktop: ✅ Copy M code from Power Query Editor and paste it into a new dataflow in the Power BI service. ✅ Save and refresh the dataflow to activate the new data pipeline.
📌 Upgrading from Dataflow Gen1 to Gen2: ✅ Assess existing dataflows and review Microsoft’s migration guidelines. ✅ Update connections and ensure reports are linked to Dataflow Gen2 for better performance and scalability.
0 notes
Text
What’s New in Azure Data Factory? Latest Features and Updates
Azure Data Factory (ADF) has introduced several notable enhancements over the past year, focusing on expanding data movement capabilities, improving data flow performance, and enhancing developer productivity. Here’s a consolidated overview of the latest features and updates:
Data Movement Enhancements
Expanded Connector Support: ADF has broadened its range of supported data sources and destinations:
Azure Table Storage and Azure Files: Both connectors now support system-assigned and user-assigned managed identity authentication, enhancing security and simplifying access management.
ServiceNow Connector: Introduced in June 2024, this connector offers improved native support in Copy and Lookup activities, streamlining data integration from ServiceNow platforms.
PostgreSQL and Google BigQuery: New connectors provide enhanced native support and improved copy performance, facilitating efficient data transfers.
Snowflake Connector: Supports both Basic and Key pair authentication for source and sink, offering flexibility in secure data handling.
Microsoft Fabric Warehouse: New connectors are available for Copy, Lookup, Get Metadata, Script, and Stored Procedure activities, enabling seamless integration with Microsoft’s data warehousing solutions.
Data Flow and Processing Improvements
Spark 3.3 Integration: In April 2024, ADF updated its Mapping Data Flows to utilize Spark 3.3, enhancing performance and compatibility with modern data processing tasks.
Increased Pipeline Activity Limit: The maximum number of activities per pipeline has been raised to 80, allowing for more complex workflows within a single pipeline.
Developer Productivity Features
Learning Center Integration: A new Learning Center is now accessible within the ADF Studio, providing users with centralized access to tutorials, feature updates, best practices, and training modules, thereby reducing the learning curve for new users.
Community Contributions to Template Gallery: ADF now accepts pipeline template submissions from the community, fostering collaboration and enabling users to share and leverage custom templates.
Enhanced Azure Portal Design: The Azure portal features a redesigned interface for launching ADF Studio, improving discoverability and user experience.
Upcoming Features
Looking ahead, several features are slated for release in Q1 2025:
Dataflow Gen2 Enhancements:
CI/CD and Public API Support: Enabling continuous integration and deployment capabilities, along with programmatic interactions via REST APIs.
Incremental Refresh: Optimizing dataflow execution by retrieving only changed data, with support for Lakehouse destinations.
Parameterization and ‘Save As’ Functionality: Allowing dynamic dataflows and easy duplication of existing dataflows for improved efficiency.
Copy Job Enhancements:
Incremental Copy without Watermark Columns: Introducing native Change Data Capture (CDC) capabilities for key connectors, eliminating the need for specifying incremental columns.
CI/CD and Public API Support: Facilitating streamlined deployment and programmatic management of Copy Job items.
These updates reflect Azure Data Factory’s commitment to evolving in response to user feedback and the dynamic data integration landscape. For a more in-depth exploration of these features, you can refer to the official Azure Data Factory documentation.
WEBSITE: https://www.ficusoft.in/azure-data-factory-training-in-chennai/
0 notes
Text
Dataflow Gen2 Transformations Tutorial
Are you curious about how to apply multi-table transformations in #MicrosoftFabric's Dataflow Gen2 pipelines? In this tutorial, I explain how to apply join and combine data from multiple data sources and demonstrate how to use fuzzy matching for cleansing data inaccuracies. Check out here:https://youtu.be/SaKlgAaxVd8
0 notes
Text
Microsoft and MongoDB Cloud Services
Microsoft and MongoDB Alliance: Key Customer Benefits
Microsoft must remember that data fuels AI as Microsoft enter the AI era. This explains why Microsoft want Azure to be the best data destination. Customers can choose from relational, non-relational, open source, and caching databases in Azure. Microsoft also have strong partnerships with MongoDB Inc. to allow digital transformation leveraging their databases as Azure managed services.
MongoDB, a renowned data platform, makes data modeling easy for developers. Microsoft connection with MongoDB has grown over the years, culminating in a multiyear strategic partnership deal this year. Microsoft are proud of their collaboration to offer Azure a wonderful place to run MongoDB Atlas. The popularity of the MongoDB Atlas on Azure pay-as-you-go self-service has made MongoDB one of our top Azure Marketplace partners in the previous six months.
Microsoft wants to empower everyone to succeed, and their customers prefer using MongoDB to build apps. In year one of Microsoft’s strategic collaboration, Microsoft worked with MongoDB to help their customers do more with Microsoft services and MongoDB Atlas on Azure. Developers now use MongoDB Atlas in 40+ Azure areas worldwide, including Doha, Qatar, which Microsoft announced last month at Ignite. It’s not just about the data center developers need an easy way to start with MongoDB Atlas on Azure. With its code suggestions, GitHub Copilot makes it easy to build MongoDB applications on Azure. They are working together to optimize its performance utilizing MongoDB schema, among other things.
Customers are already benefiting from their strategic partnership. Their collaboration with Temenos helped their banking customers rise to historic levels. Another collaborative intelligence business, Mural, highlighted their MongoDB Atlas and Microsoft Azure experience to help clients communicate smarter.
Microsoft Ignite 2023: MongoDB
MongoDB Atlas on Azure client experience is improved by ongoing efforts. Microsoft and MongoDB announced three major integrations at Microsoft Ignite 2023 in November: Microsoft Semantic Kernel, Microsoft Fabric, and EF Core. How can customers profit from each?
Semantic Kernel, an open-source SDK, integrates OpenAI, Azure OpenAI, and Hugging Face with C# and Python. At Ignite, MongoDB revealed Semantic Kernel native support for Atlas Vector Search. Customers may integrate operational data and vectors in a single, managed platform with MongoDB Atlas Vector Search. Semantic Kernel lets customers add Atlas Vector Search to apps. This allows Atlas Vector Search to engage with retrieval-augmented generation (RAG) in large language models (LLMs), minimizing AI hallucinations and other benefits.
By uniting your teams on an AI-powered platform optimized for AI, Microsoft Fabric can transform how they work with data. Many applications use MongoDB Atlas as their operational data layer to store data from internal enterprise apps, customer-facing services, and third-party APIs across numerous channels. With interfaces for Microsoft Fabric pipelines and Dataflow Gen2, Microsoft customers can mix MongoDB Atlas data with relational data from traditional applications and unstructured data from logs, clickstreams, and more.
At Microsoft Ignite, innovative announcements made this integration seamless and straightforward for MongoDB clients. Microsoft revealed that Fabric is now broadly accessible and introduced Mirroring, a frictionless approach to integrate and manage cloud data warehouses and databases like MongoDB, in Fabric, during the first presentation. Now MongoDB customers can replicate a snapshot of their database to One Lake, which will automatically sync it in near real-time. Learn how Microsoft Fabric intelligent analytics can uncover MongoDB Atlas data value here.
Many of the millions of C# developers use Entity Framework (EF) Core, a lightweight, extensible, open source, and cross-platform data access technology. MongoDB revealed MongoDB Provider for EF Core in Public Preview. This lets EF Core developers construct C#/.NET apps with MongoDB using their preferred APIs and design patterns.
Each time, Microsoft worked with MongoDB to make it easy for developers, data engineers, and data scientists to connect MongoDB data to Microsoft services.
A year of collaboration improvement
These new integrations follow a successful year of Microsoft-MongoDB collaboration. Microsoft highlighted great developer news outside Microsoft Ignite:
August 2023 saw the general release of MongoDB for VS Code Extension. During its public preview, developers downloaded the MongoDB extension over 1 million times in VS Code, the world’s most popular IDE. This free, downloadable add on lets developers build apps and manage MongoDB data from VS Code.
MongoDB integrates with many Microsoft Intelligent Data Platform (MIDP) services, such as Azure Synapse Analytics for operational data analysis, Microsoft Purview for data security, and Power BI for data analysts to create and share dashboards using live MongoDB Atlas data.
Data Federation: Atlas Data Federation supports Azure Blob Storage in private preview on Microsoft Azure.
Microsoft have published tutorials on building server less functions with MongoDB Atlas and Azure Functions, creating MongoDB applications with Azure App Service, building Flask and MongoDB applications with Azure App Container Apps, developing IoT data hubs for smart manufacturing, and connecting MongoDB Atlas and Azure Data Studio for Azure customers.
The year has been terrific for Microsoft and MongoDB, helping enterprises of all sizes do more with their data.
Read more on Govindhtech.com
0 notes
Text
What are the basic concepts of the Power BI service for beginners?
The five major structure blocks of Power BI are dashboards, reports, workbooks, datasets, and dataflows. They are all organized into workspaces, and they are created on capacities. It's important to understand capacities and workspaces before we dig into the five structure blocks, so let's start there.
Capacities:
Capacities are a core Power BI concept representing a set of coffers( storehouse, processor, and memory) used to host and deliver your Power BI content. Capacities are moreover participated or reserved. A participating capacity is participated with other Microsoft guests, while a reticent capacity is reserved for a single client. Reserved capacities bear a subscription and are completely described in the Managing Premium capacities composition.
By dereliction, workspaces are created in a participating capacity. In the participating capacity, workloads run on computational coffers participated with other guests. As the capacity must partake in coffers, limitations are assessed to insure" fair play", similar to the maximum model size( 1 GB) and maximum diurnal refresh frequency( eight times per day).
Workspaces:
Workspaces are created on capacities. Basically, they're holders for dashboards, reports, workbooks, datasets, and dataflows in Power BI. There are two types of workspaces: My workspace and workspaces. My workspace is the particular workspace for any Power BI client to work with their own content. Only you have access to your My workspace. You can partake in dashboards and reports from your MyWorkspace. However, or produce an app, also want to work in a workspace, If you want to unite on dashboards and reports. Workspaces are used to connect and partake in content with associates.
You can add associates to your workspaces and unite on dashboards, reports, workbooks, and datasets. With one exception, each workspace member needs a Power BI Pro or Premium Per stoner( PPU) license. Read further about workspaces. Workspaces are also where you produce, publish, and manage apps for your association. suppose workspaces are staging areas and holders for the content that will make up a Power BI app.
So what's an app? It's a collection of dashboards and reports erected to deliver crucial criteria to the Power BI consumers in your association. Apps are interactive, but consumers can not edit them. App consumers, the associates who have access to the apps, do not inescapably need Pro or Premium Per stoner( PPU) licenses.
Dataflows:
A dataflow helps associations to unify data from distant sources. They're voluntary and are frequently used in complex or larger systems. They represent data sets and are offered for use by datasets. Dataflows are surfaced in Power BI Desktop with a devoted connector to enable reporting. When you connect to a dataflow, your dataset can use the preliminarily prepared data and business sense, promoting a single source of the variety and data reusability.
They work the expansive collection of Microsoft data connectors, enabling the ingestion of data from on- demesne and pall- grounded data sources. Dataflows are only created and managed in workspaces( but not My Workspace), and they're stored as realities in the Common Data Model( CDM) in Azure Data Lake Storage Gen2.
generally, they are listed to refresh on a recreating base to store over- to- date data. They are great for preparing data for use — and implicit play — by your datasets. For further information, see the tone- service data fix in Power BI composition.
Datasets:
A dataset is a collection of data that you import or connect to. Power BI lets you connect to and import all feathers of datasets and bring all of it together in one place. Datasets can also reference data from dataflows.
Datasets are associated with workspaces and a single dataset can be part of numerous workspaces. When you open a workspace, the associated datasets are listed under the Datasets tab. Each listed dataset is a source of data available for one or further reports, and the dataset may contain data that comes from one or further sources. For illustration, an Excel workbook on OneDrive, or an on- demesne SSAS irregular dataset, or a Salesforce dataset. There are numerous different data sources supported, and we are adding new bones all the time.
0 notes
Text
[Fabric] ¿Cómo funciona Dataflow gen2? ¿Qué es staging?
Fabric ya es una materia frecuente en la comunidad de datos y cada vez se analiza en mayor profundidad. En esta oportunidad iremos al servicio de Data Factory que cuenta con dos tipos de procesos de movimientos de datos. Pipelines, que vimos un ejemplo de la simpleza de su asistente para copiar datos y por otro lado, dataflows gen2.
Tal vez el nombre resuene porque fue usada en varias oportunidades dentro de diferentes servicios. No nos confundamos con los que existían en Azure Data Factory, éstos son creados con la experiencia de Power Query Online. En este artículo nos vamos a enfocar en Dataflow gen2. Vamos a conocerlos y en particular describir sobre su característica de "Staging" que podría ser la más influeyente y distinta a los conceptos que manejaban en la primera generación.
Indiscutiblemente, la experiencia de power query online, permite a diversos tipos de profesionales realizar una ingesta de datos con complejas transformaciones. Tanto usuarios expertos (que usan mucho código) como convencionales (que prefieren más clicks que código) puede aprovechar la buena experiencia de usuario de la herramienta para desarrollar joins, agregaciones, limpieza y transformaciones de datos, etc.
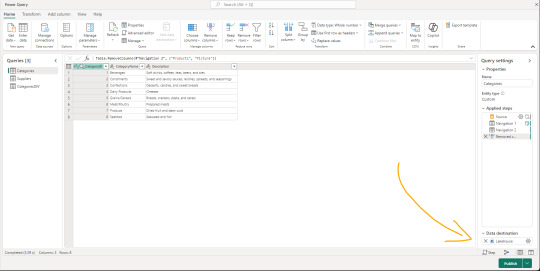
Dataflows gen2 es la evolución de los Power Bi Dataflows con mejores capacidades de computo y preparado con capacidades de movimientos de datos a diversos destinos de Fabric y Azure. Aquí la primera gran diferencia, establecer un destino para el job de power query online. Podemos apreciar la nueva sección en la siguiente imagen:
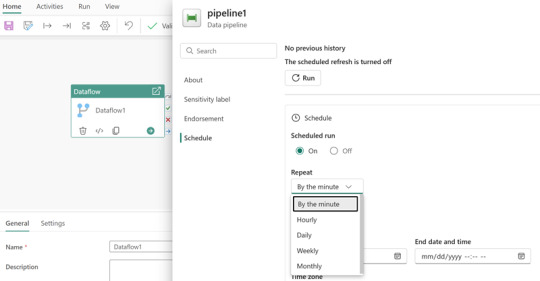
Los proyectos de movimientos de datos suelen tener algunos desafíos que hacen variar el modo en que construimos. Algunos escenarios buscan transformar datos para ingestarlos en un limpio almacenamiento, mientras que otros prefieren pasar por estapas o stages que tengan distintas granularidad o limpieza de datos. Otro gran desafío es la orquestación. Garantizar que la ingesta y transforaciones puedan calendarizarse apropiadamente.
Como todo proyecto de datos es distinto, depende de cada uno cual sería la forma apropiada de mover datos. Si bien datalfows gen2 puede realizarlo, no significa que siempre sea la mejor opción. Por ejemplo, los escenarios de big data cuando grandes volumenes deben ser ingestados con complejos patrones para tomar la información de diversos origenes de datos, tal vez sea mejor dejar ese lugar a Pipelines de Data Factory. Dataflows gen2 también puede usarse para transformaciones dentro de Fabric. Esto significa que podemos tener de origen de un dataflow gen2 a nuestros archivos de Lakehouse crudos y limpiarlos para llevarlos a un warehouse.
Una de las fortaleza más grande de dataflows gen2, pasa por la cantidad de conectores que power query tiene desarrollado. Indudablemente, una de las herramientas con mayor integración del mercado.
¿Cómo funcionan?
Para inciar, llamaremos al proceso que interpreta Power Query y ejecuta su lenguaje como "Mashup engine". Los dataflow gen2 nos permiten obtener datos de muchos origenes diversos y a cada uno de ellos delimitar un destino. Ese destino puede ser reemplazando/pisando la tabla de arribo o puede ser haciendo append de lo que lea. En medio de este proceso, existe la posibilidad de poner un almacenamiento intermedio que llamaremos Staging. El staging llega a nosotros para fortalecer a power query para algunas operaciones que eran muy complejas de resolver de un solo tirón dentro del Mashup Engine como por ejemplo "merges".
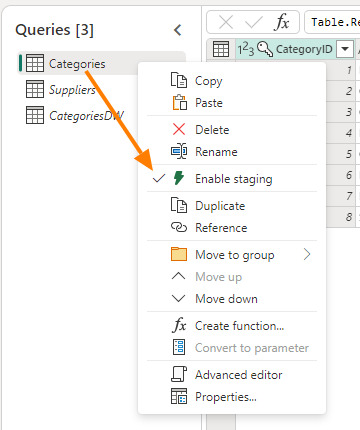
La nueva característica Staging viene activada por defecto y podemos elegir si usarla o no, con un simple click derecho "Enagle Staging". Cuando no esté activada el título de la tabla estará en cursiva.
Activar esa opción hará que los pasos ejecutados por el Mashup Engine se depositen primero en un Lakehouse Staging oculto para nosotros. Si tenemos configurado el destino, el paso siguiente sería llevarlo a destino. Según activemos la característica, nuestro dato podría viajar de dos formas:
Sin Staging
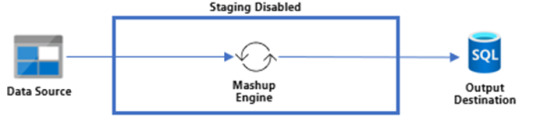
Con Staging
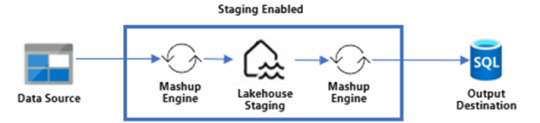
Puede que estén pensando ¿Por qué guardaríamos dos veces nuestra data? Cierto es que puede sonar redundante, pero en realidad es muy provechoso si lo utilizamos a nuestro favor. Como dije antes, hacer merge es algo que Power Query tenía muy dificil de lograr en una sola ejecución del Mashup Engine contra el origen. Ahora bien, ¿que tal si obtenemos datos de dos tablas, prendemos su staging pero no activamos su destino?. Eso dejaría nuestra dos tablas en staging oculto sin destino. Esto nos da pie para crear una tercer consulta en la interfaz de Power Query que haga el Merge de ambas tablas con destino. De este modo, realizaríamos un segundo Mashup Engine que esta vez tiene como origen Tablas de un Lakehouse oculto a nuestro destino. Ejecutar el merge contra el lakehouse oculto será más performante que contra el origen que no siempre dispone de las mejores capacidades de joins. Algo asi:
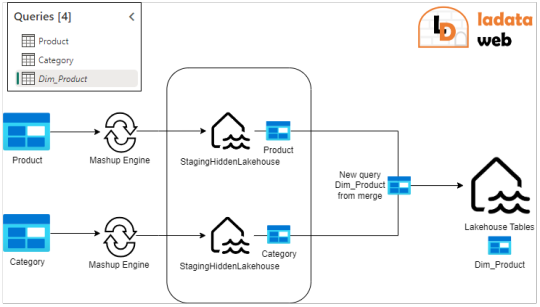
Fíjense como Product y Category tienen staging prendido. La nueva query que hace un merge de Table.Combine esta cursiva, lo que significa que no tiene Staging. Ésta última es la única con un destino configurado.
Algunas pautas para no hacer staging son:
Si tu fuente de datos no contiene grandes volúmenes de datos
Si no estás uniendo datos de diferentes fuentes de datos (joins/merges)
Si no estás realizando transformaciones intensivas en computo/memoria como unir o agregar grandes volúmenes de datos
Destino
La nueva característica de destino tiene cuatro asociados pero seguramente la usaríamos para hacer ingesta de Fabric Warehouse o Fabric Lakehouse. Cuando hablamos de warehouse su funcionamiento es tal y como se lo imaginen. Sin embargo, para lakehouse hay que prestar atención a un detalle. Cuando nuestro destino es el Lakehouse de Fabric, nuestra tablas será almacenadas en formato delta parquet sobre la carpeta "Tables". Hoy no podemos configurar que el destino sea "Files". Si no estan seguros de lo que hablo, pueden repasarlo en este post anterior sobre OneLake.
Esto ha sido todo nuestro artículo para introducirlos a la nueva generación de Dataflows en Fabric Data Factory. Espero les sea útil y los ayude a mover datos.
#power bi#powerbi#fabric#fabric data factory#fabric dataflows#fabric dataflows gen2#dataflows gen2#fabric argentina#fabric cordoba#fabric jujuy#fabric tutorial#fabric tips#fabric training#ladataweb
0 notes
Text

🧩 Power Query Online Tip: Diagram View
Q: What does the Diagram View in Power Query Online allow you to do?
✅ A: It gives you a visual representation of how your data sources are connected and what transformations have been applied.
🔍 Perfect for understanding query logic, debugging complex flows, and documenting your data prep process—especially in Dataflows Gen2 within Microsoft Fabric.
👀 If you're more of a visual thinker, this view is a game-changer!
💬 Have you tried Diagram View yet? What’s your experience with it?
#PowerQuery#PowerQueryOnline#MicrosoftFabric#DataflowsGen2#DataPreparation#ETL#DataTransformation#DiagramView#LowCode#DataEngineering#FabricCommunity#PowerBI#DataModeling#OneLake
0 notes
Text
Microsoft DP-500 Practice Test Questions
If you pass the DP-500 Designing and Implementing Enterprise-Scale Analytics Solutions Using Microsoft Azure and Microsoft Power BI exam you will gain Microsoft Certified: Azure Enterprise Data Analyst Associate Certification. The latest DP-500 Practice Test Questions are new cracked by PassQuestion team to help you understand and learn the right source to clear in the Microsoft DP-500 Exam and to get good grades. To get guaranteed result in DP-500 Exam, the best DP-500 Practice Test Questions for candidates who just by preparing with DP-500 exam for two weeks can easily clear the DP-500 Exam without difficulty. After studying our DP-500 Practice Test Questions, you can take your Microsoft DP-500 exam with confidence.
DP-500: Designing and Implementing Enterprise-Scale Analytics Solutions Using Microsoft Azure and Microsoft Power BI
Candidates who have subject matter knowledge in developing, creating, and executing enterprise-scale data analytics solutions should take the Microsoft DP-500 exam. This exam requires advanced Power BI skills, such as managing data repositories and processing data both in the cloud and on-premises, as well as using Power Query and Data Analysis Expressions (DAX). Furthermore, candidates should be able to utilize data from Azure Synapse Analytics and have previous expertise in querying relational databases, analyzing data with Transact-SQL (T-SQL), and visualizing data.
Exam Details
There are 40-60 questions in the Microsoft DP-500 exam. Questions on the Microsoft DP-500 can be:
scenario-based single-answer questions,
multiple-choice questions, arrange in the correct sequence type questions
drag & drop questions
mark review
drag, and drop
A candidate must, however, achieve a score of 700 or better in order to pass the exam. Furthermore, the exam is only offered in English and will cost you $165 USD.
Exam Content
Implement and manage a data analytics environment (25–30%) Query and transform data (20–25%) Implement and manage data models (25–30%) Explore and visualize data (20–25%)
View Online Microsoft Azure Enterprise Data Analyst DP-500 Free Questions
You have a Power Bl dataset that has only the necessary fields visible for report development. You need to ensure that end users see only 25 specific fields that they can use to personalize visuals. What should you do? A.From Tabular Editor, create a new role. B.Hide all the fields in the dataset. C.Configure object-level security (OLS). D.From Tabular Editor, create a new perspective. Answer : B
You plan to generate a line chart to visualize and compare the last six months of sales data for two departments. You need to increase the accessibility of the visual. What should you do? A.Replace long text with abbreviations and acronyms. B.Configure a unique marker for each series. C.Configure a distinct color for each series. D.Move important information to a tooltip. Answer : B
You are creating a Power 81 single-page report. Some users will navigate the report by using a keyboard, and some users will navigate the report by using a screen reader. You need to ensure that the users can consume content on a report page in a logical order. What should you configure on the report page? A.the bookmark order B.the X position C.the layer order D.the tab order Answer : B
You have a Power Bl workspace named Workspacel that contains five dataflows. You need to configure Workspacel to store the dataflows in an Azure Data Lake Storage Gen2 account What should you do first? A.Delete the dataflow queries. B.From the Power Bl Admin portal, enable tenant-level storage. C.Disable load for all dataflow queries. D.Change the Data source settings in the dataflow queries. Answer : D
You are using GitHub as a source control solution for an Azure Synapse Studio workspace. You need to modify the source control solution to use an Azure DevOps Git repository. What should you do first? A.Disconnect from the GitHub repository. B.Create a new pull request. C.Change the workspace to live mode. D.Change the active branch. Answer : A
You plan to modify a Power Bl dataset. You open the Impact analysis panel for the dataset and select Notify contacts. Which contacts will be notified when you use the Notify contacts feature? A.any users that accessed a report that uses the dataset within the last 30 days B.the workspace admins of any workspace that uses the dataset C.the Power Bl admins D.all the workspace members of any workspace that uses the dataset Answer : C
0 notes
Link
With the release of dataflows in Power BI, you being an intended user, may have a few queries in mind: what exactly are dataflows, how are they different from datasets, how should I take advantage of them, and more. Through this blog, I will attempt to address these queries you have and make an idea of dataflows accessible to you.
What are dataflows?
With the advancement of Power BI, you can create a collection of data called dataflow. It is an online data storage and collection tool. With its help, you can add and edit entities and brings semantic understanding and consistency to data across many sources, by mapping it to standard CDM entities.
Use of dataflows in an organization:
Main reasons to introduce dataflows:
1. It helps organizations to unify data from disparate sources and prepare it for modeling.
With the help of dataflows, organizations can directly link their data from different data sources to Power BI with just a few steps. Organizations can map their data to the Common Data Model or create their custom entities. Organizations can then use these entities as building blocks to create reports, dashboards, and apps and distribute them to users across their organization.
Further, organizations use Dataflows to transform and add value to big data by defining data source connections. With the help of a large variety of data connectors provided by Power BI and PowerApps, organizations can directly map their data from the data source.
Once you load the data in dataflow, the creation of reports and dashboards in the Power BI desktop becomes easy.
2. Self-service data prep in Power BI while dealing with large datasets:
As data volume grows, so does the need to have insights into it.
With the introduction to self-service data prep for large data in Power BI, it is now easy to have insights into any collection of data instantly. Dataflows help organizations combine data from various data sources and perform the task.
Organizations can now have their Data from multiple sources stored in Azure Data Lake Storage Gen2. Organizations can manage dataflows in workspaces by using the Power BI service. They can also map data to standard entities in the Common Data Model, which gives them the flexibility to modify data. It further helps its users work upon existing entities to customize them.
3. Different data source with a different schedule of refresh:
Dataflows play a vital role, especially when our data contain two tables with unique schedule options. Dataflows help build mechanisms that can schedule refresh according to the organization plan. Dataflows can run, extract, and load data entities in workspaces. They allow the transformation of the data process on a different schedule for every query or table.
4. An online data collection and storage tool
Collection: Dataflows use Power Query to connect to the data at the source and transform that data when needed. You can access the data through either a cloud service (such as Dynamics 365) or a PC/Network via an on-premise gateway.
Storage: Dataflows stores data in a table in the cloud so you can use it directly inside Power BI, to be more specific from Power BI Desktop.
5. Transformation of large data volume
While handling past or obsolete data, let us say a two-year-old sales record, you could come across files containing many rows or columns. Such data normally take hours to refresh. Dataflow proves to be the quicker option in such cases. You can seamlessly switch from the database to the dataflow option. You may further make use of the incremental refresh settings option in dataflow, which ensures that only updated data get refreshed.
Dataflow and Azure Data lake integration:
With the use of dataflows, users and organizations can connect data from disparate sources, and prepare it for modeling.
For using Azure Data Lake storage for dataflows, you need to have an Azure subscription and have the Data Lake Storage Gen2 Feature enabled.
After setting the Azure account, you must go to the dataflow settings tab of the Power BI admin portal wherein you must select Connect Your Azure Data Lake Storage Gen2 button. Once you do that, the system will ask you for the user credentials to initiate the Azure Data Lake. Finally, click the connect button to begin.
After the completion of this step, azure data lake storage is ready to use in Power BI.
Connect to different data sources for Power BI dataflows
With Power BI dataflows, we can connect to multiple data sources to create dataflows or add new entities to an existing dataflow.
Step1: To create the dataflow, click on the +Create menu button and select the dataflow option. You will now see several options related to entity creation. If your dataflow already exists, you can select the Add Entity or select Get Data in the dataflow authoring tool.
Step2: Now, select the data sources from the dialog box and search for the data source categories from the given options. Broadly, there are five categories from which you could choose your data: file, database, power platform, azure, and online platform.
Step 3: After successful sign in, click the next button to continue. It will open a Power Query Online where you can perform the basic editing of your data. Finally, load the model and save the dataflow.
Summary
In this blog, I have explained multiple features of dataflow to show you how it has the upper hand over datasets. However, a lot depends on the user’s choice, especially the choice of the environment which the user prefers.
There are situations in which dataflow enables you, the user, to have better control over and insight into your business data.
By using the standard data model, schema, as defined by the Common Data Model, dataflows import the user’s business data and help in reshaping and combining data across different data sources and have them ready for modeling and creation of dashboards and reports in a short period, which earlier used to take months, or years, to create.
However, there are a few constraints that restrict the use of dataflows:
· One of the primary constraints that the dataflow faces is the type of available data, namely: date/time, decimal number, text, whole number, date/time/zone, true/false, date, time, and others.
· To access Power BI dataflow, the user either needs access to the admin or the other members of the workspace wherein the dataflow resides or needs access to the workspace of contributor or viewer where the data is visible.
0 notes
Text

🔄 Mastering Dataflows (Gen2): Transform Like a Pro
Q: What are some common data transformations in Dataflows Gen2?
✅ A: Here are some of the most used transformations:
🔹 Filter and Sort rows
🔹 Pivot and Unpivot
🔹 Merge and Append queries
🔹 Split and Conditional Split
🔹 Replace values and Remove duplicates
🔹 Add, Rename, Reorder, or Delete columns
🔹 Rank and Percentage calculators
🔹 Top N and Bottom N selections
🧠 These transformations help clean, shape, and enrich your data—making your downstream reporting more effective and insightful.
💬 Which transformation do you use the most in your projects?
Drop your favorite (or most underrated) one in the comments!
#DataPlatform #LowCodeTools
#MicrosoftFabric#DataflowsGen2#PowerBI#DataTransformation#ETL#DataEngineering#FabricCommunity#DataPreparation#DataCleaning#OneLake
0 notes
Text

📊 Why are dataflows important in end-to-end analytics? Dataflows (Gen2) play a key role by helping you: ✅ Prepare consistent data ✅ Stage it in your preferred destination ✅ Reuse it across reports ✅ Easily refresh and update it
They streamline your analytics process from raw data to actionable insights!
💬 How are you using dataflows in your projects?
#PowerBI#Dataflows#DataTransformation#Analytics#MicrosoftFabric#DataPreparation#ETL#Gen2Dataflows#DataEngineering#BI#DataPipeline#TechTips#dax
0 notes