#datanormalization
Explore tagged Tumblr posts
Visit Tumblr Blog
Explore Tumblr blogs with no restrictions, modern design and the best experience.
Last Seen Tumblr Blogs


Fun Fact
The Tumblr app for Google Glass was released on May 16, 2013.
Text

Embark on the journey of data cleaning and normalization for AI models with our structured flowchart. Navigate through the steps of data preprocessing, including handling missing values, outlier detection, and feature scaling. Simplify your understanding of this crucial process for model performance enhancement. Ideal for beginners and experienced practitioners alike. Stay informed with Softlabs Group for more insights into optimizing AI models!
0 notes
Text
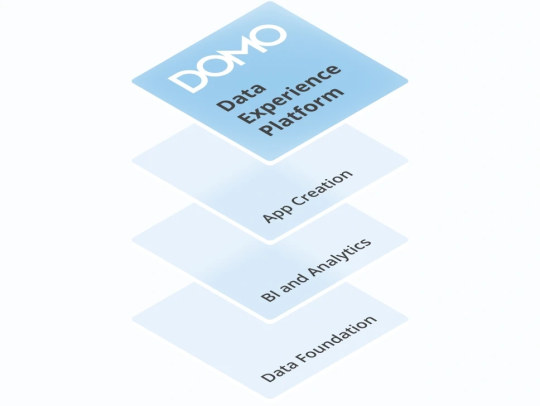
Transforming Data into Actionable Insights with Domo

In today's data-driven world, organizations face the challenge of managing vast amounts of data from various sources and deriving meaningful insights from it. Domo, a powerful cloud-based platform, has emerged as a game-changer in the realm of business intelligence and data analytics. In this blog post, we will explore the capabilities of Domo and how it enables businesses to harness the full potential of their data.
What is Domo?
Domo is a cloud-based business intelligence and data analytics platform that empowers organizations to easily connect, prepare, visualize, and analyze their data in real-time. It offers a comprehensive suite of tools and features designed to streamline data operations and facilitate data-driven decision-making.
Key Features and Benefits:
Data Integration: Domo enables seamless integration with a wide range of data sources, including databases, spreadsheets, cloud services, and more. It simplifies the process of consolidating data from disparate sources, allowing users to gain a holistic view of their organization's data.
Data Preparation: With Domo, data preparation becomes a breeze. It offers intuitive data transformation capabilities, such as data cleansing, aggregation, and enrichment, without the need for complex coding. Users can easily manipulate and shape their data to suit their analysis requirements.
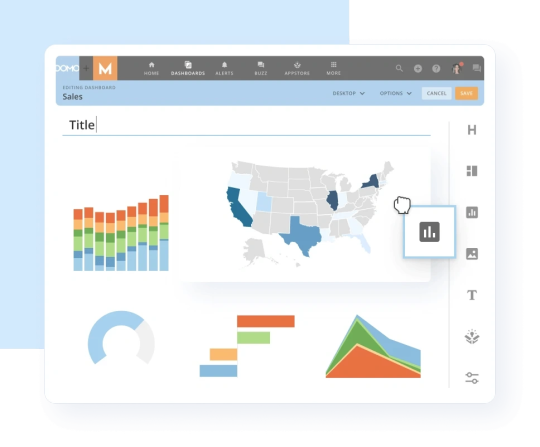
Data Visualization: Domo provides powerful visualization tools that allow users to create interactive dashboards, reports, and charts. It offers a rich library of visualization options and customization features, enabling users to present their data in a visually appealing and easily understandable manner.
Collaboration and Sharing: Domo fosters collaboration within organizations by providing a centralized platform for data sharing and collaboration. Users can share reports, dashboards, and insights with team members, fostering a data-driven culture and enabling timely decision-making across departments.
AI-Powered Insights: Domo leverages artificial intelligence and machine learning algorithms to uncover hidden patterns, trends, and anomalies in data. It provides automated insights and alerts, empowering users to proactively identify opportunities and mitigate risks.
Use Cases:
Sales and Marketing Analytics: Domo helps businesses analyze sales data, track marketing campaigns, and measure ROI. It provides real-time visibility into key sales metrics, customer segmentation, and campaign performance, enabling organizations to optimize their sales and marketing strategies.
Operations and Supply Chain Management: Domo enables organizations to gain actionable insights into their operations and supply chain. It helps identify bottlenecks, monitor inventory levels, track production metrics, and streamline processes for improved efficiency and cost savings.
Financial Analysis: Domo facilitates financial reporting and analysis by integrating data from various financial systems. It allows CFOs and finance teams to monitor key financial metrics, track budget vs. actuals, and perform advanced financial modeling to drive strategic decision-making.
Human Resources Analytics: Domo can be leveraged to analyze HR data, including employee performance, retention, and engagement. It provides HR professionals with valuable insights for talent management, workforce planning, and improving overall employee satisfaction.
Success Stories: Several organizations have witnessed significant benefits from adopting Domo. For example, a global retail chain utilized Domo to consolidate and analyze data from multiple stores, resulting in improved inventory management and optimized product placement. A technology startup leveraged Domo to analyze customer behavior and enhance its product offerings, leading to increased customer satisfaction and higher revenue.
Domo offers a powerful and user-friendly platform for organizations to unlock the full potential of their data. By providing seamless data integration, robust analytics capabilities, and collaboration features, Domo empowers businesses to make data-driven decisions and gain a competitive edge in today's fast-paced business landscape. Whether it's sales, marketing, operations, finance, or HR, Domo can revolutionize the way organizations leverage data to drive growth and innovation.
#DataCleaning#DataNormalization#DataIntegration#DataWrangling#DataReshaping#DataAggregation#DataPivoting#DataJoining#DataSplitting#DataFormatting#DataMapping#DataConversion#DataFiltering#DataSampling#DataImputation#DataScaling#DataEncoding#DataDeduplication#DataRestructuring#DataReformatting
0 notes
Text
📚✨ Just revisited this gem! Dive into "The Great Data Cleanup: A Database Design Adventure" and discover how I turned digital chaos into streamlined success. Perfect for anyone tackling sluggish apps and tangled databases. 🚀🔧
The Great Data Cleanup: A Database Design Adventure
As a budding database engineer, I found myself in a situation that was both daunting and hilarious. Our company's application was running slower than a turtle in peanut butter, and no one could figure out why. That is, until I decided to take a closer look at the database design.
It all began when my boss, a stern woman with a penchant for dramatic entrances, stormed into my cubicle. "Listen up, rookie," she barked (despite the fact that I was quite experienced by this point). "The marketing team is in an uproar over the app's performance. Think you can sort this mess out?"
Challenge accepted! I cracked my knuckles, took a deep breath, and dove headfirst into the database, ready to untangle the digital spaghetti.
The schema was a sight to behold—if you were a fan of chaos, that is. Tables were crammed with redundant data, and the relationships between them made as much sense as a platypus in a tuxedo.
"Okay," I told myself, "time to unleash the power of database normalization."
First, I identified the main entities—clients, transactions, products, and so forth. Then, I dissected each entity into its basic components, ruthlessly eliminating any unnecessary duplication.
For example, the original "clients" table was a hot mess. It had fields for the client's name, address, phone number, and email, but it also inexplicably included fields for the account manager's name and contact information. Data redundancy alert!
So, I created a new "account_managers" table to store all that information, and linked the clients back to their account managers using a foreign key. Boom! Normalized.
Next, I tackled the transactions table. It was a jumble of product details, shipping info, and payment data. I split it into three distinct tables—one for the transaction header, one for the line items, and one for the shipping and payment details.
"This is starting to look promising," I thought, giving myself an imaginary high-five.
After several more rounds of table splitting and relationship building, the database was looking sleek, streamlined, and ready for action. I couldn't wait to see the results.
Sure enough, the next day, when the marketing team tested the app, it was like night and day. The pages loaded in a flash, and the users were practically singing my praises (okay, maybe not singing, but definitely less cranky).
My boss, who was not one for effusive praise, gave me a rare smile and said, "Good job, rookie. I knew you had it in you."
From that day forward, I became the go-to person for all things database-related. And you know what? I actually enjoyed the challenge. It's like solving a complex puzzle, but with a lot more coffee and SQL.
So, if you ever find yourself dealing with a sluggish app and a tangled database, don't panic. Grab a strong cup of coffee, roll up your sleeves, and dive into the normalization process. Trust me, your users (and your boss) will be eternally grateful.
Step-by-Step Guide to Database Normalization
Here's the step-by-step process I used to normalize the database and resolve the performance issues. I used an online database design tool to visualize this design. Here's what I did:
Original Clients Table:
ClientID int
ClientName varchar
ClientAddress varchar
ClientPhone varchar
ClientEmail varchar
AccountManagerName varchar
AccountManagerPhone varchar
Step 1: Separate the Account Managers information into a new table:
AccountManagers Table:
AccountManagerID int
AccountManagerName varchar
AccountManagerPhone varchar
Updated Clients Table:
ClientID int
ClientName varchar
ClientAddress varchar
ClientPhone varchar
ClientEmail varchar
AccountManagerID int
Step 2: Separate the Transactions information into a new table:
Transactions Table:
TransactionID int
ClientID int
TransactionDate date
ShippingAddress varchar
ShippingPhone varchar
PaymentMethod varchar
PaymentDetails varchar
Step 3: Separate the Transaction Line Items into a new table:
TransactionLineItems Table:
LineItemID int
TransactionID int
ProductID int
Quantity int
UnitPrice decimal
Step 4: Create a separate table for Products:
Products Table:
ProductID int
ProductName varchar
ProductDescription varchar
UnitPrice decimal
After these normalization steps, the database structure was much cleaner and more efficient. Here's how the relationships between the tables would look:
Clients --< Transactions >-- TransactionLineItems
Clients --< AccountManagers
Transactions --< Products
By separating the data into these normalized tables, we eliminated data redundancy, improved data integrity, and made the database more scalable. The application's performance should now be significantly faster, as the database can efficiently retrieve and process the data it needs.
Conclusion
After a whirlwind week of wrestling with spreadsheets and SQL queries, the database normalization project was complete. I leaned back, took a deep breath, and admired my work.
The previously chaotic mess of data had been transformed into a sleek, efficient database structure. Redundant information was a thing of the past, and the performance was snappy.
I couldn't wait to show my boss the results. As I walked into her office, she looked up with a hopeful glint in her eye.
"Well, rookie," she began, "any progress on that database issue?"
I grinned. "Absolutely. Let me show you."
I pulled up the new database schema on her screen, walking her through each step of the normalization process. Her eyes widened with every explanation.
"Incredible! I never realized database design could be so... detailed," she exclaimed.
When I finished, she leaned back, a satisfied smile spreading across her face.
"Fantastic job, rookie. I knew you were the right person for this." She paused, then added, "I think this calls for a celebratory lunch. My treat. What do you say?"
I didn't need to be asked twice. As we headed out, a wave of pride and accomplishment washed over me. It had been hard work, but the payoff was worth it. Not only had I solved a critical issue for the business, but I'd also cemented my reputation as the go-to database guru.
From that day on, whenever performance issues or data management challenges cropped up, my boss would come knocking. And you know what? I didn't mind one bit. It was the perfect opportunity to flex my normalization muscles and keep that database running smoothly.
So, if you ever find yourself in a similar situation—a sluggish app, a tangled database, and a boss breathing down your neck—remember: normalization is your ally. Embrace the challenge, dive into the data, and watch your application transform into a lean, mean, performance-boosting machine.
And don't forget to ask your boss out for lunch. You've earned it!
8 notes
·
View notes
Text

Struggling with ER Modeling or Normalizing Data for your assignment? Let me help you ace it! Get expert guidance and clear explanations for DATA4200 Data Acquisition and Management subject. DM us for details.
#ERModeling #DatabaseDesign #DataNormalization #AssignmentHelp #DBMS #DATA4200 #DataAcquisition #Management #ERModeling #NormalizingData #KaplanUniversity #KBS #Australia
0 notes
Photo

Fourier transform package is highly efficient for analyzing, maintaining, and managing a large databases. Check our Info : www.incegna.com Reg Link for Programs : http://www.incegna.com/contact-us Follow us on Facebook : www.facebook.com/INCEGNA/? Follow us on Instagram : https://www.instagram.com/_incegna/ For Queries : [email protected] #deeplearning,#fouriertransformation,#specialtportrayal,#databases,#datascience,#datascientists,#costfunction,#neuralnetworks,#gradientdescent,#backpropagation,#datanormalization https://www.instagram.com/p/B-ZJH4XAbmT/?igshid=1ve79hloe8pel
#deeplearning#fouriertransformation#specialtportrayal#databases#datascience#datascientists#costfunction#neuralnetworks#gradientdescent#backpropagation#datanormalization
0 notes
Photo

Our data normalization services enable you to protect and maintain the integrity of your confidential data against any structural or logical inconsistencies. Opting for data normalization enhances the data stability while making sure that there is no certain risk to your information, this result in saved See https://www.ibcconnect.com/data-normalization/
0 notes
Link
Standards in Assessment Use Test Construction, Evaluation, and Documentation Fairness in TestingTesting Applications ReliabilityEnglish Language LearnersAppropriate Diagnosis ValidityCultural IssuesUsed as intended Item AnalysisUse Multiple Data SourcesReasonable Interpretation Manual and Research DataNormative DataDSM-IV, IDEA, Texts
2 notes
·
View notes
Link
Lanota Hack 2.0.7 (MOD,Unlock) Apk + Data Mod - An awesome and awesome musical arcade game with Android dataNormal version + Module version
0 notes
Text
What techniques can be used to handle missing values in datasets effectively?
Handling missing values in datasets is an important step in data cleaning and preprocessing. Here are some commonly used techniques to handle missing values effectively:

Deletion: In some cases, if the missing values are relatively few or randomly distributed, you may choose to delete the rows or columns containing missing values. However, be cautious as this approach may lead to the loss of valuable information.
Mean/Median/Mode Imputation: For numerical variables, missing values can be replaced with the mean, median, or mode of the available data. This approach assumes that the missing values are similar to the observed values in the variable.
Regression Imputation: Regression imputation involves predicting missing values using regression models. A regression model is built using other variables as predictors, and the missing values are estimated based on the relationship with the predictors.
Multiple Imputation: Multiple imputations generates multiple plausible values for missing data based on the observed data and their relationships. This approach accounts for the uncertainty associated with missing values and allows for more robust statistical analysis.
Hot-Deck Imputation: Hot-deck imputation involves filling missing values with values from similar records or observations. This can be done by matching records based on some similarity criteria or using nearest neighbors.
K-Nearest Neighbors (KNN) Imputation: KNN imputation replaces missing values with values from the k-nearest neighbors in the dataset. The similarity between records is measured based on variables that have complete data.
Categorical Imputation: For categorical variables, missing values can be treated as a separate category or imputed using the mode (most frequent category) of the available data.
Time-Series Techniques: If dealing with time-series data, missing values can be imputed using techniques like interpolation or forward/backward filling, where missing values are replaced with values from adjacent time points.
Domain Knowledge Imputation: Depending on the context and domain knowledge, missing values can be imputed using expert judgment or external data sources. This approach requires careful consideration and validation.
Model-Based Imputation: Model-based imputation involves building a predictive model using variables with complete data and using that model to impute missing values. This can include techniques such as decision trees, random forests, or Bayesian methods.

When handling missing values, it's essential to understand the nature of the missingness, assess the potential impact on the analysis, and choose an appropriate technique that aligns with the characteristics of the data and the research objectives. Additionally, it's crucial to be aware of potential biases introduced by the imputation method and to document the imputation steps taken for transparency and reproducibility.
#DataCleaning#DataScrubbing#DataCleansing#DataQuality#DataPreparation#DataValidation#DataIntegrity#DataSanitization#DataStandardization#DataNormalization#DataHygiene#DataAccuracy#DataVerification#CleanData#TidyData
0 notes
Photo

Recurrent Networks are a type of artificial neural network designed to recognize patterns in sequences of data, such as text, genomes, handwriting, the spoken word, numerical times series data. Check our Info : www.incegna.com Reg Link for Programs : http://www.incegna.com/contact-us Follow us on Facebook : www.facebook.com/INCEGNA/? Follow us on Instagram : https://www.instagram.com/_incegna/ For Queries : [email protected] #recurrentneuralnetwork,#artificialneuralnetwork,#cnn,#artificialintelligence,#deepelarning,#LSTM,#GradientDescent,#Tensors,#RNN,#PyTorch,#MXNet,#Keras,#CNTK,#Caffe,#neuralnetworks,#deepnetowrks,#datanormalization,#MLP,#python https://www.instagram.com/p/B-Ot9AJA_mS/?igshid=1951fep6ojcpj
#recurrentneuralnetwork#artificialneuralnetwork#cnn#artificialintelligence#deepelarning#lstm#gradientdescent#tensors#rnn#pytorch#mxnet#keras#cntk#caffe#neuralnetworks#deepnetowrks#datanormalization#mlp#python
0 notes
Photo

The softmax function is used to calculate the probability distribution of the event over 'n' different events. One of the main advantages of using softmax is the output probabilities range. Check our Info : www.incegna.com Reg Link for Programs : http://www.incegna.com/contact-us Follow us on Facebook : www.facebook.com/INCEGNA/? Follow us on Instagram : https://www.instagram.com/_incegna/ For Queries : [email protected] #softmax,#deeplearning,#neuralnetwoks,#artificiaineuralnetworks,#Swishfunction,#ReLUfunction,#Tanhfunction,#sigmoidfuntion,#Boltzmannmachine,#cnn,#rnn,#machinelearning,#pythonprogramming,#datanormalization https://www.instagram.com/p/B-Gzf_JgTRf/?igshid=9e5igfivl992
#softmax#deeplearning#neuralnetwoks#artificiaineuralnetworks#swishfunction#relufunction#tanhfunction#sigmoidfuntion#boltzmannmachine#cnn#rnn#machinelearning#pythonprogramming#datanormalization
0 notes
Link
Interior Story Hack 1.2.7 (MOD,Unlimited Money) Apk + Mod - Android Puzzle Story Game with DataNormal version + Mod version (infinite money)
0 notes
Link
Lanota Hack 2.0.6 (MOD,Unlock) Apk + Data Mod - An awesome and awesome musical arcade game with Android dataNormal version + Module version
0 notes
Link
JDM racing Hack 1.2.0 (MOD,Unlimited Money) Apk+Data + Mod - jDM racing game with Android DataNormal version + Mod version (infinite money)
0 notes
Link
Iron Throne Hack 4.2.1 (MOD,Unlocked) Apk + Mod – Android Road Data Management Game with DataNormal version + Mod version (Paid/unlocked)
0 notes