#DataWrangling
Explore tagged Tumblr posts
Visit Tumblr Blog
Explore Tumblr blogs with no restrictions, modern design and the best experience.
Last Seen Tumblr Blogs


Fun Fact
Tumblr has been providing a Korean-language service since 2013.
Text
Data wrangling transforms raw data into actionable insights—essential for AI and analytics. Mastering it ensures data quality, compliance, and strategic value.
0 notes
Text
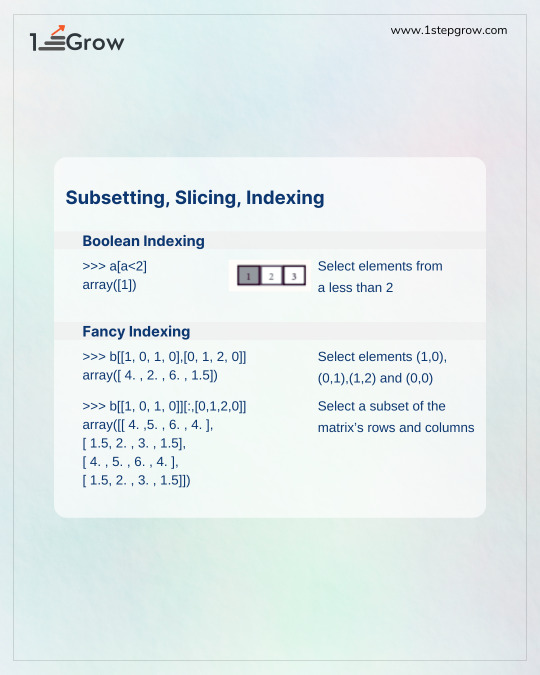
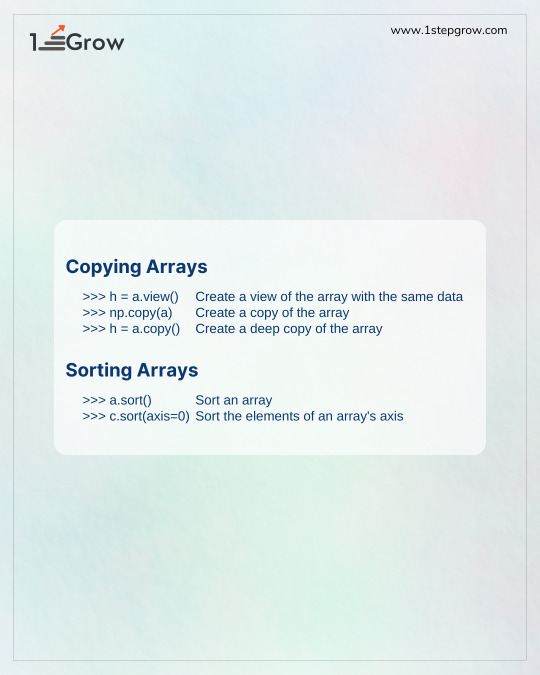
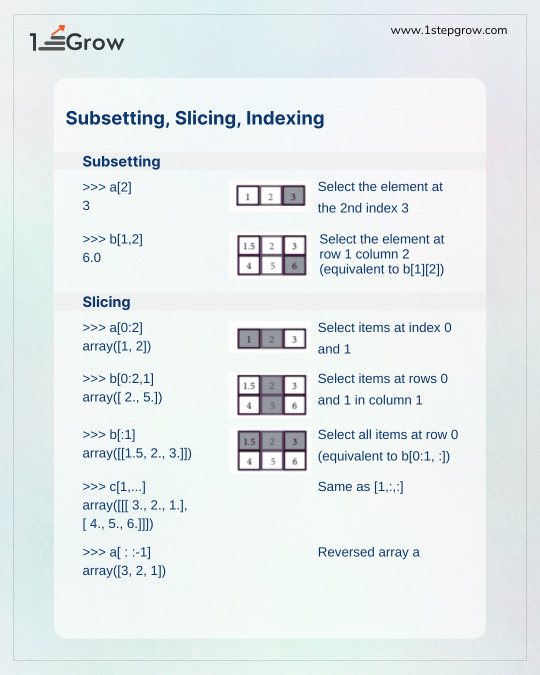

🚀 Elevate your Python skills: Easy manipulation of NumPy Arrays NumPy arrays themselves are made specifically for easily manipulating data via high-powered functions. Talking big data or building workload optimizations with fewer resources, then chances are, you really need to absorb these.
With NumPy, you can:🔄 Transpose arrays giving you the ability to switch dimensions immediately. 📐 Reshape and resize arrays to suit your desired analysis. 🔗 Merging arrays with the help of concatenate, vstack, and hstack. ✂ Splitting arrays into specific parts with hsplit and vsplit commands. ➕➖ Adding and deleting elements with the append and delete commands, respectively. 🔍 Uses a function such as ravel to flatten arrays into a single dimension.
💡 Pro Tip: Doing this in just one or two lines of code can turn complex data structures into data ready for insights!
✅ Which Numpy function do you find the most powerful? Let us know in the comments!
📈 Follow @1stepgrow to dive deeper into Python’s Numpy library and become a data science pro. 🌟
python for data science
#1stepGrow#NumpyBasics#ArrayManipulation#PythonForDataScience#DataScienceSkills#DataWrangling#1stepGrowAcademy
0 notes
Text
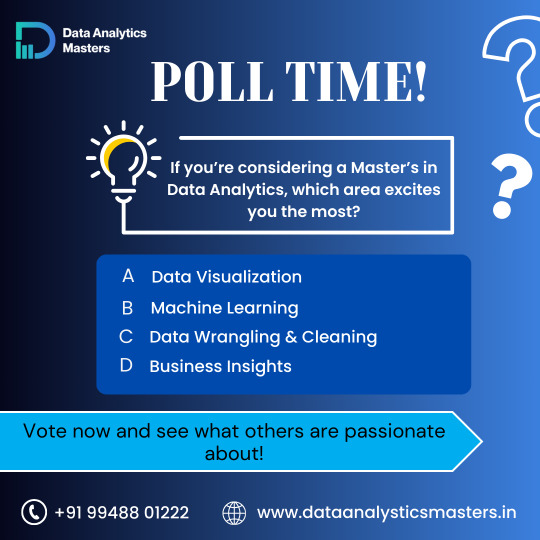
🌟 POLL ALERT! 🌟
Hey Data Enthusiasts! 💻📊
If you're considering a Master's in Data Analytics, we’d love to know what sparks your curiosity the most! 🤔✨
👉 A. Data Visualization 👉 B. Machine Learning 👉 C. Data Wrangling & Cleaning 👉 D. Business Insights
📢 Vote now and discover what areas others are most passionate about in the world of analytics! Let's see where your interest aligns with the trends! 🌐
📞 Call us at: +91 99488 01222 🌍 Learn more at: www.dataanalyticsmasters.in
💬 Don’t forget to share your thoughts in the comments below! 👇
#DataAnalyticsMasters#PollTime#DataVisualization#MachineLearning#DataWrangling#BusinessInsights#Hyderabad#MasterTheFuture
0 notes
Text
#machinelearning#featureengineering#python#datascience#featureselection#datawrangling#AI#dataanalysis#modelbuilding
0 notes
Text
KNIME Analytics Platform

KNIME Analytics Platform: Open-Source Data Science and Machine Learning for All In the world of data science and machine learning, KNIME Analytics Platform stands out as a powerful and versatile solution that is accessible to both technical and non-technical users alike. Known for its open-source foundation, KNIME provides a flexible, visual workflow interface that enables users to create, deploy, and manage data science projects with ease. Whether used by individual data scientists or entire enterprise teams, KNIME supports the full data science lifecycle—from data integration and transformation to machine learning and deployment. Empowering Data Science with a Visual Workflow Interface At the heart of KNIME’s appeal is its drag-and-drop interface, which allows users to design workflows without needing to code. This visual approach democratizes data science, allowing business analysts, data scientists, and engineers to collaborate seamlessly and create powerful analytics workflows. KNIME’s modular architecture also enables users to expand its functionality through a vast library of nodes, extensions, and community-contributed components, making it one of the most flexible platforms for data science and machine learning. Key Features of KNIME Analytics Platform KNIME’s comprehensive feature set addresses a wide range of data science needs: - Data Preparation and ETL: KNIME provides robust tools for data integration, cleansing, and transformation, supporting everything from structured to unstructured data sources. The platform’s ETL (Extract, Transform, Load) capabilities are highly customizable, making it easy to prepare data for analysis. - Machine Learning and AutoML: KNIME comes with a suite of built-in machine learning algorithms, allowing users to build models directly within the platform. It also offers Automated Machine Learning (AutoML) capabilities, simplifying tasks like model selection and hyperparameter tuning, so users can rapidly develop effective machine learning models. - Explainable AI (XAI): With the growing importance of model transparency, KNIME provides tools for explainability and interpretability, such as feature impact analysis and interactive visualizations. These tools enable users to understand how models make predictions, fostering trust and facilitating decision-making in regulated industries. - Integration with External Tools and Libraries: KNIME supports integration with popular machine learning libraries and tools, including TensorFlow, H2O.ai, Scikit-learn, and Python and R scripts. This compatibility allows advanced users to leverage KNIME’s workflow environment alongside powerful external libraries, expanding the platform’s modeling and analytical capabilities. - Big Data and Cloud Extensions: KNIME offers extensions for big data processing, supporting frameworks like Apache Spark and Hadoop. Additionally, KNIME integrates with cloud providers, including AWS, Google Cloud, and Microsoft Azure, making it suitable for organizations with cloud-based data architectures. - Model Deployment and Management with KNIME Server: For enterprise users, KNIME Server provides enhanced capabilities for model deployment, automation, and monitoring. KNIME Server enables teams to deploy models to production environments with ease and facilitates collaboration by allowing multiple users to work on projects concurrently. Diverse Applications Across Industries KNIME Analytics Platform is utilized across various industries for a wide range of applications: - Customer Analytics and Marketing: KNIME enables businesses to perform customer segmentation, sentiment analysis, and predictive marketing, helping companies deliver personalized experiences and optimize marketing strategies. - Financial Services: In finance, KNIME is used for fraud detection, credit scoring, and risk assessment, where accurate predictions and data integrity are essential. - Healthcare and Life Sciences: KNIME supports healthcare providers and researchers with applications such as outcome prediction, resource optimization, and patient data analytics. - Manufacturing and IoT: The platform’s capabilities in anomaly detection and predictive maintenance make it ideal for manufacturing and IoT applications, where data-driven insights are key to operational efficiency. Deployment Flexibility and Integration Capabilities KNIME’s flexibility extends to its deployment options. KNIME Analytics Platform is available as a free, open-source desktop application, while KNIME Server provides enterprise-level features for deployment, collaboration, and automation. The platform’s support for Docker containers also enables organizations to deploy models in various environments, including hybrid and cloud setups. Additionally, KNIME integrates seamlessly with databases, data lakes, business intelligence tools, and external libraries, allowing it to function as a core component of a company’s data architecture. Pricing and Community Support KNIME offers both free and commercial licensing options. The open-source KNIME Analytics Platform is free to use, making it an attractive option for data science teams looking to minimize costs while maximizing capabilities. For organizations that require advanced deployment, monitoring, and collaboration, KNIME Server is available through a subscription-based model. The KNIME community is an integral part of the platform’s success. With an active forum, numerous tutorials, and a repository of workflows on KNIME Hub, users can find solutions to common challenges, share their work, and build on contributions from other users. Additionally, KNIME offers dedicated support and learning resources through KNIME Learning Hub and KNIME Academy, ensuring users have access to continuous training. Conclusion KNIME Analytics Platform is a robust, flexible, and accessible data science tool that empowers users to design, deploy, and manage data workflows without the need for extensive coding. From data preparation and machine learning to deployment and interpretability, KNIME’s extensive capabilities make it a valuable asset for organizations across industries. With its open-source foundation, active community, and enterprise-ready features, KNIME provides a scalable solution for data-driven decision-making and a compelling option for any organization looking to integrate data science into their operations. Read the full article
#AutomatedMachineLearning#AutoML#dataintegration#datapreparation#datascienceplatform#datatransformation#datawrangling#ETL#KNIME#KNIMEAnalyticsPlatform#machinelearning#open-sourceAI
0 notes
Text
Using R and Python for Data Analysis
Overview of R and Python
R and Python are two of the most popular programming languages for data analysis, each with its unique strengths and capabilities. Both languages have extensive libraries and frameworks that support a wide range of data analysis tasks, from simple statistical operations to complex machine learning models.
R
R is a language and environment specifically designed for statistical computing and graphics. Developed by statisticians, it has a rich set of tools for data analysis, making it particularly popular in academia and among statisticians. R provides a wide variety of statistical and graphical techniques, including linear and nonlinear modeling, classical statistical tests, time-series analysis, classification, clustering, and more.
Python
Python, on the other hand, is a general-purpose programming language known for its simplicity and readability. It has become extremely popular in the data science community due to its versatility and the extensive ecosystem of libraries such as Pandas, NumPy, SciPy, and scikit-learn. Python's simplicity and the power of its libraries make it suitable for both beginners and experienced data scientists.
🌟 Join EXCELR: Your Gateway to a Successful Data Analysis Career! 🌟
Are you a recent graduate or looking to make a career change? EXCELR's Data Analyst Course in Bhopal is designed just for you! Dive into the world of data analysis with our comprehensive curriculum, expert instructors, and hands-on learning experiences. Whether you're starting fresh or transitioning into a new field, EXCELR provides the tools and support you need to succeed.
🚀 Why Choose EXCELR?
Industry-Relevant Curriculum: Stay ahead with the latest trends and techniques in data analysis.
Expert Instructors: Learn from seasoned professionals with real-world experience.
Hands-On Projects: Apply your knowledge through practical projects and case studies.
Career Support: Benefit from our dedicated career services to land your dream job.
Don't miss out on the opportunity to transform your career! Enroll in EXCELR's Data Analyst Course in Bhopal today and step into the future of data analysis.
👉 Apply Now and take the first step towards a brighter future with EXCELR!
Key Features and Capabilities
R
Statistical Analysis: R is built for statistics, making it easy to perform a wide range of statistical analyses.
Data Visualization: R has powerful tools for data visualization, such as ggplot2 and lattice.
Comprehensive Package Ecosystem: CRAN (Comprehensive R Archive Network) hosts thousands of packages for various statistical and graphical applications.
Reproducible Research: Tools like RMarkdown and Sweave allow for seamless integration of code and documentation.
Python
Versatility: Python is a general-purpose language, making it useful for a wide range of applications beyond data analysis.
Extensive Libraries: Libraries like Pandas for data manipulation, NumPy for numerical operations, Matplotlib and Seaborn for visualization, and scikit-learn for machine learning make Python a powerful tool for data science.
Integration: Python integrates well with other languages and technologies, such as SQL, Hadoop, and Spark.
Community Support: Python has a large and active community, providing extensive resources, tutorials, and forums for troubleshooting.
Applications and Use Cases
R
Academia and Research: R's strong statistical capabilities make it a favorite among researchers and academics for conducting complex statistical analyses.
Bioinformatics: R is widely used in the field of bioinformatics for tasks such as sequence analysis and genomics.
Financial Analysis: R is employed in finance for risk management, portfolio optimization, and quantitative analysis.
Python
Data Wrangling and Cleaning: Python’s Pandas library is excellent for data manipulation and cleaning tasks.
Machine Learning: Python, with libraries like scikit-learn, TensorFlow, and PyTorch, is widely used in machine learning and artificial intelligence.
Web Scraping: Python’s BeautifulSoup and Scrapy libraries make web scraping and data extraction straightforward.
Automation: Python is used for automating data workflows and integrating various data sources and systems.
Tips and Best Practices
R
Leverage RMarkdown: Use RMarkdown for creating dynamic and reproducible reports that combine code, output, and narrative text.
Master ggplot2: Invest time in learning ggplot2 for creating high-quality and customizable data visualizations.
Use Dplyr for Data Manipulation: Familiarize yourself with the dplyr package for efficient data manipulation and transformation.
Python
Utilize Virtual Environments: Use virtual environments to manage dependencies and avoid conflicts between different projects.
Learn Vectorization: Take advantage of vectorized operations in NumPy and Pandas for faster and more efficient data processing.
Write Readable Code: Follow Python’s PEP 8 style guide to write clean and readable code, making it easier for collaboration and maintenance.
Conclusion
Both R and Python have their unique strengths and are powerful tools for data analysis. R shines in statistical analysis and visualization, making it a preferred choice for researchers and statisticians. Python's versatility and extensive libraries make it suitable for a wide range of data science tasks, from data wrangling to machine learning. By understanding the key features, applications, and best practices of each language, data professionals can choose the right tool for their specific needs and enhance their data analysis capabilities.
4o
#DataAnalysis#DataScience#Python#RLanguage#DataVisualization#MachineLearning#Statistics#Programming#DataWrangling#Bioinformatics#FinancialAnalysis#BigData#Analytics#TechBlog#DataScienceCommunity#DataScienceTools#DataAnalytics#DataScienceTips#Coding#DataTech#AI#ML#DataScienceLife
1 note
·
View note
Text
10 Essential Skills You’ll Learn in a Data Analytics Course
In a data analytics course, you'll acquire vital skills like data visualization, statistical analysis, machine learning, and programming, essential for interpreting and deriving insights from complex datasets. Additionally, you'll learn database querying, data wrangling, and storytelling with data, empowering you to excel in the dynamic field of data analytics.
visit for more information:
#DataAnalyticsSkills#DataAnalysis#DataVisualization#StatisticalAnalysis#MachineLearning#Programming#DatabaseQuerying#DataWrangling#StorytellingWithData#DataScience
1 note
·
View note
Text
Data Analysis Made Easier with Chat GPT | Advanced Tips and Tricks | ai data analyst
youtube
In this video, They're diving deep into the world of data analysis with the help of ChatGPT! 📊💻 Discover advanced tips and tricks that will make your life as an AI data analyst so much easier. From data wrangling to machine learning insights, They've got you covered. Don't miss out on this invaluable resource for data enthusiasts!
#DataAnalysis#AdvancedTips#DataAnalytics#AI#DataScience#MachineLearning#ChatGPT#DataWrangling#DataInsights#DataVisualization#Youtube
0 notes
Text
0 notes
Text
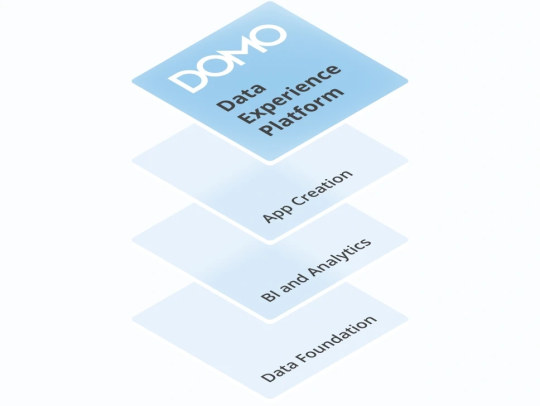
Transforming Data into Actionable Insights with Domo

In today's data-driven world, organizations face the challenge of managing vast amounts of data from various sources and deriving meaningful insights from it. Domo, a powerful cloud-based platform, has emerged as a game-changer in the realm of business intelligence and data analytics. In this blog post, we will explore the capabilities of Domo and how it enables businesses to harness the full potential of their data.
What is Domo?
Domo is a cloud-based business intelligence and data analytics platform that empowers organizations to easily connect, prepare, visualize, and analyze their data in real-time. It offers a comprehensive suite of tools and features designed to streamline data operations and facilitate data-driven decision-making.
Key Features and Benefits:
Data Integration: Domo enables seamless integration with a wide range of data sources, including databases, spreadsheets, cloud services, and more. It simplifies the process of consolidating data from disparate sources, allowing users to gain a holistic view of their organization's data.
Data Preparation: With Domo, data preparation becomes a breeze. It offers intuitive data transformation capabilities, such as data cleansing, aggregation, and enrichment, without the need for complex coding. Users can easily manipulate and shape their data to suit their analysis requirements.
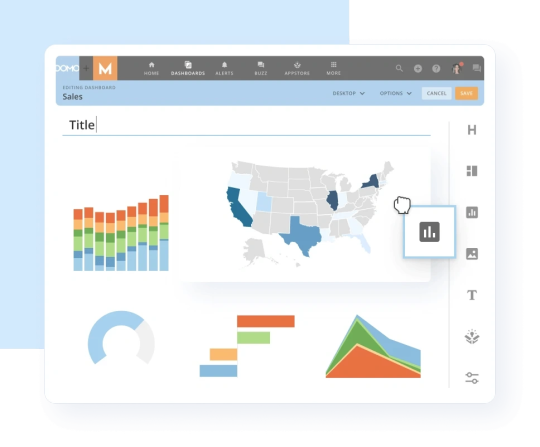
Data Visualization: Domo provides powerful visualization tools that allow users to create interactive dashboards, reports, and charts. It offers a rich library of visualization options and customization features, enabling users to present their data in a visually appealing and easily understandable manner.
Collaboration and Sharing: Domo fosters collaboration within organizations by providing a centralized platform for data sharing and collaboration. Users can share reports, dashboards, and insights with team members, fostering a data-driven culture and enabling timely decision-making across departments.
AI-Powered Insights: Domo leverages artificial intelligence and machine learning algorithms to uncover hidden patterns, trends, and anomalies in data. It provides automated insights and alerts, empowering users to proactively identify opportunities and mitigate risks.
Use Cases:
Sales and Marketing Analytics: Domo helps businesses analyze sales data, track marketing campaigns, and measure ROI. It provides real-time visibility into key sales metrics, customer segmentation, and campaign performance, enabling organizations to optimize their sales and marketing strategies.
Operations and Supply Chain Management: Domo enables organizations to gain actionable insights into their operations and supply chain. It helps identify bottlenecks, monitor inventory levels, track production metrics, and streamline processes for improved efficiency and cost savings.
Financial Analysis: Domo facilitates financial reporting and analysis by integrating data from various financial systems. It allows CFOs and finance teams to monitor key financial metrics, track budget vs. actuals, and perform advanced financial modeling to drive strategic decision-making.
Human Resources Analytics: Domo can be leveraged to analyze HR data, including employee performance, retention, and engagement. It provides HR professionals with valuable insights for talent management, workforce planning, and improving overall employee satisfaction.
Success Stories: Several organizations have witnessed significant benefits from adopting Domo. For example, a global retail chain utilized Domo to consolidate and analyze data from multiple stores, resulting in improved inventory management and optimized product placement. A technology startup leveraged Domo to analyze customer behavior and enhance its product offerings, leading to increased customer satisfaction and higher revenue.
Domo offers a powerful and user-friendly platform for organizations to unlock the full potential of their data. By providing seamless data integration, robust analytics capabilities, and collaboration features, Domo empowers businesses to make data-driven decisions and gain a competitive edge in today's fast-paced business landscape. Whether it's sales, marketing, operations, finance, or HR, Domo can revolutionize the way organizations leverage data to drive growth and innovation.
#DataCleaning#DataNormalization#DataIntegration#DataWrangling#DataReshaping#DataAggregation#DataPivoting#DataJoining#DataSplitting#DataFormatting#DataMapping#DataConversion#DataFiltering#DataSampling#DataImputation#DataScaling#DataEncoding#DataDeduplication#DataRestructuring#DataReformatting
0 notes
Text
iv done nothing but sort sims 4 mods the last few days, wish there was a job where the only thing i had to do was sort stuff into catogories i would be SO GOOD AT IT
#shout out to a couple of years ago when i got my bookshare subscription#and then proceded to spend a whole month going through all the books tagged as art#and creating 30 different lists of art books#it took so long but now if i wanna read up about watercolor or embroidery or character design i can just go and look thru my lists#born to be a datawrangler
0 notes
Text
Data Wrangling Là Gì? Vai Trò Quan Trọng Trong Xử Lý Dữ Liệu
Data Wrangling Là Gì? Vai Trò Quan Trọng Trong Xử Lý Dữ Liệu #datawrangling #xửlýdữliệu #dữliệusạch #khoahocdữliệu #bigdata #dữliệulớn #trítuệnhân_tạo #machinelearning Data wrangling, hay còn gọi là chuẩn bị dữ liệu, là một quá trình quan trọng trong phân tích dữ liệu và khoa học dữ liệu. Nó bao gồm việc thu thập, làm sạch, biến đổi, và chuẩn hóa dữ liệu thô để biến nó thành một tập dữ liệu có…
0 notes
Text
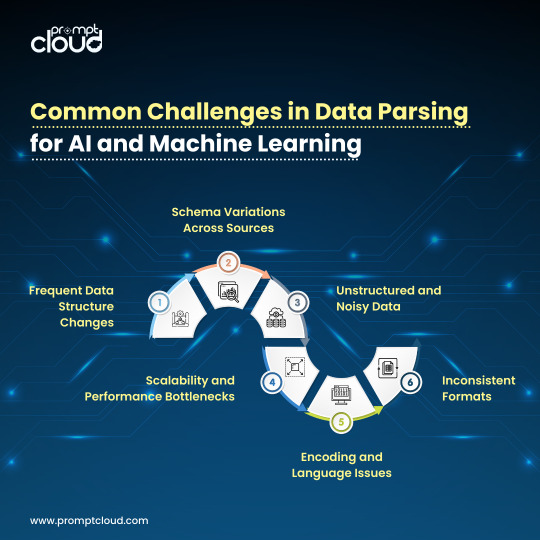
Structured data drives AI. But messy inputs? They stall everything. We’ve listed six parsing issues you should be watching for. 👉 Read the blog to know more: https://shorturl.at/3wRyG
#AIanalytics #MLengineering #DataWrangling #ParsingProblems #TechStrategy #BigData
0 notes
Text

📊 Did You Know? 🤔 Data scientists spend 80% of their time fixing and organizing data, while only 20% is spent on analyzing and building models! 🧐📈
Master the art of data wrangling and take your data science skills to the next level! 🚀
🔗 Learn more: www.datascienceschool.in 📞 Contact us: +91 9948861888
#DataScience #AI #MachineLearning #BigData #DataWrangling #TechFacts
#datascience#machinelearning#datascienceschool#ai#python#data scientist#learndatascience#bigdata#data#database
0 notes
Text
Matchmaking - Data Wrangler and SQL Server
Enough with the CSV and Parquet files already ! What about dataframes and #SQLServer ?!? #DataWrangler
Back in April 2024 (or possibly earlier), there was a new extension released for Visual Studio Code (VSCode) – Data Wrangler, and it might just change your life. OK, so that’s a bit over the top, but have a glance at the documentation, and it’ll be quickly apparent that it is an EXCELLENT addition to your data engineering toolkit. The examples online that I’ve seen mostly center around opening…

View On WordPress
0 notes
Text
Data Analytics Tools: A Comprehensive Overview

Data analytics has become an integral part of decision-making processes in various industries. To effectively analyze and derive insights from data, businesses and professionals rely on a plethora of tools and software. In this comprehensive overview, we'll explore some of the most popular data analytics tools available today, categorizing them into different types based on their primary functions.
1. Data Collection and Integration:
a. Apache Nifi: An open-source data integration tool for collecting, transforming, and distributing data from various sources.
b. Talend: An integration tool that allows you to connect, access, and manage data from different sources.
c. Zapier: A workflow automation tool that connects various apps to automate data collection and transfer.
2. Data Cleaning and Preprocessing:
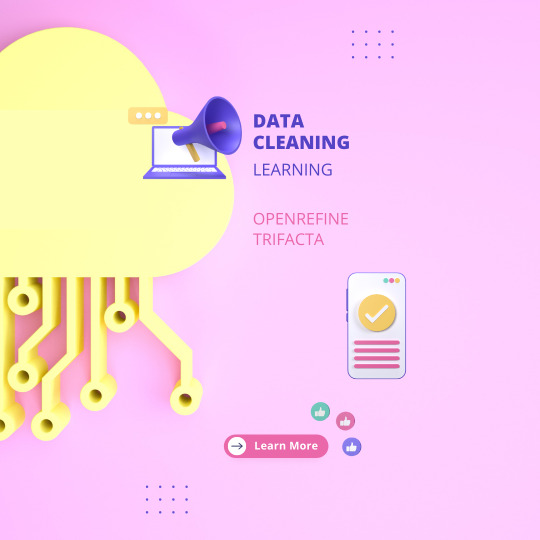
a. OpenRefine: A free, open-source tool for cleaning and transforming messy data.
b. Trifacta: Offers a user-friendly interface for data wrangling and cleaning.
c. DataWrangler: Developed by Stanford, it's a web-based tool for exploring and cleaning data.
3. Data Storage and Databases:
a. MySQL: An open-source relational database management system (RDBMS).
b. MongoDB: A NoSQL database that's particularly useful for handling unstructured data.
c. Amazon Redshift: A fully managed data warehouse service provided by AWS.
4. Data Analysis and Visualization:
a. Tableau: A popular data visualization tool that can connect to various data sources.
b. Power BI: Microsoft's business analytics service for creating interactive reports and dashboards.
c. QlikView/Qlik Sense: Tools for data visualization and business intelligence.
5. Statistical Analysis:
a. R: A programming language and software environment for statistical computing and graphics.
b. Python (with libraries like NumPy and SciPy): A versatile language for data analysis and statistics.
c. IBM SPSS: A statistical software suite used for advanced analytics and data analysis.
6. Machine Learning and Predictive Analytics:
a. Scikit-Learn: A Python library for machine learning.
b. TensorFlow: An open-source machine learning framework developed by Google.
c. RapidMiner: An integrated environment for machine learning, data mining, and predictive analytics.
7. Big Data and Distributed Computing:
a. Hadoop: An open-source framework for distributed storage and processing of big data.
b. Spark: An open-source, distributed computing system that can handle large datasets.
c. Amazon EMR: A cloud-native big data platform for processing and analyzing vast amounts of data.
8. Text and Sentiment Analysis:
a. NLTK (Natural Language Toolkit): A Python library for working with human language data.
b. IBM Watson NLU: Offers natural language understanding and sentiment analysis.
c. TextBlob: A simpler Python library for processing textual data.
9. Real-time Analytics:
a. Apache Kafka: A distributed streaming platform for building real-time data pipelines.
b. Apache Flink: An open-source stream processing framework.
c. Elasticsearch: A search and analytics engine that can provide real-time insights.
10. Cloud-Based Data Analytics:
a. Google Cloud Dataflow: A serverless data processing service on Google Cloud.
b. AWS Data Analytics: A suite of services for analytics on Amazon Web Services.
c. Microsoft Azure Data Analytics: A range of analytics services offered by Microsoft's Azure cloud platform.
Remember that the choice of a data analytics tool should be based on your specific needs, the size and nature of your data, and your proficiency with the tool. It's often beneficial to have a diverse skill set and the ability to use multiple tools for different aspects of the data analytics process.
#Data Analytics#Data Transformation#Data Analytics Tools#data visualization tool#database management system
0 notes