#dax tutorial
Explore tagged Tumblr posts
Visit Tumblr Blog
Explore Tumblr blogs with no restrictions, modern design and the best experience.
Last Seen Tumblr Blogs


Fun Fact
25% of US internet users with an annual income of $80-100K use Tumblr.
Text
[DataModeling] Tip DAX para autoreferencia o recurrencia de tabla
Hace tiempo que no nos sentrabamos en acompañar un escenario de modelado. En esta oportunidad, nos vamos a enfocar en como resolver una situación de auto referencia o recurrencia de tabla. Suele ocurrir que una tabla puede tener ids o claves de referencia para si misma y las formas de resolverlo pueden variar.
En este artículo, vamos a mostrar como valernos de DAX para resolver un esquema jerárquico corporativo que ayude a develar un organigrama organizacional basado en niveles o posiciones/cargos superiores.
Contexto
Entre las formas de modelar bases de datos transaccionales, buscamos normalizar los datos para evitar la redundancia lo más posible. Así es como pueden aparecer escenarios donde hay tablas que van a referenciarse a si mismas. Esto quiere decir que podemos tener una clave foránea apuntando a una clave primaria. Para no abordar tanta teoría veamos un ejemplo que ayude a enfocar el caso.
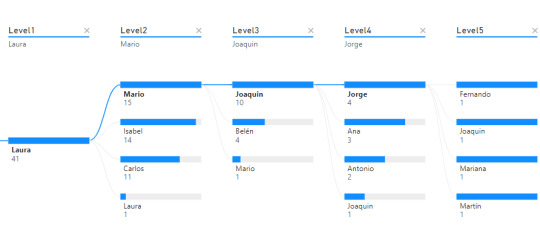
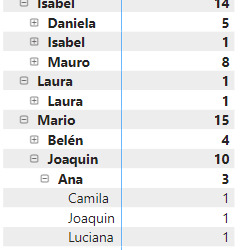
Nos enviaron un requerimiento que pide detallar un organigrama o estructura jerárquica en la organización que permita explorar la cantidad de empleados según distintos focos de mando. Piden que la información sea explorable, puede ser una matriz o árbol del siguiente estilo:
Árbol de decomposición
Matriz
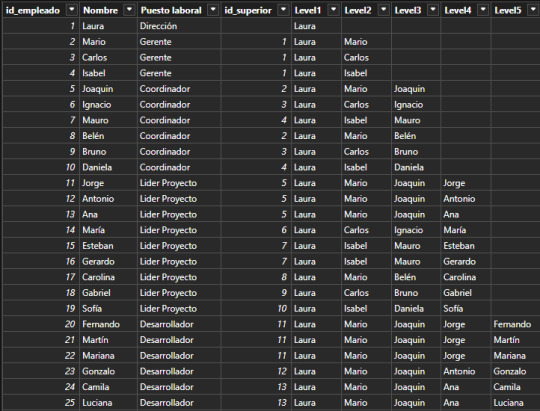
Supongamos que tenemos una tabla de Empleados en nuestra base de datos. La organización tiene un gran volumen de personal, lo que hace que naturalmente haya una estructura jerárquica con cargos de mando o de management. Todas las personas institucionales forman parte de la tabla empleados fila por fila. Sin embargo, necesitamos guardar información sobre la persona a la cual responden. Aquí aparece la auto referencia. Para resolver esta operación en vistas de base de datos transaccional, será más performante y menos costoso delimitar una nueva columna que autoreferencie a otra fila en lugar de otras tablas para los cargos pertinentes. Veamos como quedaría una tabla con la nueva columna:

Fíjense que la columna id_superior pertenece a un id_empleado de otra fila. Cuando esto ocurre, estamos frente a un caso de auto referencia.
Dependiendo el proceso y escenario a delimtiar en nuestro modelo semántico, puede ser resuelto de distintas formas. Podríamos generar fact factless que orienten un mapeo de quienes responden a quienes o podemos tomar esta tabla como dimensión y generar columnas que representen el mando jerárquico como columnas categóricas de la dimension.
Este artículo se enfocará en la segunda solución. Vamos a generar columnas categoricas que nos ayuden a construir algo semejante a lo siguiente:

La idea es generar columns por cantidad de niveles jerárquicos que se presenten. Si bien la mejor solución es implementarlo lo más temprano posible, es decir en un warehouse, lakehouse o procesamiento intermedio; aquí vamos a mostrar como crear las columnas con DAX.
Vamos a crear una columna calculada de la siguiente manera:
Level1 = LOOKUPVALUE( Empleados_Jerarquia[Nombre] , Empleados_Jerarquia[id_empleado] , PATHITEM( PATH ( Empleados_Jerarquia[id_empleado], Empleados_Jerarquia[id_superior]) , 1 , INTEGER ) )
Vamos a nutrirnos de tres funciones para generar un recorrido dentro de la misma tabla.
LOOKUPVALUE: Esta función busca un valor en una columna específica de una tabla, basándose en criterios de búsqueda. En este caso, está buscando el nombre de un empleado con criterio de igualdad entre id_empleado que mapee al id_superior de la fila actual.
PATH: Esta función crea una cadena que representa la jerarquía de empleados, utilizando los id_empleado y id_superior. Busca los ID y los separa por Pipes. Entonces por ejemplo en la fila de ID = 5 de Joaquín. El resultado de Path será "1|2|5" representando que los ID de sus superiores son primero el empleado 2 y luego el empleado 1.
PATHITEM(..., 1, INTEGER): Esta función toma la cadena generada por PATH y extrae un elemento de ella. En este caso, está extrayendo el primer elemento (el id del empleado que está en la posición 1). Aquí, el 1 se refiere a la posición que queremos extraer (el primer ítem en la jerarquía). Si Joaquín tenía 3 valores, vamos a buscar el de la primera posición, en este caso "1".
Resultado: lookupvalue buscara el nombre del empleado con ID 1 para la columna.
Esta función podríamos replicarla para cada nivel. La función antes vista traería el primero de la cadena, es decir la dirección de la empresa. Para llegar al siguiente nivel cambiamos el parametro de pathitem de manera que traiga el segundo resultado de Path en sus pipes.
Level2 = LOOKUPVALUE( Empleados_Jerarquia[Nombre] , Empleados_Jerarquia[id_empleado] , PATHITEM( PATH ( Empleados_Jerarquia[id_empleado], Empleados_Jerarquia[id_superior]) , 2 , INTEGER ) )
En primera instancia esto parecería resolverlo. Este sería nuestro resultado:
Esta puede ser una solución directa si solo queremos navegar por nombres de personas en cadena (filtramos Level5 <> Blank). Sin embargo, si también quisieramos conocer la cantidad de personas que tienen a cargo, es necesario contar a la persona al mando como parte del equipo, sino generaríamos una cadena de "Blanks" como pueden ver en niveles del 2 al 5. Esto lo podemos corregir copiando el nivel anterior cuando ocurre un blanco.
Level2 = VAR __lvl2 = LOOKUPVALUE( Empleados_Jerarquia[Nombre] , Empleados_Jerarquia[id_empleado] , PATHITEM( PATH ( Empleados_Jerarquia[id_empleado], Empleados_Jerarquia[id_superior]) , 2 , INTEGER ) ) RETURN IF ( ISBLANK(__lvl2) , Empleados_Jerarquia[Level1], __lvl2 )
De esa forma el equipo de Laura (primera) cuenta con tres gerentes y si misma al conteo total de empleados.
Las visualizaciones pueden ser construidas por cada nivel como columnas categóricas de las dimensiones:
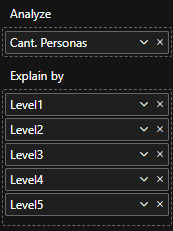
Así mismo podría usarse el nombre del cargo como nombre de columna para ver la pirámide institucional de una manera más sencilla.
De esta forma llegaríamos al resultado esperado y mostrado en la primera imagen de requerimiento.
Ojala esta solución les sirva para resolver situaciones de modelado recursivo. Recuerden que si podemos ejecutar esto en SQL en nuestra capa de transformación, sería lo mejor para construir la dimensión. Como siempre pueden descargar el archivo de ejemplo de mi GitHub.
#dax#dax tip#dax tutorial#dax training#data modeling#powerbi#power bi#power bi desktop#power bi cordoba#power bi argentina#power bi jujuy#ladataweb
0 notes
Text


Danielle Dax, circa 1987
#queen please drop the makeup tutorial#danielle dax#lemon kittens#goth#trad goth#80s goth#experimental music
5 notes
·
View notes
Text
power bi interview questions on dax Boost your career with our Power BI Certification Course online. Join now for expert training and take the next step in IT success.
power bi dax course ,power bi dax tutorial ,power bi dax formulas ,power bi interview preparation ,power bi interview questions on dax ,
#power bi dax course#power bi dax tutorial#power bi dax formulas#power bi interview preparation#power bi interview questions on dax#data analytics#education#power bi certification cost#power bi course#power bi certification#power bi online training#power bi course fees#sql#msbi#power bi
1 note
·
View note
Text
Learn Power BI Tutorial Beginner to Pro 2023 Edition [Full Course]
Introduction to Power BI Course
Welcome to the Power BI Course! In this comprehensive training program, we will embark on an exciting journey to explore the powerful world of Microsoft Power BI, a leading business intelligence and data visualization tool. This course is designed to equip you with the essential skills and knowledge required to harness the full potential of Power BI and make data-driven decisions with confidence.
1. The Power of Data Visualization: In today's data-driven world, organizations generate massive amounts of data. However, raw data alone is not enough to drive informed decision-making. The ability to transform data into meaningful insights is crucial, and this is where Power BI shines. By providing an intuitive and user-friendly interface, Power BI enables you to create captivating visualizations, interactive dashboards, and insightful reports, empowering you to extract valuable information from your data effortlessly.
2. Understanding Power BI: Before diving into the technical aspects, we will start by understanding the fundamental concepts of Power BI. You will learn about the components that make up the Power BI ecosystem, including Power BI Desktop, Power BI Service, and Power BI Mobile, and how they work together to deliver a seamless user experience. Additionally, we will explore the key features and functionalities that set Power BI apart as a leading BI tool.
3. Data Preparation and Transformation: One of the initial steps in any data analysis process is data preparation. In this course, we will guide you through the process of connecting Power BI to various data sources, including Excel, databases, and online services. You will learn how to transform and cleanse raw data into a structured and usable format, ensuring that your analyses are accurate and reliable.
4. Building Interactive Reports: With a solid foundation in data preparation, we will move on to designing interactive reports. Power BI offers a wide range of visualization options, from basic charts and graphs to custom visualizations created by the vibrant Power BI community. You will discover how to present data in a compelling and informative manner, using different types of visualizations to effectively communicate insights to stakeholders.
5. Creating Dynamic Dashboards: Dashboards are a crucial element of data analysis, as they provide a consolidated view of essential metrics and KPIs. In this section, we will show you how to combine multiple visualizations into interactive and dynamic dashboards. You will also learn how to set up filters, slicers, and other interactive elements to allow users to explore the data on their terms.
6. Sharing and Collaborating: Data analysis becomes more impactful when shared with others. Power BI enables you to publish and share your reports and dashboards securely, both within your organization and externally. We will walk you through the process of sharing your work and collaborating with colleagues to foster data-driven decision-making across the organization.
7. Power BI for Data Modeling and Analysis: To take your skills to the next level, we will delve into the realm of data modeling and analysis. You will learn about data relationships, calculated columns, and measures, which are essential for creating robust and accurate data models. These models will empower you to perform in-depth analyses, conduct what-if scenarios, and gain deeper insights into your data.
8. Advanced Power BI Features: As we approach the conclusion of the course, we will introduce you to some of the advanced features and functionalities that Power BI offers. This includes data security, DAX expressions, custom visuals, and incorporating AI and machine learning capabilities to enrich your reports.
Conclusion: By the end of this Power BI course, you will have gained a comprehensive understanding of the tool's capabilities and the skills to transform raw data into powerful insights. Whether you are a business professional, data analyst, or IT expert, the knowledge acquired in this course will empower you to make data-driven decisions and contribute significantly to your organization's success. So, let's get started on this exciting journey of unleashing the power of data with Power BI!
Learn Power BI Tutorial Beginner to Pro 2023 Edition [Full Course]
#power bi#power bi tutorial#power bi desktop#power bi dashboard#microsoft power bi#learn power bi#power bi training#power bi for beginners#power bi tutorial for beginners#what is power bi#power bi reports#power bi course#power bi demo#how to use power bi#power bi full course#power query#introduction to power bi#power bi project#dax power bi#power bi desktop tutorial#curso de power bi#power bi beginner#power bi pro#power bi dax#power bi data
1 note
·
View note
Text

[Image description: Preview panel for the comic strip at the link below. Major Kira, Lt. Cmdr. Dax, Constable Odo, Garak, and Quark of Star Trek Deep Space Nine are listening to the Doctor, half human incarnation, of Doctor Who. The Doctor is saying, with obvious delight and anticipation, "What do you call a racehorse who plays guitar?" Unfortunately there are not image descriptions at the main Hero Of Three Faces site. End description.]
The Hero of Three Faces is fanfiction crossovers, but it’s comic strips with stick figures, but they’re triangles. Preview panel only. Click here for full cartoon. Or see the on-site navigation tutorial. Or see this blog’s FAQ, or my archive tumblog’s FAQ. Cartoons may contain unmarked spoilers. Cartoons linked from Tumblr 10:00 (Central US time) daily are the previous day’s new update and the posts are pinned to the top of this blog. Cartoons linked from Tumblr 22:00 daily are from the archive and the posts are pinned only during annual summer hiatus of new updates.
Thanks for reading.
7 notes
·
View notes
Note
for the star trek ask game: 🎨 and 📚
Favorite piece of Star Trek fanart: How can I pick? There's so many good ones! But here's some links to some art pieces I like:
Tasha and Deanna by pien-art
Kirk and Vulcans watching a dust storm Midwestern style by thetimetostrikeislater
Trans rights/bisexual pride Jadzia Dax and Julian Bashir by shitinnspace
"What do androids dream of?" by serennes-art
"Less perfect" by serennes-art
Favorite Star Trek fics: Again, it's difficult to pick. But here's a few:
Social Skills, by StaceyDawe
What Spock Knows, by indeedcaptain
Dear Data, by Obsessive_daydreamer
To Sleep, Perchance to Dream, by ardavenport
Data isn't Good at Everything (Or the Cursed Trombone Tutorial), by Fibrulating-pink-cat
7 notes
·
View notes
Text
What are the different types of power bi certification course in Pune
Introduction Power BI and Its Rising Demand

Data is not just information it's power. In the current digital period, associations calculate on data visualization and analytics to stay competitive. Power BI, Microsoft's leading business analytics tool, empowers professionals to fantasize, dissect, and share perceptivity from data in real- time. As businesses decreasingly move towards data- driven opinions, the demand for professed Power BI professionals is soaring.
Types of Power BI Certification Courses in Pune
Freshman- position Power BI Courses
Ideal for those dipping their toes into data analytics. These courses introduce Power BI’s interface, dashboards, and introductory DAX formulas. Anticipate hands- on tutorials and interactive visual systems.
Intermediate Power BI Certification Programs
For those with some experience in analytics, intermediate courses claw into data modeling, Power Query metamorphoses, and advanced visualizations. It’s the perfect ground between proposition and assiduity operation.
Advanced Power BI Certification Tracks
Targeting professionals with previous BI experience, advanced instruments concentrate on enterprise- position results, Power BI integration with Azure, and bedded analytics. learning these modules paves the way for elderly data critic places.
Microsoft Power BI instrument – The Global Standard
The Microsoft Certified Data Analyst Associate credential is the gold standard. Grounded on the PL- 300 test, it validates your capability to prepare, model, fantasize, and dissect data using Power BI. numerous Pune institutes structure their training to directly support this instrument.
Course Format Options in Pune
Classroom- Grounded Training
For those who thrive in a physical literacy terrain, classroom sessions offer educator support, peer commerce, and a structured literacy pace. Several training centers in Pune, especially in areas like Kothrud and Hinjewadi, give weekend and weekday batches.
Online educator- Led Power BI Courses
Blending inflexibility with real- time support, these courses offer live virtual classes from pukka coaches. Perfect for working professionals demanding schedule rigidity.
Tone- Paced Learning Programs
For the tone- motivated learner, recorded lectures, downloadable coffers, and practice datasets are handed. These are frequently more budget-friendly and can be completed at your own pace.
Duration and Structure of Power BI Certification Courses
utmost freshman- position courses last 4 – 6 weeks, while intermediate and advanced tracks may stretch to 8 – 12 weeks. Courses generally follow a modular structure, gradationally introducing learners to data cleaning, modeling, visualization, and reporting.
Real- Time systems and Case Studies – What to Anticipate
Anticipate systems involving deals dashboards, client segmentation, and functional analytics. Real- time case studies insure you are not just learning proposition but applying it to business scripts.
Tools and Technologies Covered Alongside Power BI
numerous courses integrate tools like SQL, Excel, Python for data visualization, and Azure Synapse Analytics to give learners a comprehensive BI toolkit.
Benefits of Enrolling in a Power BI Course in Pune
Pune, being a tech mecca, offers excellent faculty, practical exposure, and networking openings. scholars frequently profit from original externship tie- ups and placement support.
Top Institutes Offering Power BI Certification Course in Pune
Some well- regarded names include
Ethans Tech
3RI Technologies
SevenMentor
Edureka( online presence with Pune support) These institutes boast educated coaches, solid course material, and placement backing.
How to Choose the Right instrument Course for You
Define your literacy thing freshman, job switcher, or advanced critic? Review the syllabus, read reviews, assess coach credibility, and interrogate about real- world design work. Do n’t forgetpost-course support and placement help.
Average Cost of Power BI instruments in Pune
Prices range from ₹ 8,000 to ₹ 25,000 depending on course position and format. Online courses may offer EMI and rush abatements.
Career openings Post Certification
pukka professionals can land places like
Business Intelligence Analyst
Data Visualization Specialist
Power BI inventor
Data AnalystCompanies hiring include TCS, Infosys, conscious, andmid-level startups.
Salary prospects in Pune vs Other metropolises
A pukka Power BI critic in Pune earns ₹ 4 – 7 LPA on average. In discrepancy, hires in New York or San Francisco may start from$ 70,000 –$ 90,000 annually, reflecting cost- of- living differences.
Comparing Pune’s Immolations to Other metropolises
Power BI instrument Course in Washington
Power BI Certification Course in Washington offers cutting- edge content backed by government and commercial collaboration, the cost of training and living is significantly advanced compared to Pune.
Power BI Certification Course in San Francisco
Known for its Silicon Valley edge, Power BI Certification Course in San Francisco frequently leans into pall integration and AI- powered BI tools. But again, Pune offers more affordable options with solid content depth.
Power BI Certification Course in New York
Courses in New York emphasize fiscal and enterprise data analytics. Pune’s growing finance and IT sectors are catching up presto, making it a good contender at a bit of the price.
Tips to Ace Your Power BI instrument test
Practice daily using Microsoft’s sample datasets.
Recreate dashboards from scrape.
Focus on DAX and data modeling.
Join Power BI forums for tips and challenges.
Conclusion – The Road Ahead for BI Professionals
Whether you are in Pune, Washington, San Francisco, or Power BI Certification Course in New York can turbocharge your career in data analytics. As businesses embrace data for every decision, pukka professionals will continue to be in high demand.
0 notes
Link
Power BI DAX: The world of technology moves fast—Data Analytics, Programming, and Computer Science are no longer niche skills but essential tools for career
0 notes
Text
Unlock Your Future: 3 Steps to Power BI Development Success
In an era where data drives decision-making, becoming a Power BI developer can open doors to exciting career opportunities. Power BI is a leading tool that helps organizations visualize and analyze their data efficiently. If you’re ready to unlock your future in data analytics, follow these three essential steps to achieve Power BI development success.
If you want to excel in this career path, then it is recommended that you upgrade your skills and knowledge regularly with the latest Power BI Course in Bangalore

Step 1: Grasp the Fundamentals of Data Analytics
The first step on your journey is to build a solid foundation in data analytics. Here’s what to focus on:
Understanding Data: Familiarize yourself with key data concepts, including types of data, data structures, and databases. A strong grasp of these basics will enable you to work effectively with data.
Statistical Knowledge: Learn fundamental statistics and data interpretation skills. This knowledge is critical for deriving meaningful insights from your analyses.
Power BI Basics: Explore Power BI’s interface and core functionalities, such as data import, data modeling, DAX (Data Analysis Expressions), and dashboard creation.
Learning Resources
Online Courses: Platforms like Coursera, Udemy, and edX offer comprehensive courses tailored for Power BI beginners.
YouTube Channels: Many creators share tutorials and tips that can help you get started with Power BI.
Step 2: Acquire Hands-On Experience
Practical experience is vital for mastering Power BI. Here’s how to gain that experience:
Personal Projects: Start analyzing datasets that pique your interest. Use platforms like Kaggle to find datasets and create your own reports and dashboards.
Internships and Entry-Level Roles: Seek internships or junior positions that involve Power BI. Real-life experience will enhance your skills and give you a taste of working in the field.
Community Involvement: Join Power BI forums and user groups. Engaging with the community can provide valuable insights and support as you learn.
Tools and Platforms
Kaggle: A fantastic resource for datasets and competitions that can help you practice your skills.
Microsoft Power BI Community: Connect with other users to share knowledge and solve common challenges.
With the aid of Best Online Training & Placement programs, which offer comprehensive training and job placement support to anyone looking to develop their talents, it’s easier to learn this tool and advance your career.
Step 3: Build a Strong Portfolio and Network
A compelling portfolio is crucial for showcasing your skills to potential employers. Here’s how to create one:
Create Engaging Dashboards: Use Power BI to design visually appealing dashboards that effectively communicate data insights. Focus on storytelling through data.
Document Your Projects: For each project, include summaries of the problems you addressed, your analytical approach, and the results. Clear documentation highlights your thought process and problem-solving abilities.
Expand Your Network: Attend industry events, webinars, and meetups. Connect with professionals on LinkedIn and share your projects to increase your visibility in the data analytics community.
Portfolio Platforms
LinkedIn: Use your profile to showcase your work and connect with industry leaders.
GitHub: A useful platform for sharing your projects, especially if they include code or advanced analyses.
Conclusion
Unlocking your future as a Power BI developer is achievable with the right approach. By grasping the fundamentals of data analytics, acquiring practical experience, and building a strong portfolio, you can set yourself up for success in this dynamic field. Stay motivated, keep learning, and embrace the opportunities that come your way. Your journey to Power BI development success starts now!
1 note
·
View note
Text
[DAX] INFO functions
Hace varios meses ya que microsoft nos ha sorprendido agregando nuevas funciones en DAX que responden a información del modelo. Conocer detalles del modelo se vuelve indispensable para documentar o trabajar por primera vez con un modelo ya creado.
Ya son más de 50 nuevas funciones que permiten preguntarle al modelo detalles particulares como por ejemplo indagar en las expresiones de las medidas de nuestro modelo o los roles de seguridad por filas creados.
Lo cierto es que ya existía una forma de llegar a esta información. Desde el inicio de modelos tabulares tuvimos exposición a DMV (Dynamic Management Views). Como nos gusta hacer aqui en LaDataWeb, primero veamos el contexto teórico:
Las vistas de administración dinámica (DMV) de Analysis Services son consultas que devuelven información sobre los objetos del modelo, las operaciones del servidor y el estado del servidor. La consulta, basada en SQL, es una interfaz para esquemas de conjuntos de filas.
Si quieren traer un poco más a la memoria o un ejemplo de ello, pueden revisar este viejo artículo. El nuevo esquema INFO en DAX nos brinda más de 50 funciones para obtener información del esquema TMSCHEMA de DMV.
Si ya existía... ¿Por qué tanto revuelo?
Las INFO de DAX vienen a evolucionar algunos aspectos que no podíamos resolver antes y darnos creatividad para explotarlos en otros que tal vez no habíamos pensado.
No es necesario utilizar una sintaxis de consulta diferente a DAX para ver información sobre tu modelo semántico (antes SQL). Son funciones DAX nativas y aparecen en IntelliSense cuando escribes INFO.
Puedes combinarlas usando otras funciones DAX. La sintaxis de consulta DMV existente no te permite combinarlas. Como función DAX, la salida es de tipo de datos Tabla y se pueden usar funciones DAX existentes que unen tablas o las resumen.
Estas son el eslabón inicial bajo el cual se llamó la atención. Ahora podemos pensar solo en DAX y si buscamos INFO de Tablas, relaciones, columnas o medidas, podemos combinarlas para mejorar el resultado de nuestra consulta. Si quisieramos conocer las medidas de una tabla puntual con su nombre, podríamos ejecutar algo así:
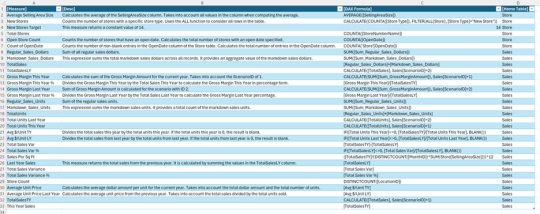
EVALUATE VAR _measures = SELECTCOLUMNS( INFO.MEASURES(), "Measure", [Name], "Desc", [Description], "DAX formula", [Expression], "TableID", [TableID] ) VAR _tables = SELECTCOLUMNS( INFO.TABLES(), "TableID", [ID], "Table", [Name] ) VAR _combined = NATURALLEFTOUTERJOIN(_measures, _tables) RETURN SELECTCOLUMNS( _combined, "Measure", [Measure], "Desc", [Desc], "DAX Formula", [DAX formula], "Home Table", [Table] )
Así obtendríamos una tabla con su nombre, sus medidas, sus descripciones de medidas y las expresiones de las medidas. El resultado puede ser documentación de modelo exportado a excel:
¿Donde o cómo puede ejecutarlo?
Las funciones de información puede ayudarnos para explorar un modelo en edición actual. Si estamos conociendo un modelo por primera vez o culminando un trabajo para documentar, podríamos abrir la vista de consultas DAX de un Power Bi Desktop para ejecutar el código. También siempre dispondríamos de DAX Studio que no solo permite ejecutar con un PowerBi Desktop, sino también contra un modelo en una capacidad dedicada en Fabric o PowerBi Service.
En mi opinión lo más interesante es que esto es DAX nativo. Como gran amante de la PowerBi Rest API, eso me entusiasma, dado que el método que permite ejecutar código DAX contra un modelo semántico en el portal de PowerBi, no permite DMV. Restringe a DAX nativo. Esto abre las puertas a ejecutar por código una consulta de información al modelo. Podríamos estudiar y comprender que es lo que a nuestra organización más nos ayuda entender de un modelo o nos gustaría documentar. A partir de ello construir un código que obtenga esa información de un modelo semántico que necesitemos comprender. Veamos la siguiente imagen que aclare más

Espero que las funciones los ayuden a construir flujos que les brinden la información que desean obtener de sus modelos.
#powerbi#power bi#power bi desktop#DAX#power bi tips#power bi tutorial#power bi training#power bi argentina#power bi jujuy#power bi cordoba#ladataweb#simplepbi
1 note
·
View note
Text
Ready to take your Power BI skills to the next level? This intermediate-level Power BI tutorial goes beyond the basics and dives into advanced techniques for visualizing and analyzing data. You’ll learn how to *customize Stacked Column Charts, Funnel Charts, treemaps, and matrix tables; apply *DAX calculations; and optimize reports for *better interactivity and insights.
0 notes
Text
Excel Power Query vs. Power Pivot: Which Tool Should You Use?

If you’ve ever worked with large datasets in Excel, you’ve probably reached a point where basic formulas just aren’t enough. That’s where two of Excel’s most powerful features come in: Power Query and Power Pivot. Both tools are essential for data analysis, but they serve different purposes.
So how do you decide which one to use? In this guide, we’ll walk through the differences between them and help you figure out the right tool for your needs.
What Is Power Query in Excel?
Power Query in Excel is a tool designed to clean, transform, and prepare data for analysis. It allows you to import data from different sources, fix formatting issues, and shape the data exactly how you want it, all without changing the original files.
Key Benefits of Power Query:
Connects to many sources: Excel files, text files, databases, online sources, and more.
Cleans data efficiently: You can remove duplicates, split columns, filter rows, and convert data types.
No need for coding: Its visual interface makes data prep easy, even for non-programmers.
Keeps a clear log: Every step is recorded, so changes are easy to trace or undo.
If you regularly work with messy data from different departments or systems, Power Query is the tool that helps you get it all in one place and ready to go.
What Is a Power Pivot? A Practical Tutorial
Power Pivot is an advanced data modeling feature in Excel. Instead of just working with a single flat table, it lets you work with multiple related tables. You can create relationships, use calculated fields, and build powerful pivot tables from huge datasets.
What Power Pivot Does Best:
Handles big data: It can work with millions of rows without slowing down.
Creates relationships: You can link multiple tables without merging them.
Supports DAX formulas: These allow you to create advanced calculations that go beyond standard Excel functions.
Improves reporting: Helps build dynamic dashboards and pivot tables based on complex models.
If you’re building reports that need to pull information from several tables, Power Pivot will save you hours of work and improve the quality of your analysis.
Power Query vs Power Pivot: A Side-by-Side Comparison
Let’s break it down clearly:FeaturePower Query in ExcelPower Pivot TutorialMain Use Preparing and transforming data Modeling data and running advanced calculationsStrength Connecting and cleaning data from sources Creating relationships and custom measuresInterface Step-by-step visual editor Data model view with DAX supportIdeal For Standardizing messy input data Analyzing large structured datasets
So, Power Query is for cleaning and prepping. Power Pivot is for modeling and analyzing. Simple as that.
Using Both Tools Together
You don’t have to choose between them. In fact, combining both tools gives you the best results.
A Typical Workflow:
Start with Power QueryLoad the data, clean it, and apply all your transformations.
Move to Power PivotCreate relationships between the tables, define measures, and build your reports.
This combination is what makes Excel a real powerhouse for data analysis. It’s a workflow many professionals use daily.
When to Use Power Query
Here are situations where Power Query is the better choice:
You need to import data from multiple sources.
You’re dealing with messy or inconsistent data.
You want to automate data cleanup tasks.
You need a repeatable process that updates with fresh data.
If you find yourself repeating the same steps every time you get new data, Power Query can handle all of that with just one click.
When Power Pivot Is the Right Tool
Use Power Pivot when:
Your data is too large for regular Excel to handle efficiently.
You’re working with multiple related tables.
You want to build custom KPIs and metrics.
You need to create a dynamic dashboard with slicers and filters.
Power Pivot is perfect for business analysts who need to dive deep into data and build powerful reports without leaving Excel.
Final Thoughts
Understanding how Power Query in Excel and Power Pivot work, And how they work together can completely change the way you use Excel. They are part of a bigger trend of self-service BI tools, giving more power to users without relying on IT or external software.
Use Power Query to clean and organize your data.
Use Power Pivot to model and analyze it.
Use both tools to build a streamlined, automated workflow that saves time and improves accuracy.
If you’re serious about improving your Excel skills, learning both tools is a smart investment.
0 notes
Text
How to Prepare Your Tableau Team for the Power BI Learning Curve
As more organizations pivot toward Power BI for its tight Microsoft integration, cost efficiency, and advanced features, many Tableau teams are facing the challenge of adapting to a new environment. While both platforms offer powerful data visualization capabilities, they operate under different paradigms. For a smooth transition, preparing your Tableau team for the Power BI learning curve is crucial. Here’s how you can set your team up for success.
1. Acknowledge the Differences Early
Start by educating your team on the key differences between Tableau and Power BI. Power BI’s model-driven approach, its reliance on DAX (Data Analysis Expressions), and its integration with the Microsoft ecosystem require a different mindset compared to Tableau’s more visual, worksheet-based structure. Teams need to understand that while many principles are transferable, workflows and tools will feel different.
2. Invest in Tailored Training
Generic tutorials won’t cut it. Your Tableau experts already understand data — what they need is training that bridges their current Tableau skills with Power BI’s capabilities. Look for training resources specifically designed for Tableau users transitioning to Power BI. Include hands-on sessions that focus on building similar dashboards and reports in Power BI to reinforce familiarity.
3. Encourage a DAX-First Mindset
Unlike Tableau’s calculated fields and LOD expressions, Power BI relies heavily on DAX for complex calculations and data modeling. DAX can initially be intimidating, but it’s essential for optimizing performance and building scalable reports. Provide your team with foundational DAX training and encourage daily practice to build confidence.
4. Start with Pilot Projects
Don’t throw the entire workload into Power BI on day one. Instead, assign low-risk, internal dashboards as pilot projects. This allows the team to experiment, make mistakes, and learn in a low-pressure environment. Use these pilots to document best practices and build internal playbooks that will help others follow suit.
5. Use Tools Like Pulse Convert to Accelerate Learning
Manual migration from Tableau to Power BI can be time-consuming and error-prone. Leverage tools like Pulse Convert by OfficeSolution to speed up the transition. Pulse Convert automates many aspects of the migration process and helps Tableau users see how their existing logic and dashboards translate into Power BI, making the learning curve significantly less steep.
6. Foster a Culture of Collaboration and Support
Lastly, create a support network where your team can openly share challenges and solutions. Regular check-ins, lunch-and-learns, and collaborative problem-solving sessions can make the transition feel more like a team effort rather than an individual struggle.
Conclusion
Preparing your Tableau team for the Power BI learning curve requires more than just technical training—it demands a thoughtful, structured approach. By acknowledging platform differences, investing in targeted learning, and using smart migration tools like Pulse Convert, you can empower your team to make the leap confidently.
Visit https://tableautopowerbimigration.com/ for more resources and expert guidance from OfficeSolution on managing your Tableau to Power BI journey.
0 notes
Text
Start Your Data Journey with TTFA Academy’s Power BI Certification
TTFA Academy offers a structured and hands-on Power BI certification course for individuals looking to work with data in a meaningful way. This course is designed to help learners understand the fundamentals of Power BI and apply them in day-to-day business scenarios.
The program begins with the basics—data loading, cleaning, and visualization—before moving into deeper topics like DAX formulas and report design. Step by step, you’ll build the skills to create professional dashboards that highlight patterns, trends, and insights from raw data.
What makes the Power BI certification at TTFA Academy unique is its focus on applied learning. You won’t just watch tutorials—you’ll practice with real datasets, complete assignments, and build reports that mirror actual business needs.
It’s a course built for learners at all levels. Whether you’re just getting started or brushing up on your Power BI knowledge, the clear instructions, practical examples, and personal guidance offered by TTFA’s trainers help you stay on track.
You’ll also have access to a variety of resources—recorded sessions, project work, and review materials—to support your progress. Upon completion, you’ll not only earn a certification but also gain the ability to handle data confidently in a business setting.
If you're exploring options for a reliable and practical power bi certification, TTFA Academy delivers a course that focuses on what really matters—learning by doing.
0 notes
Text
Mastering Coupa & ServiceNow with Power BI: Supplier Management & Analytics Guide
In an increasingly digital and competitive business environment, organizations need smarter ways to manage suppliers, automate internal workflows, and extract actionable insights from their data. At Tech Innovations, we specialize in helping companies achieve operational excellence by integrating three powerful platforms: Coupa, ServiceNow, and Power BI.
This comprehensive guide dives into how a strategic approach to Coupa Supplier Management, ServiceNow implementation, and Power BI Integration can enhance supplier relationships, streamline operations, and empower data-driven decision-making.
Coupa Supplier Management: Elevate Procurement with Precision
Supplier Management functions in Coupa provide companies with an advanced solution to manage supplier lifecycle stages across onboarding through qualification, followed by performance assessment alongside compliance verification. The business process automation capabilities in Coupa consolidate supplier data for risk mitigation while enabling supplier compliance and generating auditable records.

An organization's success depends directly on the capabilities of its users with regard to tools. The framework of coupa training stands imperative for success at this point. We at Tech Innovations deliver training solutions that combine instructor-guided instruction with independent learning modules based on your organization's particular requirements.
ServiceNow Implementation: Automate and Streamline IT Operations
When implementing ServiceNow with success, organizations receive a digital workflow infrastructure that automates IT services management (ITSM), HR services, and security operations alongside more functions. ServiceNow enables teams to become more efficient by eliminating manual work while delivering faster results and achieving better departmental transparency.
The combination of ServiceNow and Coupa brings additional strength to the system. The system performs automatic flows to start compliance audits in Coupa whenever an IT incident detects cybersecurity issues from suppliers. Automated workflow activities between different functional teams create responsible processes that break down organizational departments.
Power BI Integration: Turn Data into Insights
The power of Coupa and ServiceNow functionality becomes truly magical upon analysis and visualization of your data. Powerbi integration serves as the solution in this case. When Power BI links to Coupa and ServiceNow, businesses can create interactive dashboards that unite procurement information with IT and supplier data.
Complete monitoring of supplier performance requires assessment of price, delivery speed, and regulation adherence.
Track the duration of IT request resolutions while identifying the locations where the processes are getting stuck.
Procurement teams can achieve full visibility through the combination of operational KPIs fetched from Coupa and ServiceNow platforms.
Analyzing past information will help predict upcoming supply chain threats.
To help teams take full advantage of these capabilities, we offer hands-on Powerbi Tutorials. The instructional materials guide people through dashboard development before moving on to data modeling and DAX application for advanced insight discovery. Our resources provide help at both basic and advanced levels to any person who works with Power BI.
Why Choose Tech Innovations?
Tech Innovations, our mission is to help organizations master the intersection of procurement, IT operations, and analytics. We offer a full suite of services, including:
End-to-end ServiceNow Implementation tailored to your business
Expert-led Coupa Supplier Management strategy and support
Seamless Power BI Integration for unified data visualization
Custom Coupa Training and Power BI Tutorials for ongoing enablement
Start Your Digital Transformation Today
Mastering Coupa, ServiceNow, and Power BI isn't just about using powerful tools—it's about creating a connected, intelligent ecosystem that drives business success.
Tech Innovations will be your trusted partner in this journey.
1 note
·
View note
Text
Which institute is best for Power BI training?
Introductions
In a world ruled by data, having the chops to transfigure figures into narratives is a true superpower. Among the numerous tools available, Power BI stands altitudinous — intuitive, important, and in- demand. But learning this tool is not just about watching YouTube tutorials; it’s about structured literacy from a trusted institute.

The significance of Choosing the Right Institute
Your literacy wind depends on where you study. A great Power BI instrument Course can open doors to job places like Data Critic, Business Intelligence inventor, or Reporting Critic. So, the question is not just “ where to learn, ” it’s “ who will help me master it? ”
Key Features of a Great Power BI Training Institute
A good institute does not just educate software. It delivers
Assiduity- endured preceptors
Hands- on systems
Placement support
Real- world datasets
streamlined class with Power BI rearmost features
Instrument vs Knowledge What Matters More?
instrument adds credibility to your profile, but practical knowledge wins interviews. Luckily, the stylish Power BI instrument Courses blend both — equipping you with palpable chops while giving you a instrument that speaks volumes.
Bangalore – India’s Tech Capital for Power BI
Bangalore is not just about startups and coffee shops. It’s the parentage ground for tech invention. No surprise also that Power BI Certification Course in Bangalore are among the most advanced, with options feeding to every position — from newcomers to data pros.
Best Power BI instrument Course in Bangalore
Top institutes in Bangalore include
Intellipaat Live systems, flexible timings.
Simplilearn famed for educator- led literacy.
ExcelR Weekend classes for working professionals.
These programs combine proposition and real- time dashboards to give you a full- circle understanding of Power BI.
Pune – The Arising IT mecca for Data suckers
Pune has quietly come a attraction for tech gift. With growing demand for analytics professionals, Power BI Certification Course in Pune are witnessing a swell. Whether you are a pupil or a working professional, Pune has a training program acclimatized to your pace.
Best Power BI instrument Course in Pune
Some name options in Pune include
Seven Mentor Known for budget-friendly and practical training.
iClass Pune Offers a placement guarantee.
Techdata results Strong focus on real- time reporting.
Each course is aligned with Microsoft’s instrument roadmap and current business trends.
Mumbai – The Financial Capital Meets Data Science
Power BI Certification Course in Mumbai does not just breathe finance; it now breathes data. As businesses digitize, the demand for analytics professionals with Power BI knowledge is peaking. The megacity’s hustle makes it an ideal place to upskill.
Best Power BI instrument Course in Mumbai
Top picks in Mumbai
Livewire Institute Commercial training- style terrain.
Aptech Learning Offers short- term instrument and long- term parchment options.
IIHT Mumbai Deep- dives into advanced Power BI integrations.
These institutes offer not only robust Power BI training but also soft chops and interview medication.
Online vs Offline Power BI Courses – Which One triumphs?
While offline learning offers real- time relations, online classes offer inflexibility. The stylish institutes now offer mongrel models where you get live classes, recorded sessions, and substantiated mistrustfulness- working — stylish of both worlds.
Duration and Structure of Power BI Certification Courses
generally, a Power BI course ranges from 4 to 8 weeks. Some crash courses last just 10 days, while comprehensive modules may extend to 3 months — covering Power Query, DAX, Report creation, and Power BI Services.
What to Anticipate in a Power BI Syllabus
The class frequently includes
preface to BI and Power BI tools
Power BI Desktop affiliate
Data Transformation using Power Query
Data Modelling and DAX functions
structure dashboards and publishing reports
Real- time use cases and systems
Each content builds your capability block- by- block.
Coaches Matter How to Judge Teaching Quality
Look for preceptors with
Assiduity experience( rather 5 times)
Microsoft Power BI instrument
Proven tutoring portfolio
Access to real business datasets
Mentorship beyond the classroom
Quality training is a function of the coach’s passion and real- world exposure.
Average Course freights Across metropolises
Then’s a rough comparison
Bangalore ₹ 18,000 – ₹ 30,000
Pune ₹ 12,000 – ₹ 25,000
Mumbai ₹ 15,000 – ₹ 28,000
most courses offer EMI and literacy for meritorious campaigners.
Conclusion Making the Right Choice for Your Power BI Journey
The stylish institute is the bone that aligns with your pretensions, pace, and budget. Whether you are eyeing the Power BI Certification Course in Bangalore, Pune, or Mumbai, the request is ripe, the tool is in- demand, and the time is now.
0 notes