#geoJSON
Explore tagged Tumblr posts
Visit Tumblr Blog
Explore Tumblr blogs with no restrictions, modern design and the best experience.
Last Seen Tumblr Blogs


Fun Fact
When “GIF” was named word of the year in 2012, Oxford Dictionaries U.S.A. credited Tumblr for pushing the word.
Text
Open API's Arazzo and overlay specifications
The OpenAPI Specification OAS and its Open API Initiative (OAI)—the governing body—have been around for 10 years, and of course, OAS’s foundation, Swagger, has been around a lot longer. OpenAPI is very much a mature proposition. But the OAI community hasn’t stood still. Two standards have been developed, the first being Overlays and the latter being Arazzo. Overlays Overlays support the Arazzo…
#Apache#Apache Camel#Async API#Azarro#BPEL#business process orchestration language#GeoJSON#GraphQL#OAI#OAS#Open API#orchestration#Overlays#PolyAPI#SOAP#specifications#standards#Swagger#WS-BPEL
0 notes
Text
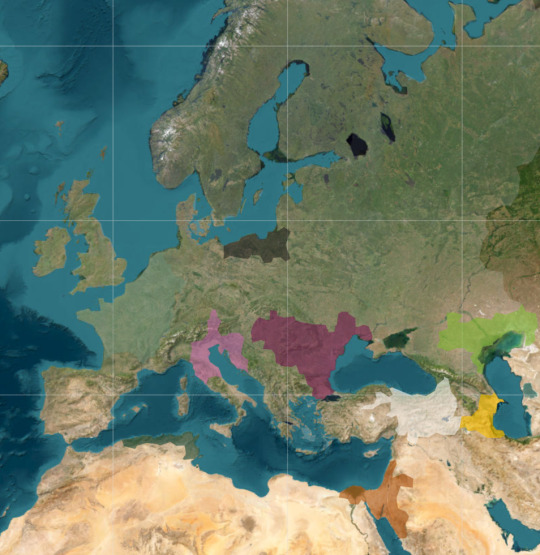
I like to make alternate history maps, so I made a whole timeline of entirely original countries and wars throughout hundreds (thousands in the future, hopefully) of years of imagined history. What I don't have is lore. Specific relationships between rulers and cultures that would actually cause these expansion patterns are entirely absent.
So what I will do is post snippets of the timeline, and let whoever happens to see it make the lore. Feel free to theorize, predict, or imagine anything that could be going behind the scenes to what is so far limited to colors on a map. Neither the countries nor the scenario itself have names btw.
This is all for now, but there will be more.
(Also it's limited to *mostly* Europe because I'm not drawing provinces for the entire world. That's a story in and of itself that I don't think is worth covering.)
1 note
·
View note
Text
tribes, nations, confederations are the admin_0 you'd typically ask and identify by. if it's federally recognized or is the body fighting for recognition, that's the name you use when answering "what tribe". clan is not something every tribe uses as a subdivision and those that do it tends to get into religious secrets or at the very least old caste or status systems and it seems a bit forward to jump in and ask a person directly the position of their family
0 notes
Text

GeoServer is one such map server. It is an open-source server written in Java that facilitates the sharing, processing, and editing of geospatial data. In this blog, I am going to take you through the installation and setup process of GeoServer and share the details of how to use it.
#nitorinfotech#blog#software development#software engineering#software#geoserver#nitor#technology blog#technology trends#software technology#technology#GeoJSON#engineering#engineering services#ascendion#data#Geoserverspatialdata#it solutions#it technology#software developments#what are software services#it consultancy company#engineering solutions#computer science#ai generated
0 notes
Text
So let's get into the nitty-gritty technical details behind my latest project, the National Blue Trail round-trip search application available here:
This project has been fun with me learning a lot about plenty of technologies, including QGis, PostGIS, pgRouting, GTFS files, OpenLayers, OpenTripPlanner and Vita.
So let's start!
In most of my previous GIS projects I have always used custom made tools written in ruby or Javascript and never really tried any of the "proper" GIS tools, so it was a good opportunity for me to learn a bit of QGIS. I hoped I could do most of the work there, but soon realized it's not fully up to the job, so I had to extend the bits to other tools at the end. For most purposes I used QGis to import data from various sources, and export the results to PostGIS, then do the calculations in PostGIS, re-import the results from there and save them into GeoJSON. For this workflow QGIS was pretty okay to use. I also managed to use it for some minor editing as well.
I did really hope I could avoid PostGIS, and do all of the calculation inside QGIS, but its routing engine is both slow, and simply not designed for multiple uses. For example after importing the map of Hungary and trying to find a single route between two points it took around 10-15 minutes just to build the routing map, then a couple seconds to calculate the actual route. There is no way to save the routing map (at least I didn't find any that did not involve coding in Python), so if you want to calculate the routes again you had to wait the 10-15 minute of tree building once more. Since I had to calculate around 20.000 of routes at least, I quickly realized this will simply never work out.
I did find the QNEAT3 plugin which did allow one to do a N-M search of routes between two set of points, but it was both too slow and very disk space intense. It also calculated many more routes than needed, as you couldn't add a filter. In the end it took 23 hours for it to calculate the routes AND it created a temporary file of more than 300Gb in the process. After realizing I made a mistake in the input files I quickly realized I won't wait this time again and started looking at PostGIS + pgRouting instead.
Before we move over to them two very important lessons I learned in QGIS:
There is no auto-save. If you forget to save and then 2 hours later QGIS crashes for no reason then you have to restart your work
Any layer that is in editing mode is not getting saved when you press the save button. So even if you don't forget to save by pressing CTRL/CMD+S every 5 seconds like every sane person who used Adobe products ever in their lifetimes does, you will still lose your work two hours later when QGIS finally crashes if you did not exit the editing mode for all of the layers
----
So let's move on to PostGIS.
It's been a while since I last used PostGIS - it was around 11 years ago for a web based object tracking project - but it was fairly easy to get it going. Importing data from QGIS (more specifically pushing data from QGIS to PostGIS) was pretty convenient, so I could fill up the tables with the relevant points and lines quite easily. The only hard part was getting pgRouting working, mostly because there aren't any good tutorials on how to import OpenStreetMap data into it. I did find a blog post that used a freeware (not open source) tool to do this, and another project that seems dead (last update was 2 years ago) but at least it was open source, and actually worked well. You can find the scripts I used on the GitHub page's README.
Using pgRouting was okay - documentation is a bit hard to read as it's more of a specification, but I did find the relevant examples useful. It also supports both A* search (which is much quicker than plain Dijsktra on a 2D map) and searching between N*M points with a filter applied, so I hoped it will be quicker than QGIS, but I never expected how quick it was - it only took 5 seconds to calculate the same results it took QGIS 23 hours and 300GB of disk space! Next time I have a GIS project I'm fairly certain I will not shy away from using PostGIS for calculations.
There were a couple of hard parts though, most notably:
ST_Collect will nicely merge multiple lines into one single large line, but the direction of that line looked a bit random, so I had to add some extra code to fix it later.
ST_Split was similarly quite okay to use (although it took me a while to realize I needed to use ST_Snap with proper settings for it to work), but yet again the ordering of the segments were off a slight bit, but I was too lazy to fix it with code - I just updated the wrong values by hand.
----
The next project I had never used in the past was OpenTripPlanner. I did have a public transport project a couple years ago but back then tools like this and the required public databases were very hard to come by, so I opted into using Google's APIs (with a hard limit to make sure this will never be more expensive than the free tier Google gives you each month), but I have again been blown away how good tooling has become since then. GTFS files are readily available for a lot of sources (although not all - MAV, the Hungarian Railways has it for example behind a registration paywall, and although English bus companies are required to publish this by law - and do it nicely, Scottish ones don't always do it, and even if they do finding them is not always easy. Looks to be something I should push within my party of choice as my foray into politics)
There are a couple of caveats with OpenTripPlanner, the main one being it does require a lot of RAM. Getting the Hungarian map, and the timetables from both Volánbusz (the state operated coach company) and BKK (the public transport company of Budapest) required around 13GB of RAM - and by default docker was only given 8, so it did crash at first with me not realizing why.
The interface of OpenTripPlanner is also a bit too simple, and it was fairly hard for me to stop it from giving me trips that only involve walking - I deliberately wanted it to only search between bus stops involving actual bus travel as the walking part I had already done using PostGIS. I did however check if I could have used OpenTripPlanner for that part as well, and while it did work somewhat it didn't really give optimal results for my use case, so I was relieved the time I spend in QGIS - PostGIS was not in vain.
The API of OpenTripPlanner was pretty neat though, it did mimic Google's route searching API as much as possible which I used in the past so parsing the results was quite easy.
----
Once we had all of the data ready, the final bit was converting it to something I can use in JavaScript. For this I used my trusted scripting language I use for such occasion for almost 20 years now: ruby. The only interesting part here was the use of Encoded Polylines (which is Google's standard of sending LineString information over inside JSON files), but yet again I did find enough tools to handle this pretty obscure format.
----
Final part was the display. While I usually used Leaflet in the past I really wanted to try OpenLayers, I had another project I had not yet finished where Leaflet was simply too slow for the data, and I had a very quick look at OpenLayers and saw it could display it with an acceptable performance, so I believed it might be a good opportunity for me to learn it. It was pretty okay, although I do believe transparent layers seem to be pretty slow under it without WebGL rendering, and I could not get WebGL working as it is still only available as a preview with no documentation (and the interface has changed completely in the last 2 months since I last looked at it). In any case OpenLayers was still a good choice - it had built in support for Encoded Polylines, GPX Export, Feature selection by hovering, and a nice styling API. It also required me to use Vita for building the application, which was a nice addition to my pretty lacking knowledge of JavaScript frameworks.
----
All in all this was a fun project, I definitely learned a lot I can use in the future. Seeing how well OpenTripPlanner is, and not just for public transport but also walking and cycling, did give me a couple new ideas I could not envision in the past because I could only do it with Google's Routing API which would have been prohibitively expensive. Now I just need to start lobbying for the Bus Services Act 2017 or something similar to be implemented in Scotland as well
21 notes
·
View notes
Text
I am happy to inform the public that there is a dataset of hair salons with puns in their name. It's all in French, but I can only applaud the effort and I hope that one day, similar work will be done for coffee shops, if only to simplify the work of authors wanting to check whether or not something is taken.
Names include such gems as Faudra Tiff Hair, United Hair Lines, Lucif'hair, No Peigne No Gain, and my personal favorite, Queer Chevelu.
3 notes
·
View notes
Text
Very nice work! Is this data available in GIS formats, such as ESRI Shapefile or GeoJSON? And what software did you use to prepare it and render the maps?
Hey All,
I've been away for some time, as we've been working really hard on something quite exciting:
let me present to you the world's first ever global ocean drainage basin map that shows all permanent and temporary water flows on the planet.

This is quite big news, as far as I know this has never been done before. There are hundreds of hours of work in it (with the data + manual work as well) and it's quite a relief that they are all finished now.
But what is an ocean drainage basin map, I hear most of you asking? A couple of years ago I tried to find a map that shows which ocean does each of the world's rivers end up in. I was a bit surprised to see there is no map like that, so I just decided I'll make it myself - as usual :) Well, after realizing all the technical difficulties, I wasn't so surprised any more that it didn't exist. So yeah, it was quite a challenge but I am very happy with the result.
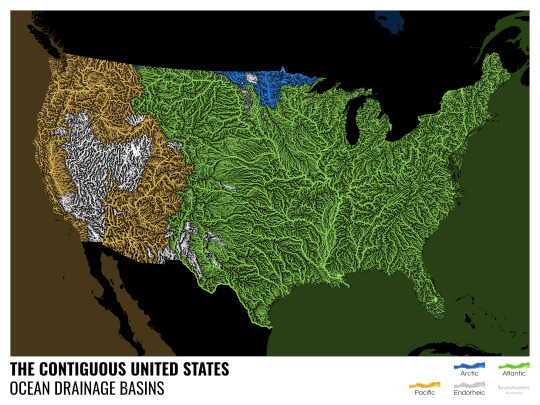
In addition to the global map I've created a set of 43 maps for different countries, states and continents, four versions for each: maps with white and black background, and a version for both with coloured oceans (aka polygons). Here's the global map with polygons:
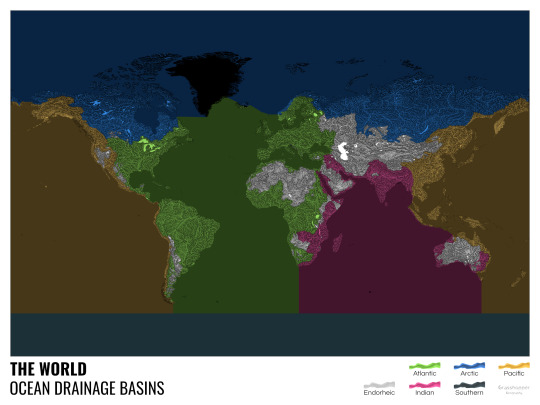
I know from experience that maps can be great conversation starters, and I aim to make maps that are visually striking and can effectively deliver a message. With these ocean drainage basin maps the most important part was to make them easily understandable, so after you have seen one, the others all become effortless to interpret as well. Let me know how I did, I really appreciate any and all kinds of feedback.
Here are a few more from the set, I hope you too learn something new from them. I certainly did, and I am a geographer.
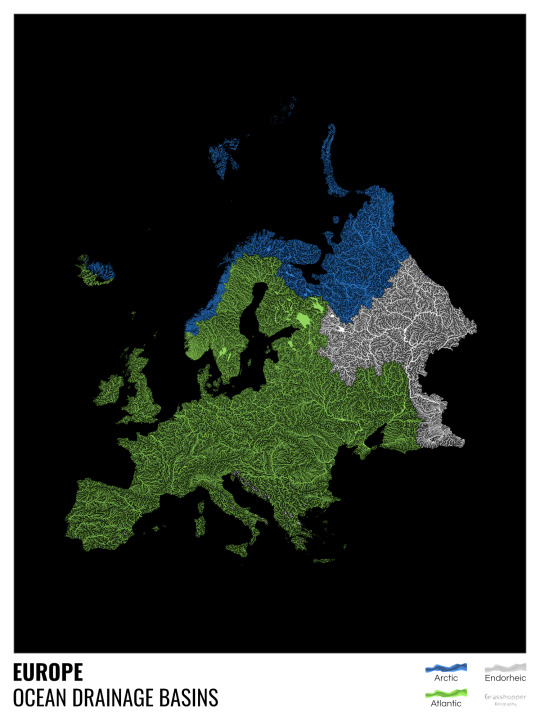
The greatest surprise with Europe is that its biggest river is all grey, as the Volga flows into the Caspian sea, therefore its basin counts as endorheic.
An endorheic basin is one which never reaches the ocean, mostly because it dries out in desert areas or ends up in lakes with no outflow. The biggest endorheic basin is the Caspian’s, but the area of the Great Basin in the US is also a good example of endorheic basins.
I love how the green of the Atlantic Ocean tangles together in the middle.
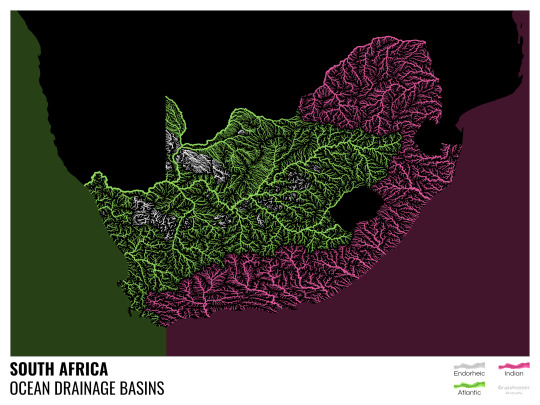
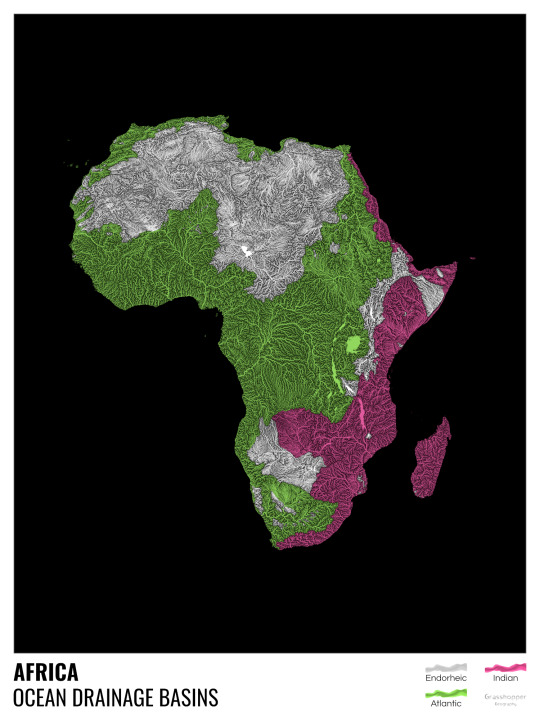
No, the dividing line is not at Cape Town, unfortunately.
I know these two colours weren’t the best choice for colourblind people and I sincerely apologize for that. I’ve been planning to make colourblind-friendly versions of my maps for ages now – still not sure when I get there, but I want you to know that it’s just moved up on my todo-list. A lot further up.
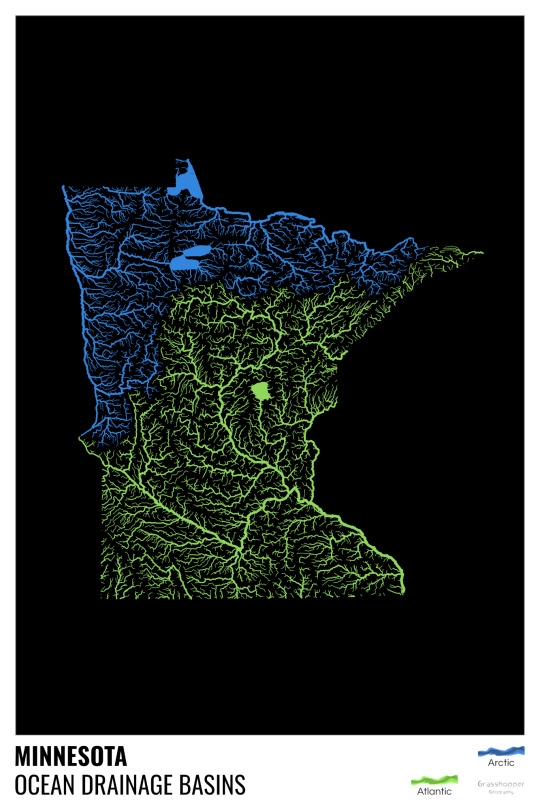
Minnesota is quite crazy with all that blue, right? Some other US states that are equally mind-blowing: North Dakota, New Mexico, Colorado, Wyoming. You can check them all out here.
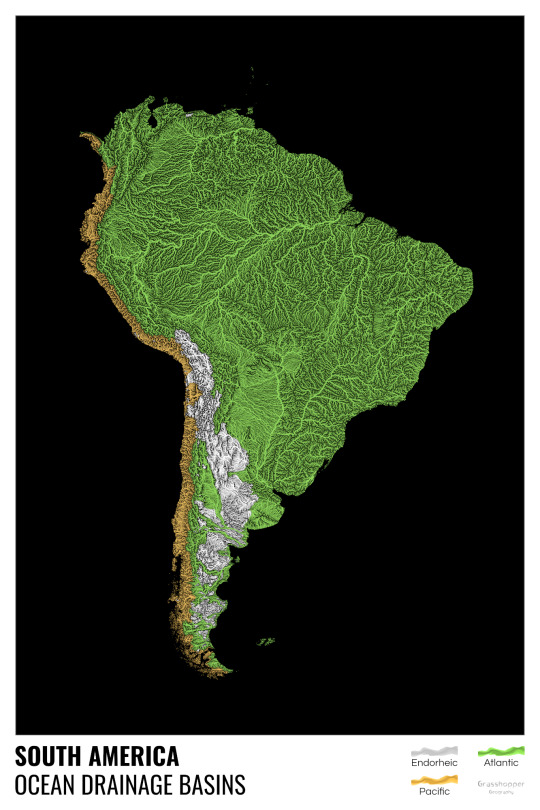
Yes, most of the Peruvian waters drain into the Atlantic Ocean. Here are the maps of Peru, if you want to take a closer look.
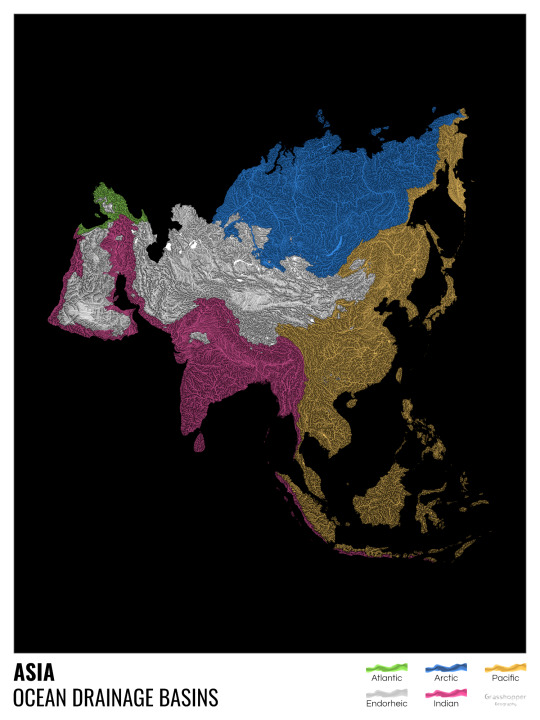
Asia is amazingly colourful with lots of endorheic basins in the middle areas: deserts, the Himalayas and the Caspian sea are to blame. Also note how the Indonesian islands of Java and Sumatra are divided.
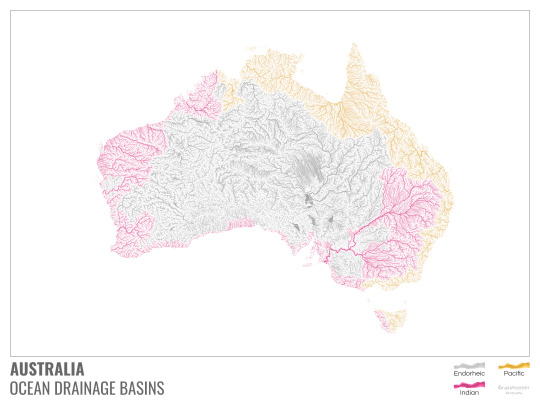
I mentioned earlier that I also made white versions of all maps. Here’s Australia with its vast deserts. If you're wondering about the weird lines in the middle: that’s the Simpson desert with its famous parallel sand dunes.
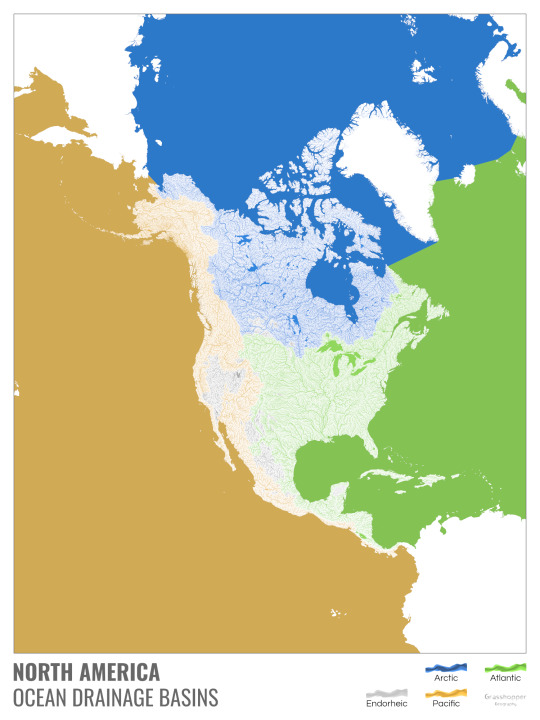
North America with white background and colourful oceans looks pretty neat, I think.

Finally, I made the drainage basin maps of the individual oceans: The Atlantic, the Arctic, the Indian and the Pacific. The Arctic is my favourite one.
I really hope you like my new maps, and that they will become as popular as my river basin maps. Those have already helped dozens of environmental NGOs to illustrate their important messages all around the world. It would be nice if these maps too could find their purpose.
17K notes
·
View notes
Text
The Ultimate Guide to Uploading GIS Data Formats

Uploading GIS data might seem like a simple, technical task, but it’s actually the foundation of every spatial analysis project. The way you bring your data into the system shapes how accurate and meaningful your final maps will be. Clean, well-structured data means your project can run smoothly and produce reliable insights. On the other hand, poorly prepared files can cause errors, mismatched coordinates, and inaccurate results.
GIS professionals know that data quality and format compatibility are key. Whether you're working with vector data like Shapefiles or GeoJSON, understanding the nuances of each format before uploading saves time and frustration. This early attention to detail ensures the spatial relationships and attributes are correctly interpreted by your GIS software.
Knowing your data’s coordinate system and metadata is also vital. Without this, your layers might not line up properly or display the information you expect. So, uploading GIS data isn’t just a routine task; it’s a critical stage that defines the success of your entire mapping project.
Choosing the Right Format for Your Uploads

Before uploading, it’s important to validate your files — confirm coordinate systems, check attribute tables, and ensure metadata is complete. Overlooking these steps often leads to failed uploads or incorrect map displays.
GIS workflows require flexibility to upload data in different formats like CSV, Excel, and vector files. Platforms like MAPOG are designed to meet these needs by offering an integrated data library feature. This allows users to incorporate datasets from earlier projects into their current maps, streamlining the workflow, promoting data reuse, and saving significant time in sourcing and preparing spatial data for analysis.
The Importance of Uploading GIS Data Correctly
The way you upload data can make or break your GIS project. Even the most sophisticated analyses depend on clean data input. Taking the time to prepare and upload your files correctly leads to more accurate maps and more confident decision-making.
Remember: in GIS, the first step is often the most important. A solid upload is the unsung hero behind every successful spatial project.
1 note
·
View note
Text
Mapextractor for Urban Planners: A Game Changer?
Urban planning is a complex process that requires accurate, up-to-date spatial data. From zoning and infrastructure to green space management and population analysis, every decision depends on high-quality geographic information. That’s where Mapextractor comes in—a tool that is rapidly becoming a game changer for urban planners around the world.
In this article, we’ll explore how Mapextractor is transforming urban planning and why it might be the tool your city development team has been waiting for.
🏙️ What Is Mapextractor?
Mapextractor is a web-based tool that allows users to select specific regions from a digital map and extract detailed geospatial data. With support for various file formats like GeoJSON, SHP, KML, and CSV, it’s designed to help users easily export map data for use in GIS platforms and planning software.
It offers features such as:
Area of Interest (AOI) selection
Layer-specific extraction (roads, buildings, parks, water bodies, etc.)
Multi-format export
Batch processing
API access for automation
🛠️ Why Urban Planners Need It
Urban planning requires extensive mapping work to analyze:
Land use and zoning
Transportation networks
Infrastructure layouts
Public amenities
Environmental impact zones
Traditional GIS platforms like ArcGIS or QGIS can perform these tasks but often require significant training and manual data preparation. Mapextractor simplifies this process, allowing planners to access ready-to-use data in minutes.
🌍 Key Features That Benefit Urban Planners
1. Quick Access to Accurate Data
Mapextractor allows planners to draw or input an exact AOI and instantly retrieve data on roads, buildings, green spaces, and more. This real-time extraction helps teams keep pace with tight project deadlines.
2. Multiple Export Formats
Whether you’re using ArcGIS, QGIS, or even Google Earth, Mapextractor delivers compatible file formats that integrate seamlessly with planning tools.
3. Layer Selection
Planners can extract only the data they need. For instance, if a transportation project is underway, they can isolate road networks and ignore other map layers, minimizing clutter and file size.
4. Cloud-Based and No Installation
Being entirely web-based, Mapextractor allows for collaboration across teams working remotely. There’s no need to install heavy GIS software on every computer.
5. Cost-Effective Solution
Mapextractor offers a free tier and affordable premium plans, making it ideal for small municipalities and consulting firms that might not have the budget for high-end GIS software.
🏗️ Use Case Examples
Transit Planning: Extract road and traffic data to optimize public transportation routes.
Zoning Analysis: Use building footprint data to identify high-density areas for rezoning.
Green Space Allocation: Analyze existing parks and green areas to plan for future development.
Emergency Services: Map existing fire stations, hospitals, and access roads for crisis response planning.
✅ Final Verdict: A True Game Changer
Mapextractor empowers urban planners by removing the technical barriers to geospatial data extraction. With its simplicity, flexibility, and speed, it's revolutionizing how cities and communities plan their growth.
If you're involved in urban development, infrastructure design, or land-use planning, Mapextractor is not just useful—it’s essential.
1 note
·
View note
Text
Arrays in GeoJSON
https://spatiallyadjusted.com/arrays-in-geojson
0 notes
Text
Geographic Information Systems (GIS) Development

Geographic Information Systems (GIS) have revolutionized the way we interact with spatial data. From city planning to environmental monitoring and logistics, GIS is a powerful tool that combines maps with data for smarter decision-making. In this post, we'll explore what GIS is, the technologies involved, and how to get started with GIS application development.
What is GIS?
GIS stands for Geographic Information Systems, which are tools and systems used to capture, store, analyze, manage, and visualize spatial or geographic data. These systems are essential for analyzing patterns, relationships, and geographic trends across various fields.
Applications of GIS
Urban Planning: Design infrastructure based on population density and land usage data.
Environmental Monitoring: Track climate changes, deforestation, or water quality.
Disaster Management: Map hazard zones and optimize emergency response logistics.
Transportation & Logistics: Optimize routes, manage traffic, and plan delivery systems.
Agriculture: Analyze crop health and soil conditions using satellite imagery.
Key Components of GIS Development
Data: Spatial data (coordinates, maps, images) and attribute data (information about the location).
Maps: Visual representations created from layers of geographic data.
Tools: GIS software and libraries for manipulating and analyzing the data.
Applications: Web or mobile interfaces for users to interact with spatial information.
Popular Tools and Libraries
QGIS: Open-source GIS desktop application for analyzing and visualizing spatial data.
ArcGIS: Enterprise-grade software suite by Esri, used for advanced GIS development.
Leaflet.js: Lightweight JavaScript library for creating interactive maps.
Mapbox: Modern mapping platform with customizable maps and location-based APIs.
GDAL/OGR: Libraries for raster and vector geospatial data manipulation.
PostGIS: A spatial database extender for PostgreSQL.
Basic GIS Development Workflow
Collect Geographic Data: Use satellite data, GPS devices, or public databases like OpenStreetMap.
Preprocess the Data: Clean, convert, and format the data (e.g., shapefiles, GeoJSON, KML).
Store Data: Use spatial databases like PostGIS to manage geodata efficiently.
Develop the Interface: Create web or mobile applications using Leaflet, Mapbox, or OpenLayers.
Analyze Spatial Relationships: Implement queries and analytics to derive insights.
Visualize the Results: Present data in layers, markers, and thematic maps.
Sample Project: Visualizing Population Density with Leaflet.js
<script> var map = L.map('map').setView([40.7128, -74.0060], 11); L.tileLayer('https://{s}.tile.openstreetmap.org/{z}/{x}/{y}.png').addTo(map); // Add GeoJSON layer L.geoJSON(populationData, { style: function (feature) { return { fillColor: getColor(feature.properties.density), weight: 1, opacity: 1, color: 'white', fillOpacity: 0.7 }; } }).addTo(map); </script>
Challenges in GIS Development
Handling large datasets and real-time updates.
Ensuring accuracy and relevance of geographic data.
Managing performance and rendering complex map layers.
Integrating with external services and APIs.
Conclusion
GIS development is a rewarding field that blends programming, data science, and geography. As more industries recognize the value of spatial insights, GIS applications will continue to play a vital role in shaping our world. Whether you're visualizing data on a map or building complex spatial analysis tools, GIS offers endless opportunities for developers to create impactful solutions.
1 note
·
View note
Text
SOBRE CHICAGO....
Este código em Python realiza uma análise de clusterização geo-temporal de eventos de violência armada, simulados para a cidade de Chicago. O objetivo principal é identificar padrões espaciais e temporais nesses eventos, agrupando-os em clusters com base em sua proximidade geográfica, temporal e outras características relevantes.
Funcionalidades e Melhorias:
Simulação de Dados:
O código inicia com a geração de um conjunto de dados simulados, representando eventos de violência armada. Esses dados incluem coordenadas geográficas (latitude e longitude), hora do evento, calibre da arma utilizada, proximidade de escolas e bares, taxa de desemprego e data do ocorrido.
Uma melhoria significativa foi a adição de variáveis temporais (dia da semana e mês) e uma simulação de densidade populacional, tornando a análise mais rica.
Engenharia de Features:
As variáveis categóricas (calibre, proximidade de escolas e bares) são transformadas em variáveis numéricas usando a técnica de "one-hot encoding".
Todas as variáveis numéricas são padronizadas usando o StandardScaler para garantir que tenham a mesma escala, o que é crucial para o algoritmo de clusterização.
Clusterização DBSCAN:
O algoritmo DBSCAN (Density-Based Spatial Clustering of Applications with Noise) é utilizado para agrupar os eventos. Este algoritmo é eficaz na identificação de clusters de formas arbitrárias e na detecção de outliers.
Uma melhoria importante é a otimização do parametro "eps" do DBSCAN, atraves do metodo do joelho.
Validação de Clusterização:
O código inclui métricas de avaliação (índice de silhueta e índice de Calinski-Harabasz) para quantificar a qualidade dos clusters gerados. Essas métricas fornecem informações sobre a coesão e separação dos clusters.
Visualização:
Os resultados da clusterização são visualizados usando a biblioteca Seaborn, mostrando a distribuição dos clusters no mapa de Chicago.
Para melhorar a visualização foi adicionado o plotly express, para uma melhor visualização da densidade dos incidentes.
Os dados são exportados em formato GeoJSON para facilitar a visualização em ferramentas de mapeamento geoespacial como Kepler.gl.
Considerações Importantes:
O código utiliza dados simulados, que podem não refletir a complexidade dos dados reais de violência urbana. A aplicação deste código a dados reais do Chicago Data Portal ou de outras fontes relevantes é essencial para obter resultados significativos.
A análise de violência urbana é um tema sensível, e é crucial considerar aspectos éticos e de justiça algorítmica ao trabalhar com esses dados. A atenção ao viés de dados e a proteção da privacidade são fundamentais.
É importante lembrar que esses dados já carregam consigo muitos vieses da sociedade, portanto muita cautela é mandatório ao analisar os resultados gerados pelos modelos.
Em resumo, este código fornece uma base sólida para a análise geo-temporal de eventos de violência armada. Ao incorporar dados reais e considerar as implicações éticas, ele pode ser uma ferramenta valiosa para entender e abordar esse problema complexo.
import pandas as pd import numpy as np from sklearn.preprocessing import StandardScaler, OneHotEncoder from sklearn.cluster import DBSCAN from sklearn.compose import ColumnTransformer from sklearn.pipeline import Pipeline from datetime import datetime from geopy.distance import geodesic import matplotlib.pyplot as plt import seaborn as sns import geopandas as gpd from sklearn.metrics import silhouette_score, calinski_harabasz_score from sklearn.neighbors import NearestNeighbors import plotly.express as px
Simulação de Dados Melhorada
np.random.seed(42) n = 1200 data = pd.DataFrame({ 'latitude': np.random.uniform(41.75, 41.85, n), 'longitude': np.random.uniform(-87.75, -87.60, n), 'hora': np.random.randint(0, 24, n), 'calibre': np.random.choice(['9mm', '.40', '.45', '.380'], n), 'proximidade_escola': np.random.choice(['Sim', 'Nao'], n, p=[0.2, 0.8]), 'proximidade_bar': np.random.choice(['Sim', 'Nao'], n, p=[0.5, 0.5]), 'desemprego': np.random.uniform(5, 25, n), 'data': pd.to_datetime(np.random.choice(pd.date_range('2023-01-01', '2023-12-31'), n)) })
Engenharia de Variáveis Melhorada
data['dia_semana'] = data['data'].dt.dayofweek data['mes'] = data['data'].dt.month data['densidade_populacional'] = np.random.poisson(lam=1500, size=n)
encoder = ColumnTransformer([ ('onehot', OneHotEncoder(), ['calibre', 'proximidade_escola', 'proximidade_bar']) ], remainder='passthrough')
Normalização e Pipeline
scaler = StandardScaler() pipeline = Pipeline([ ('encode', encoder), ('scale', scaler) ])
X = pipeline.fit_transform(data[['calibre', 'proximidade_escola', 'proximidade_bar', 'hora', 'desemprego', 'dia_semana', 'mes', 'densidade_populacional']])
Otimização de Parâmetros (Knee Method)
neigh = NearestNeighbors(n_neighbors=15) nbrs = neigh.fit(X) distances, _ = nbrs.kneighbors(X) distances = np.sort(distances[:, 14]) plt.plot(distances) plt.xlabel('Points') plt.ylabel('Distance') plt.title('Knee Method for Epsilon Selection') plt.show()
Clusterização DBSCAN com epsilon otimizado
eps = 1.5 # Ajuste com base no método do Knee db = DBSCAN(eps=eps, min_samples=15).fit(X) data['cluster'] = db.labels_
Validação de Clusterização
if len(np.unique(data.cluster)) > 1: print(f"Silhouette: {silhouette_score(X, data.cluster)}") print(f"Calinski-Harabasz: {calinski_harabasz_score(X, data.cluster)}") else: print("Métricas não aplicáveis - muito poucos clusters")
Visualização com Seaborn
plt.figure(figsize=(10, 8)) sns.scatterplot(data=data, x='longitude', y='latitude', hue='cluster', palette='tab10') plt.title('Clusterização de Tiroteios em Chicago - Simulação Melhorada') plt.xlabel('Longitude') plt.ylabel('Latitude') plt.legend(title='Cluster') plt.grid(True) plt.tight_layout() plt.show()
Visualização com Plotly Express
fig = px.density_mapbox(data, lat='latitude', lon='longitude', radius=5, zoom=9, mapbox_style='carto-darkmatter', title='Densidade de Tiroteios Simulados - Chicago') fig.show()
Exportação GeoJSON
gdf = gpd.GeoDataFrame(data, geometry=gpd.points_from_xy(data.longitude, data.latitude)) gdf.to_file('clusters_chicago_simulado_melhorado.geojson', driver='GeoJSON')
0 notes
Text
How to Add GIS Data to an Online Map?
Introduction
The key in producing detailed and interactive maps lies with the GIS (Geographic Information System) data. Be it visualizing changes in environmental elements, planning urban layout, or creating a travel story, adding GIS data to an online map reduces complex information into accessible visual forms.

Steps to Add GIS Data
Prepare Your GIS Data Ensure your data is in a compatible format like CSV, Shapefiles, or GeoJSON. Properly structure the data to include coordinates and attributes.
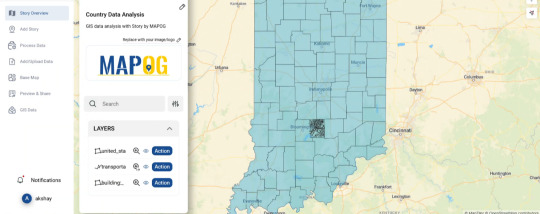
Choose the Right Platform Use platforms supporting interactive map creation with GIS data integration. For instance, tools like MAPOG allow users to input GIS data and layer it with additional visuals. The interesting thing is if you don’t want to upload data it’s ok, here you can visualize various data with the help of “GIS data” and if you want to analyze them just simply you can add them on map and start working.

Upload or Input Data
Log in to your chosen platform.
Select options to upload your data or enter it manually.
Preview to verify its accuracy.
Customize Map Features Utilize points, lines, or polygons to represent data visually. Add titles, descriptions, and other attributes for better context.
Use tools for analysis Utilize various kinds of tools for your spatial analysis to shape your work properly. Utilize various kinds of tools for your spatial analysis to shape your work properly. You can style your data in different ways to visualize properties and attributes, you can effortlessly upload vector and upload Excel or CSV data, incorporate existing layers, perform polyline splitting, use the Converter Tool for various formats, calculate isochrones, and utilize the Export Tool.
Enhance Visualization Adjust basemaps (road or satellite views) and layer options to improve clarity. For example, overlay a traffic signs layer on a transportation network.
Save and Share Export your map or publish it online for your audience.
Practical Example
Consider mapping urban green spaces: upload data with coordinates of parks, add size of the park and the facilities found in it and then combine this data with city traffic data for analysis.
Conclusion
GIS data analysis turns mere information into useful information. If you are in search of convenience in using tools for integrating GIS data into the interactive stories, platforms like MAPOG are resourceful. Curious? You should consider using such tools in order to improve your mapping projects today.
Have you used GIS tools for your projects? Share your experience below!
1 note
·
View note
Text
Building a Custom Geospatial Search Engine with Elasticsearch and GeoJSON
Building a Geospatial Search Engine with Elasticsearch and GeoJSON Introduction In today’s data-driven world, geospatial data has become increasingly important for various industries such as logistics, real estate, and environmental monitoring. Elasticsearch, a popular search and analytics engine, provides a robust solution for building geospatial search engines. GeoJSON, a format for encoding…
0 notes
Text
Top Tools and Techniques for Effective Geospatial Analysis
Geospatial analysis is the process of examining geographic data to uncover patterns, relationships, and trends. It plays a pivotal role across industries such as urban planning, environmental management, transportation, and marketing. By leveraging geospatial analysis, businesses and governments can make informed decisions backed by spatial insights.
In this blog, we’ll explore the top tools and techniques for effective geospatial analysis. Whether you're a beginner or an experienced professional, this guide will help you choose the right resources to enhance your geospatial capabilities.
What is Geospatial Analysis?
Geospatial analysis involves processing and analyzing geographic data—data tied to a specific location. This could be coordinates, addresses, or geographic boundaries. By visualizing and interpreting this data, organizations can:
Identify spatial patterns and trends.
Solve location-based challenges.
Make data-driven decisions.
Key Tools for Geospatial Analysis
1. Geographic Information Systems (GIS)
GIS tools are foundational for geospatial analysis. They allow users to visualize, manage, and analyze geographic data in layers, offering insights into spatial relationships.
Popular GIS Tools:
ArcGIS: A comprehensive platform by Esri, ArcGIS is widely used for mapping, spatial analysis, and data visualization. Its robust features include 3D mapping, predictive modeling, and integration with big data.
QGIS: An open-source alternative to ArcGIS, QGIS is free and highly customizable. It supports plugins for advanced spatial analysis and is ideal for those on a budget.
MapInfo Pro: Known for its user-friendly interface, MapInfo Pro is often used for business applications like market analysis and asset management.
2. Remote Sensing Software
Remote sensing tools analyze satellite or aerial imagery to gather data about the Earth's surface. This is particularly useful for environmental monitoring, agriculture, and urban development.
Popular Remote Sensing Tools:
Google Earth Engine: A cloud-based platform for analyzing geospatial data on a massive scale. It's widely used for environmental research and disaster response.
ENVI: Ideal for processing satellite and aerial imagery, ENVI offers advanced capabilities like spectral analysis and machine learning integration.
3. Spatial Data Visualization Tools
Visualization tools transform raw spatial data into intuitive maps and graphics, making it easier to communicate findings.
Popular Visualization Tools:
Tableau: Known for its ease of use, Tableau integrates geospatial data to create interactive visualizations.
Kepler.gl: An open-source tool designed for large-scale geospatial data visualization, offering features like heatmaps and time-based animations.
Carto: A cloud-based platform for spatial data analysis and visualization, Carto is particularly popular for business intelligence applications.
4. Programming Languages for Spatial Analysis
Programming languages like Python and R have libraries and packages specifically designed for geospatial analysis.
Key Libraries and Frameworks:
Python (Geopandas, Shapely, Folium, PySAL): Python’s libraries enable everything from data manipulation to advanced spatial statistics and web mapping.
R (sf, raster, tmap): R offers powerful tools for statistical modeling and spatial data visualization.
5. Geospatial Databases
Geospatial databases store and query spatial data efficiently. They are essential for handling large datasets and ensuring seamless analysis.
Popular Geospatial Databases:
PostGIS: An extension of PostgreSQL, PostGIS is widely used for storing and querying geographic objects.
SpatiaLite: A lightweight alternative to PostGIS, ideal for smaller projects.
MongoDB with GeoJSON: MongoDB supports geospatial indexing and queries using GeoJSON, making it suitable for web-based applications.
Top Techniques for Geospatial Analysis
1. Spatial Interpolation
Spatial interpolation estimates values at unsampled locations based on known data points. It’s widely used in meteorology, agriculture, and environmental science.
Common Methods:
Kriging
Inverse Distance Weighting (IDW)
Spline Interpolation
2. Hot Spot Analysis
Hot spot analysis identifies areas of statistically significant clustering. This is especially useful in crime analysis, disease tracking, and market research.
Tools for Hot Spot Analysis:
ArcGIS Spatial Statistics Toolbox
Python's PySAL library
3. Network Analysis
Network analysis examines the connectivity and flow within spatial networks, such as transportation systems or utility grids.
Applications:
Shortest path analysis for navigation systems.
Optimization of delivery routes for logistics.
Analysis of infrastructure vulnerability.
4. Change Detection
Change detection identifies differences in a location over time, often using remote sensing imagery.
Applications:
Monitoring deforestation and urban sprawl.
Assessing disaster impacts.
Analyzing agricultural productivity.
5. Geocoding and Reverse Geocoding
Geocoding converts addresses into geographic coordinates, while reverse geocoding converts coordinates into readable addresses.
Popular Tools:
Google Maps API
ArcGIS Geocoding Service
6. Spatial Regression
Spatial regression analyzes relationships between variables in a geographic context. It’s used in fields like economics, epidemiology, and environmental science.
Key Methods:
Ordinary Least Squares (OLS)
Geographically Weighted Regression (GWR)
7. Cluster Analysis
Cluster analysis groups spatial data points based on similarities. It’s useful for market segmentation, crime mapping, and disease outbreak analysis.
Common Techniques:
K-Means Clustering
DBSCAN
Hierarchical Clustering
Emerging Trends in Geospatial Analysis
AI and Machine Learning Integration Advanced algorithms are enhancing geospatial analysis, enabling predictive modeling and pattern recognition. For instance, machine learning models can classify satellite imagery or predict traffic flow.
Cloud-Based Geospatial Platforms Cloud computing enables the analysis of massive geospatial datasets without local hardware constraints. Platforms like Google Earth Engine and AWS provide scalable solutions.
3D and Real-Time Mapping 3D mapping tools like Esri's ArcGIS Pro offer realistic visualizations, while real-time data feeds enable dynamic mapping for applications like traffic monitoring.
Augmented Reality (AR) and Virtual Reality (VR) AR and VR are being used to create immersive geospatial experiences, such as virtual tours of urban developments or disaster simulations.
IoT and Geospatial Analysis Internet of Things (IoT) devices generate real-time spatial data, which can be analyzed for applications like smart city planning and environmental monitoring.
How to Choose the Right Tools and Techniques
The choice of tools and techniques depends on your project goals, data availability, and budget. Here are some tips:
Define Your Objectives: Clearly outline what you aim to achieve with geospatial analysis.
Assess Your Data: Determine the type, format, and volume of data you'll be working with.
Consider Scalability: For large-scale projects, opt for cloud-based tools or databases with high processing power.
Budget Constraints: Open-source tools like QGIS and Kepler.gl are great for cost-effective analysis.
Conclusion
Geospatial analysis is transforming the way we understand and interact with the world. With powerful tools like GIS software, remote sensing platforms, and programming libraries, combined with advanced techniques such as hot spot analysis and machine learning, the possibilities are endless. By selecting the right tools and applying the appropriate techniques, you can unlock the full potential of geospatial data and drive impactful decisions.
Start exploring the world of geospatial analysis today to stay ahead in this data-driven era!
1 note
·
View note
Text
PLEASE play side house chat it has sooo many scrapped rooms.
It got ported but if u dont care. Here it is anyways
0 notes