#how to trade using parabolic SAR indicator
Explore tagged Tumblr posts
Visit Tumblr Blog
Explore Tumblr blogs with no restrictions, modern design and the best experience.
Last Seen Tumblr Blogs


Fun Fact
Mobile US users spent an average of 115.8 minutes on Tumblr app monthly.
Text
Parabolic SAR Indicator | How Parabolic SAR Used in Trading

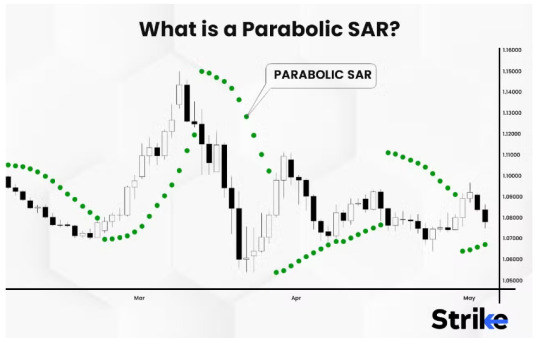
The Parabolic SAR (Stop and Reverse) is a popular technical indicator used in stock trading to help identify the direction of a trend and potential points where the trend might change.
The Parabolic SAR is a trend-following indicator that works best in a trending market rather than a sideways market. Dots placed below the price bars signal an uptrend while dots placed above the price bars signal a downtrend. This helps traders know the market direction. Hence, the first step in using the Parabolic SAR should be to analyse the market direction and the strength of the trend.
Read Full Blog: https://www.truedata.in/blog/what-is-parabolic-sar-indicator
0 notes
Text
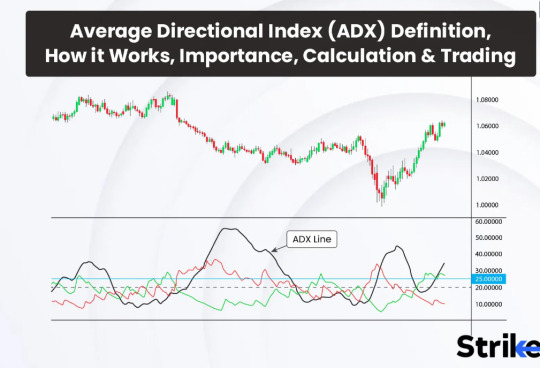
🧭 Complete Guide to Average Directional Index (ADX): How to Master Trend Strength in Trading
In the dynamic world of stock markets, identifying trend strength is often more important than identifying the trend direction. This is where the Average Directional Index (ADX) comes into play—an indicator designed not to tell you where the market is going, but how strongly it's going there. If you've ever been whipsawed in sideways markets or entered a trade too late, ADX can change your game.
Let’s decode this powerful tool—its origin, working logic, and how it helps traders, especially in the Indian stock market, with actionable insights using tools like Strike Money and TradingView.

📖 What Exactly Is the ADX? Think of It Like a Market Mood Detector
The Average Directional Index (ADX) is a technical analysis tool created by J. Welles Wilder Jr. in 1978 in his book New Concepts in Technical Trading Systems. Unlike trend-following indicators like Moving Averages, ADX doesn’t care if the market is bullish or bearish—it simply measures how strong a trend is, regardless of the direction.
👉 It’s part of a broader system called the Directional Movement Index (DMI) which includes:
DI+ (Positive Directional Indicator)
DI– (Negative Directional Indicator)
And finally, the ADX Line itself
Together, they help traders answer a crucial question: Is the current market movement strong enough to justify entering a trade?
📜 Origin Story: Why Welles Wilder’s ADX Still Dominates Modern Charts

Welles Wilder, also known for inventing the Relative Strength Index (RSI) and Parabolic SAR, built the ADX to solve a very real problem—traders were entering trends that had no strength. While some of his tools have evolved, ADX has stood the test of time.
Today, ADX is not only used by retail traders but also forms the backbone of many quantitative trading and algorithmic trading strategies, especially those deployed in high-volume exchanges like NSE and BSE.
🔍 How Does ADX Work? Here’s the Breakdown You Need
Let’s simplify what might otherwise look complex:
✅ DI+ measures bullish pressure ✅ DI– measures bearish pressure ✅ ADX quantifies the strength of the prevailing direction (regardless of whether it’s up or down)
For example, if DI+ is above DI– and ADX is rising, the uptrend is strong. If DI– is above DI+ and ADX is rising, the downtrend is strong.
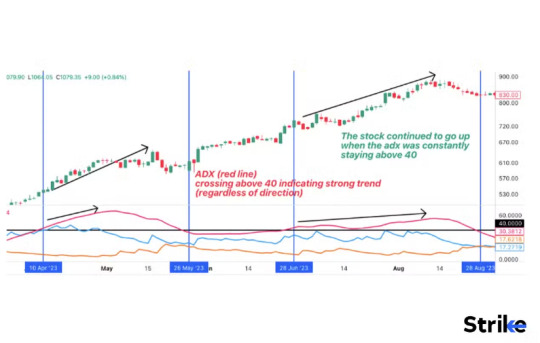
📈 When ADX > 25, most traders consider the trend strong 📉 When ADX < 20, markets are usually consolidating or ranging
🧪 Real-World Use: How ADX Predicted Breakouts in Indian Stocks

Let’s take Reliance Industries (RELIANCE.NS) as an example. In early April 2024, ADX crossed 30 on the daily chart while DI+ stayed significantly above DI–. What followed was a 12% breakout in just 9 trading days.
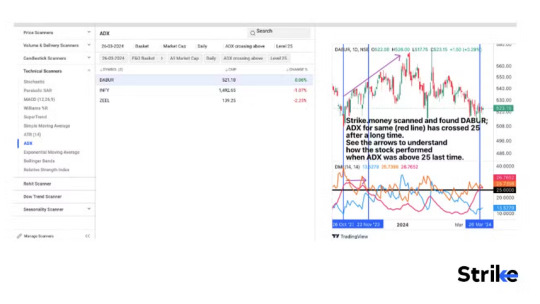
Another example is ICICI Bank (ICICIBANK.NS). In late October 2023, the ADX hovered below 20 for weeks, suggesting no trade. As soon as it crossed 25 in November—boom! The stock surged over 7% in two weeks.
You can spot these setups easily on platforms like Strike Money, where ADX is a built-in feature with customizable thresholds.
🧠 What ADX Values Really Mean (And Why Most Traders Misuse It)

⚡ ADX under 20: No strong trend. Avoid trend-following systems ⚡ ADX between 20–25: Trend is emerging. Prepare your setup ⚡ ADX 25–50: Strong trend. Ideal for entries ⚡ ADX over 50: Very strong trend. Be cautious of exhaustion ⚡ ADX over 70: Rare. Usually indicates overextension
One mistake many traders make is interpreting a falling ADX as a reversal signal. That's incorrect. A falling ADX just means the current trend is losing strength, not necessarily reversing.
🚦 How to Use ADX for Buy & Sell Decisions: A Practical Strategy
Here’s a simple setup many Indian swing traders use:
🔸 When ADX > 25, and DI+ > DI–, consider a long trade 🔸 Place stop loss just below the recent swing low 🔸 Exit when ADX flattens or DI– crosses above DI+
This exact setup worked wonders in Infosys (INFY.NS) in Jan 2024, producing a 9% gain over 6 sessions. When used with Strike Money, traders could visualize this setup using their adaptive ADX chart overlay.
🔗 Want Better Accuracy? Combine ADX with RSI & MACD
No indicator is a holy grail, but ADX shines when paired with others:
✅ Use ADX + RSI: Confirm strength with momentum. If RSI > 50 and ADX is rising—green signal! ✅ Use ADX + MACD: Confirm both trend and momentum direction. Works well in trending sectors like Auto and IT ✅ Use ADX + Moving Averages: MA crossovers work best when ADX confirms strength
For instance, in Tata Motors (TATAMOTORS.NS), combining ADX > 30 with a MACD bullish crossover in February 2024 produced a high-confidence trade that gained 18% in under a month.
🔎 Here’s When NOT to Use ADX (Yes, It Has Limitations)
🛑 Sideways Markets: ADX is nearly useless when markets are range-bound. It doesn’t predict breakout direction. 🛑 Scalping: On 1-min or 5-min charts, ADX lags significantly 🛑 Crypto Intraday: Due to volatility, crypto can fake trend strength
The best use-case remains swing trading on daily/weekly timeframes, particularly in well-structured markets like NSE.
🕒 What Timeframe Is Best for ADX in Indian Markets?
🧭 Daily Chart: Most reliable for delivery & swing traders 🧭 Weekly Chart: Best for long-term trend confirmation 🧭 1-Hour Chart: Useful for intraday traders, but cross-validate with volume
In Indian indices like NIFTY 50 and BANKNIFTY, ADX on daily charts often signals clean breakouts ahead of earnings seasons or policy announcements.
🛠️ Best Platforms to Use ADX Indicator (With Indian Data)
📌 Strike Money: Offers powerful ADX overlays with DI+ and DI– separation and custom alerts 📌 TradingView: Great for global comparisons with community scripts 📌 Zerodha’s Kite: Basic ADX available, but lacks advanced visuals
Strike Money stands out by offering pre-built ADX strategies, which users can activate with a single click. No need to manually calculate values.
🧩 Is ADX Still Useful in Today’s Algo-Driven Markets?
You might ask: In the era of AI, machine learning, and high-frequency trading, does ADX still matter? Yes—and here’s why.
💡 In a 2022 research paper by the CMT Association, it was found that combining ADX with moving average systems increased backtested returns by 18% over a 3-year horizon. 💡 Another study by NSE Data Labs in 2021 showed that high ADX values on large-cap stocks resulted in higher post-breakout momentum 82% of the time.
Even hedge funds use ADX in their quant models as a trend filter before deploying millions.
💬 Final Thoughts: Should You Use ADX in Your Trading Arsenal?
If you're a retail trader in India and still relying solely on price action or candlestick patterns, you're likely missing the bigger picture. ADX helps you measure what the naked eye often can't—the strength of conviction behind market moves.
While not foolproof, when paired with tools like MACD, RSI, or Strike Money’s smart chart system, ADX becomes a vital component in your trading toolbox.
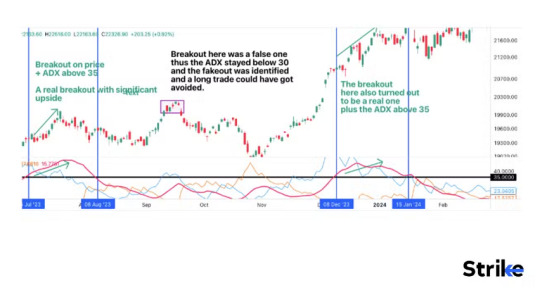
✅ Use ADX to avoid fakeouts ✅ Validate breakout trades with it ✅ Skip trend trades when ADX is low
Remember, trading is not just about being right—it’s about being right at the right time. That’s where ADX shines.
🙋♂️ FAQs About ADX You Should Know
❓ What is a good ADX value to enter a trade? 🔹 Above 25 is generally considered strong enough for trend trading.
❓ Can I use ADX alone? 🔹 Technically yes, but pairing with momentum indicators increases reliability.
❓ Is ADX suitable for crypto trading? 🔹 It's more effective in regulated markets like NSE, BSE, and less so in volatile crypto pairs.
❓ What’s the best platform for ADX charting? 🔹 Strike Money offers Indian data with clean, real-time ADX visuals and alerts.
Liked what you read? Explore more on Strike Money and discover ready-to-use ADX trading setups tailored for the Indian markets 📈
0 notes
Text
Smart Money Trading Indicator on TradingView: A Comprehensive Guide

In the world of trading, the quest for actionable insights and reliable tools is never-ending. TradingView has emerged as a leading platform for chart analysis and trading strategies. Among its myriad features and tools, smart money trading indicators stand out as a powerful resource for both novice and professional traders. This article dives deep into the concept of smart money trading, the indicators available on TradingView, and how to effectively leverage them for optimal results.
What is Smart Money Trading?
Smart money trading is a strategy that tracks the moves of institutional investors, often referred to as the “smart money.” These large players, such as hedge funds, banks, and professional traders, have the resources and knowledge to influence market movements significantly. By observing their trading patterns, retail traders can align their strategies with the market’s broader trends, increasing their chances of success.
Smart money trading indicators are designed to help traders identify key market dynamics, such as:
Liquidity zones: Areas where institutional traders are likely to enter or exit positions.
Volume spikes: Indications of significant market activity driven by large players.
Price imbalances: Insights into market inefficiencies where opportunities may lie.
Key support and resistance levels: Zones of high activity and potential reversals.
Popular Smart Money Trading Indicators on TradingView
TradingView offers a variety of indicators that cater to smart money trading strategies. These indicators are highly customizable, user-friendly, and come with detailed documentation. Here are a few noteworthy options:
Order Block Indicators: Highlight areas of institutional buying or selling, giving traders insights into potential future price movements.
Volume Profile Tools: Analyze trading activity at different price levels, revealing strong support and resistance areas.
Liquidity Sweep Alerts: Detect stop-hunt zones where smart money clears liquidity before a major price move.
Market Structure Tools: Identify breakouts, consolidations, and reversals in real-time.
MiyagiTrading: Revolutionizing Smart Money Indicators
MiyagiTrading is a trusted name in the TradingView community, offering cutting-edge best paid TradingView indicators designed to simplify and enhance your trading journey. Their suite of indicators combines precision, reliability, and ease of use, making them an excellent choice for traders of all levels.
Miyagi 10in1 Alerts & Backtest
A comprehensive tool that integrates ten powerful indicators into one. This all-in-one package allows traders to:
Generate real-time alerts for various trading conditions.
Backtest strategies with historical data to optimize performance.
Save time and boost accuracy with its user-friendly interface.
Miyagi 6in1 Alerts & Backtest
This versatile tool is tailored for traders seeking flexibility and efficiency. Key features include:
Six essential indicators in a single package.
Customizable alerts for quick decision-making.
A robust backtesting engine to validate strategies.
Miyagi 4in1 Alerts & Backtest
Perfect for traders who prefer simplicity without compromising effectiveness. Highlights include:
Four indispensable indicators for market analysis.
Alerts and backtesting capabilities for streamlined trading.
Miyagi PSAR & STrend
Designed for trend traders, this indicator excels in identifying market trends and momentum shifts. Features include:
A refined Parabolic SAR (PSAR) with added functionalities.
STrend analysis for detecting trend strength and direction.
Miyagi Backtester
A standalone backtesting tool that empowers traders to test any strategy thoroughly. Its advanced analytics ensure that you have complete confidence in your trading plan.
Why Choose MiyagiTrading Indicators?
User-Friendly: Intuitive design ensures a seamless experience for traders of all skill levels.
Customizable: Tailor the settings to match your unique trading style.
Proven Accuracy: Trusted by thousands of traders for their precision and reliability.
Comprehensive Support: Access detailed guides, tutorials, and responsive customer support.
Get Started with MiyagiTrading Today!
Take your trading game to the next level with MiyagiTrading’s premium indicators on TradingView. Whether you’re a beginner or a seasoned trader, these tools provide the edge you need to succeed in today’s dynamic markets.
Explore their offerings and gain access to the best-paid indicators for TradingView:
Miyagi 10in1 Alerts & Backtest
Miyagi 6in1 Alerts & Backtest
Miyagi 4in1 Alerts & Backtest
Miyagi PSAR & STrend
Miyagi Backtester
Don’t miss the opportunity to revolutionize your trading experience. Visit MiyagiTrading and start your journey to smarter, more informed trading today!
0 notes
Text
Understanding Forex Trend Indicators
In the world of foreign exchange trading, identifying the direction of a trend is crucial for making informed trading decisions. Forex trend indicators are tools that help traders determine whether a currency pair is trending upward, downward, or moving sideways. These indicators are fundamental for devising strategies and executing trades effectively. Let’s explore some of the most commonly used Forex trend indicators and how they can enhance your trading performance.

Moving Averages
Moving averages are among the most popular trend indicators. They smooth out price data to help identify the direction of the trend. The Simple Moving Average (SMA) calculates the average price over a specific number of periods, while the Exponential Moving Average (EMA) gives more weight to recent prices. By comparing different moving averages, such as the 50-period and 200-period, traders can identify potential buy or sell signals. When a shorter-term moving average crosses above a longer-term one, it may indicate an uptrend, while the opposite crossover could signal a downtrend.
Average True Range (ATR)
The Average True Range (ATR) measures market volatility rather than direction. However, understanding volatility is crucial for trend analysis. A higher ATR indicates increased volatility, which often accompanies strong trends. Traders use ATR to set stop-loss orders and to gauge the potential range of price movements. A rising ATR suggests that a trend may be gaining strength, whereas a declining ATR could indicate a potential reversal or weakening trend.
Moving Average Convergence Divergence (MACD)
The Moving Average Convergence Divergence (MACD) is a versatile indicator that combines moving averages with momentum analysis. It consists of two lines: the MACD line and the signal line. When the MACD line crosses above the signal line, it generates a bullish signal, suggesting the potential for an upward trend. Conversely, when the MACD line crosses below the signal line, it could indicate a bearish trend. The MACD also includes a histogram that represents the difference between the MACD and signal lines, providing additional insight into trend strength.
Bollinger Bands
Bollinger Bands consist of a middle band (SMA) and two outer bands that represent standard deviations from the SMA. The bands expand and contract based on market volatility. When the bands widen, it indicates increased volatility and potential trend strength. Conversely, when the bands contract, it suggests lower volatility and a potential trend reversal or consolidation. Traders use Bollinger Bands to identify potential entry and exit points based on price touching or breaching the bands.
Ichimoku Cloud
The Ichimoku Cloud is a comprehensive indicator that provides information on support and resistance levels, Forex Trading Robot, and momentum. It consists of five lines: Tenkan-sen, Kijun-sen, Senkou Span A, Senkou Span B, and Chikou Span. The area between Senkou Span A and Senkou Span B forms the “cloud.” Price above the cloud indicates an uptrend, while price below the cloud suggests a downtrend. The cloud’s thickness can also provide insights into the strength of the trend.
Parabolic SAR
The Parabolic SAR (Stop and Reverse) is a trend-following indicator that provides potential entry and exit points. It appears as dots on the chart, with dots below the price indicating an uptrend and dots above the price signaling a downtrend. The indicator helps traders set trailing stop-loss orders and recognize potential trend reversals.
0 notes
Video
youtube
Trading Mastery: MACD, ADX, Parabolic SAR Strategies Revealed,Market Success Blueprint with MACD, ADX, Parabolic SAR Techniques,Trading Mastery: MACD, ADX, Parabolic SAR Strategies Revealed,Market Success Blueprint with MACD, ADX, Parabolic SAR Techniques,Optimize Your Trades: MACD, ADX, Parabolic SAR Strategy Unveiled,Profitable Trading Secrets: MACD, ADX, Parabolic SAR Strategies,Strategic Trading Signals: MACD, ADX, Parabolic SAR Mastery,Maximize Profits with MACD, ADX, Parabolic SAR Trading Tactics,Proven Strategies: MACD ADX Parabolic SAR for Trading Success,Elevate Your Trading Game: MACD, ADX, Parabolic SAR Techniques,Mastering Market Trends: MACD, ADX, Parabolic SAR Strategies,Trade Like a Pro: MACD, ADX, Parabolic SAR Success Guide,MACD Trading Strategies,ADX Indicator Strategies,Parabolic SAR Trading Techniques,MACD ADX Trading Signals,How to Use Parabolic SAR Effectively,MACD Trading Tips and Tricks,ADX Indicator Explained for Traders,Parabolic SAR Trend Analysis,MACD ADX Strategy for Beginners,Mastering Parabolic SAR in Trading,
0 notes
Text
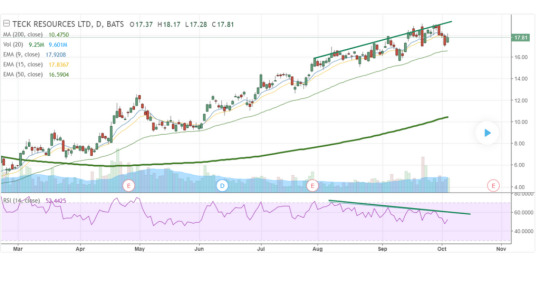
Polygon co-founder submitted a proposal to the ApeCoin DAO governance forum for the creation of its own zero-knowledge Layer-2 blockchain. APE has seen a significant decline in demand since the month began. In a new proposal dated 10 October, Polygon’s co-founder Sandeep Nailwal suggested that ApeCoin DAO develop its own zero-knowledge Layer-2 (zk-L2) blockchain using the Polygon Chain Development Kit (CDK). Read ApeCoin’s [APE] Price Prediction 2023-2024 The proposal comes nearly 18 months after Yuga Labs, the creators of the Bored Ape Yacht Club NFT collection, tweeted that ApeCoin “will need to migrate to its own chain in order to properly scale” following its “Otherside” NFT minting event in April 2022, which resulted in the highest gas fees in the history of the Ethereum [ETH] network. We're sorry for turning off the lights on Ethereum for a while. It seems abundantly clear that ApeCoin will need to migrate to its own chain in order to properly scale. We'd like to encourage the DAO to start thinking in this direction. — Yuga Labs (@yugalabs) May 1, 2022 The ApeCoin DAO voted in a later proposal to keep ApeCoin within the Ethereum ecosystem. However, the question of an ApeCoin-specific chain remains open. In his proposal, the co-founder argued in favor of Polygon’s CDK for the proposed zk-L2 network by highlighting its security, low fees, shared liquidity, customizability, and interoperability, making it suitable for achieving ApeCoin DAO’s goals. According to Nailwal: “ApeChain will provide the ApeCoin DAO with an efficient, secure, and decentralized execution environment upon which ApeCoin DAO projects can be built to help realize this mission.” APE holders have it rough At press time, the project’s native token APE traded at $1.04. In the last month, its price has declined by 10%, according to data from CoinMarketCap. The month so far has been marked by a drop in demand for the metaverse-based token. On 2 October, the token attained a price peak of $1.29 and has since declined by 19%. Source: CoinMarketCap An assessment of the movements of key momentum indicators on a daily chart lent credence to the above position. After the bears initiated a downtrend on 3 October, the token’s Relative Strength Index (RSI) and Money Flow Index (MFI), initially positioned above their respective center lines, began trending downwards. As of this writing, the token’s MFI approached the oversold zones at 28.34, while its RSI was spotted at 35.37. This suggested that token sell-offs have significantly exceeded accumulation in the last two weeks. Moreover, APE’s Parabolic Stop and Reverse (SAR) indicator – which identifies potential reversal points in an asset’s price direction- confirmed the market’s downtrend. How much are 1,10,100 APEs worth today? When the dots that make up the indicator are positioned above the price, it indicates a downtrend. Also, when these dots are closely packed together, it suggests that the trend is strong. All of these were true in APE’s case at the time of writing. Lastly, its Aroon Down Line (blue) at 78.57% indicated that the downtrend was strong, and APE’s most recent price low was reached relatively recently. Source: APE/USDT on TradingView
0 notes
Text
ADX and Parabolic SAR EAs: Trend Confirmation
Trend confirmation is a vital aspect of successful trading, allowing traders to validate the strength and direction of market trends before making trading decisions. Two popular technical indicators used for trend confirmation are the Average Directional Index (ADX) and the Parabolic Stop and Reverse (SAR). forex Expert Advisors (EAs) are frequently employed to automate trading strategies based on these indicators. In this article, we will explore the ADX and Parabolic SAR indicators, how EAs implement strategies using them, and the advantages of trend confirmation in trading.
1. Understanding the ADX and Parabolic SAR Indicators
What Is the ADX Indicator?
The Average Directional Index (ADX) is a technical indicator that measures the strength and direction of a trend. It is part of the Directional Movement System and is composed of three lines:
ADX Line: The ADX line quantifies the strength of the trend, with values ranging from 0 to 100. Higher values indicate a stronger trend, while lower values suggest a weaker or sideways market.
+DI Line: The Positive Directional Indicator (+DI) measures the strength of the uptrend. It is calculated by comparing the current high to the previous high.
-DI Line: The Negative Directional Indicator (-DI) measures the strength of the downtrend. It is calculated by comparing the current low to the previous low.
What Is the Parabolic SAR Indicator?
The Parabolic Stop and Reverse (SAR) is a trend-following indicator designed to identify potential reversal points in price trends. It places dots either above or below price candles, indicating the direction of the trend. When dots switch from being above to below the price, it suggests a potential trend reversal from bullish to bearish, and vice versa.
2. Implementing ADX and Parabolic SAR Strategies with EAs
EAs are used to automate trading strategies based on the ADX and Parabolic SAR indicators. Here's how EAs implement these strategies:
a. Strategy Definition
Traders define the ADX and Parabolic SAR strategy, specifying parameters such as the timeframes for these indicators, the conditions for trend confirmation, and the entry and exit criteria.
b. Market Analysis
The EA continuously analyzes market conditions by calculating the ADX and Parabolic SAR values based on historical and real-time price data.
c. Signal Generation
Based on the predefined strategy and the interaction of price with the ADX and Parabolic SAR, the EA generates trading signals. These signals indicate potential entry and exit points and the direction of the trade (long or short).
d. Order Execution
The EA automatically executes trades based on the generated signals. It can place market orders, limit orders, or stop orders, depending on the strategy's conditions.
e. Risk Management
Effective risk management is crucial when using ADX and Parabolic SAR-based strategies. EAs often incorporate stop-loss and take-profit levels based on these indicators or other risk management techniques.
f. Position Monitoring
The EA continuously monitors open positions, tracks changes in ADX and Parabolic SAR values, and makes adjustments as necessary. This may involve trailing stops, modifying take-profit levels, or closing positions.
3. Advantages of Trend Confirmation with ADX and Parabolic SAR EAs
a. Objective Trend Assessment: ADX and Parabolic SAR EAs provide objective signals for confirming trends, reducing emotional biases in trading decisions.
b. Versatility: These indicators can be applied to various asset classes and timeframes, making them adaptable to different trading preferences.
c. Improved Timing: Trend confirmation helps traders enter and exit trades at more opportune moments, potentially increasing profitability.
4. Considerations for Using ADX and Parabolic SAR EAs
a. Strategy Development: Traders should thoroughly understand the ADX and Parabolic SAR strategy they are using and consider backtesting it with historical data.
b. Risk Management: Implement proper risk management, including stop-loss and take-profit levels, to protect capital when trading with ADX and Parabolic SAR EAs.
c. Real-Time Monitoring: Continuously monitor the performance of trend confirmation strategies and be prepared to make adjustments if market conditions change.
In conclusion, ADX and Parabolic SAR EAs offer traders a valuable tool for confirming trends and making more informed trading decisions. The ability to objectively assess trend strength and potential reversals can enhance trading strategies and potentially lead to more profitable outcomes. However, traders should approach trend confirmation with a well-defined strategy, effective risk management, and continuous monitoring to maximize their effectiveness in navigating dynamic market conditions.
0 notes
Text
What are Trading Indicators?
If you're new to trading or looking to enhance your trading strategies, understanding trading indicators is a crucial step. Trading indicators are powerful tools that help traders analyze market conditions, identify trends, and make informed trading decisions. They are mathematical calculations applied to historical price and volume data, providing insights into potential entry and exit points, market strength, and trend reversals. By incorporating these indicators into your trading approach, you can gain a competitive edge and increase your chances of success in the financial markets. From trend-following indicators that highlight the direction of the market to oscillators that help identify overbought or oversold conditions, there is a wide range of trading indicators to choose from. Each indicator has its unique calculation methodology and interpretation. Some popular examples include Moving Averages, Relative Strength Index (RSI), Bollinger Bands, and MACD (Moving Average Convergence Divergence). These indicators can be applied to various financial markets, such as stocks, forex, commodities, and cryptocurrencies, enabling traders to make informed decisions across different asset classes. Are you ready to take your trading to the next level? By mastering the art of trading indicators, you can gain valuable insights into market trends, price movements, and potential reversals. Join me in my upcoming blog posts, where we'll explore different types of trading indicators in detail, learn how to use them effectively in your trading strategies, and uncover advanced techniques to maximize their effectiveness. Get ready to enhance your trading skills, make smarter trading decisions, and embark on a successful trading journey. Stay tuned and get ready to dive into the fascinating world of trading indicators! What is a Trading Indicator? Trading indicators are mathematical calculations or visual representations of market data that provide insights into the current and future direction of price movements in financial markets. These indicators are derived from various types of data, such as price, volume, or open interest, and are used by traders to identify potential trading opportunities, determine market trends, and make informed trading decisions. Types of Trading Indicators There is a wide range of trading indicators available, each designed to serve a specific purpose and provide unique insights into market dynamics. Let's explore some of the most commonly used types of trading indicators: Trend Following Indicators Trend following indicators are used to identify and confirm the direction of market trends. These indicators are particularly useful for traders who prefer to ride the momentum of an established trend. Some popular trend following indicators include Moving Averages, Average Directional Index (ADX), and Parabolic SAR. - Moving Averages: Moving averages calculate the average price over a specific period and help smooth out price fluctuations, making it easier to identify trends. - Average Directional Index (ADX): The ADX indicator measures the strength of a trend and helps traders determine whether a market is trending or ranging. - Parabolic SAR: The Parabolic SAR indicator is used to identify potential trend reversals and provides stop-loss levels for traders. Best Trend Following Indicators Oscillators Oscillators are indicators that fluctuate within a specific range, indicating overbought or oversold conditions in the market. These indicators are valuable for identifying potential turning points in the price and generating buy or sell signals. Commonly used oscillators include Relative Strength Index (RSI), Stochastic Oscillator, and Moving Average Convergence Divergence (MACD). - Relative Strength Index (RSI): The RSI measures the speed and change of price movements and is used to identify overbought or oversold conditions in the market. - Stochastic Oscillator: The Stochastic Oscillator compares the closing price of an asset to its price range over a specific period, helping traders identify potential reversals. - Moving Average Convergence Divergence (MACD): The MACD indicator is a versatile tool that combines trend-following and momentum elements. It provides signals based on the interaction between two moving averages. Oscillators Indicators Volume Indicators Volume indicators analyze the trading volume of a security and provide insights into the strength or weakness of a price movement. These indicators help traders confirm trends, identify potential reversals, and gauge market participation. Popular volume indicators include On-Balance Volume (OBV), Chaikin Money Flow, and Volume Weighted Average Price (VWAP). - On-Balance Volume (OBV): The OBV indicator measures buying and selling pressure based on the cumulative volume of a security. It helps traders confirm trends and anticipate trend reversals. - Chaikin Money Flow: The Chaikin Money Flow indicator combines price and volume data to measure the flow of money into or out of a security. It helps traders assess the strength of a price trend. - Volume Weighted Average Price (VWAP): The VWAP indicator calculates the average price weighted by trading volume. It is commonly used by day traders to identify potential support or resistance levels. Volume Indicators Volatility Indicators Volatility indicators measure the rate at which prices of a security fluctuate. These indicators help traders identify periods of high or low volatility, which can be useful for determining entry and exit points. Volatility indicators can also assist in setting appropriate stop-loss and take-profit levels. Some widely used volatility indicators include Bollinger Bands, Average True Range (ATR), and Donchian Channels. - Bollinger Bands: Bollinger Bands consist of a moving average (typically the 20-day simple moving average) and two standard deviation lines above and below the moving average. They expand and contract based on market volatility, providing insights into potential price breakouts or reversals. - Average True Range (ATR): The ATR indicator measures the average range between high and low prices over a specified period. It helps traders gauge the volatility of an asset and determine suitable stop-loss levels. - Donchian Channels: Donchian Channels plot the highest high and lowest low prices over a specified period. Traders can use these channels to identify breakouts and set stop-loss or take-profit levels. Volatility Indicators Sentiment Indicators Sentiment indicators gauge the overall sentiment or market psychology of traders and investors. These indicators help assess whether the market is bullish, bearish, or neutral, and can be valuable for contrarian trading strategies. Examples of sentiment indicators include the Put/Call Ratio, the Volatility Index (VIX), and the Commitment of Traders (COT) report. - Put/Call Ratio: The Put/Call Ratio compares the trading volume of put options to call options. A high ratio suggests bearish sentiment, while a low ratio indicates bullish sentiment. - Volatility Index (VIX): The VIX, also known as the "fear index," measures market volatility and investor expectations of future price fluctuations. It can be used as a contrarian indicator, with high levels indicating fear and potential buying opportunities. - Commitment of Traders (COT) report: The COT report provides insights into the positions of large traders, such as commercial hedgers and institutional investors. It helps traders assess the sentiment and positioning of market participants. Sentiment Indicators How to Use Trading Indicators Now that we have explored the different types of trading indicators, let's discuss how to effectively use them in your trading strategies. Keep in mind that trading indicators should not be used in isolation but rather in conjunction with other analysis techniques and risk management principles. Here are some key considerations when using trading indicators: Define Your Trading Goals and Strategy Before incorporating trading indicators into your approach, it's essential to define your trading goals and strategy. Determine your preferred trading style (e.g., day trading, swing trading, or long-term investing) and the financial markets you want to trade (e.g., stocks, forex, or commodities). This clarity will help you select the most relevant indicators for your trading objectives. Understand the Indicator's Calculation and Interpretation Each trading indicator has a specific calculation methodology and interpretation. Take the time to understand how the indicator is calculated and what signals or insights it provides. Read the indicator's documentation, consult reputable educational resources, or seek guidance from experienced traders to grasp its nuances fully. Avoid Indicator Overload While it may be tempting to use multiple indicators simultaneously, it's crucial to avoid indicator overload. Having too many indicators can lead to conflicting signals and confusion. Instead, focus on a few well-chosen indicators that complement each other and align with your trading strategy. Remember, quality over quantity. Combine Indicators for Confirmation One effective way to use trading indicators is to combine different types of indicators to confirm signals. For example, you can use a trend-following indicator to identify the overall trend and an oscillator to pinpoint potential entry or exit points within that trend. When multiple indicators align and generate signals in the same direction, it increases the probability of a successful trade. Implement Proper Risk Management While trading indicators can provide valuable insights, it's crucial to implement proper risk management strategies alongside their use. Here are some risk management principles to keep in mind: - Set Stop-Loss and Take-Profit Levels: Determine your risk tolerance and set appropriate stop-loss and take-profit levels for each trade. Stop-loss orders help limit potential losses if the market moves against your position, while take-profit orders allow you to secure profits when the price reaches your target. - Use Position Sizing: Calculate the appropriate position size for each trade based on your risk tolerance and the distance between your entry and stop-loss levels. Position sizing ensures that you don't risk an excessive amount of your capital on a single trade. - Diversify Your Portfolio: Avoid overexposure to a single asset or market. Diversify your portfolio by trading multiple assets or using different trading strategies. This helps spread your risk and reduce the impact of adverse price movements. - Practice Proper Capital Management: Only allocate a portion of your trading capital to any single trade. Avoid risking a significant portion of your funds on a single trade, as it can lead to substantial losses. Instead, divide your capital among multiple trades to diversify risk. - Regularly Review and Adjust: Continuously monitor your trades and assess their performance. If certain indicators or strategies are consistently underperforming, consider making adjustments or exploring alternative approaches. Regularly reviewing and adapting your trading plan is essential for long-term success. Advanced Strategies for Trading with Indicators Now that we have covered the basics of trading indicators and their usage, let's delve into some advanced strategies that can help you maximize their effectiveness. Multiple Time Frame Analysis One powerful technique is to perform multiple time frame analysis. Instead of relying solely on a single time frame, such as the daily chart, consider analyzing higher and lower time frames as well. For example, if you are trading based on a daily chart, also examine the weekly and hourly charts. This approach provides a broader perspective of the market and helps you identify trends and patterns that may not be evident on a single time frame. By aligning signals across multiple time frames, you can increase the probability of successful trades. For instance, if the daily chart indicates an uptrend, but the weekly chart shows a strong resistance level approaching, it may be wise to exercise caution and consider taking profits or adjusting your position size. Indicator Divergence Divergence occurs when the price of an asset moves in the opposite direction of the indicator. It often signifies a potential trend reversal or a weakening of the current trend. Divergence can be bullish or bearish. Bullish Divergence: Bullish divergence occurs when the price forms lower lows, but the indicator forms higher lows. It suggests that selling pressure is weakening, and a bullish reversal may be imminent. Traders can look for bullish divergence as a potential buying opportunity. Bearish Divergence: Bearish divergence occurs when the price forms higher highs, but the indicator forms lower highs. It indicates that buying pressure is diminishing, and a bearish reversal may be on the horizon. Traders can watch for bearish divergence as a signal to consider short positions or tighten stop-loss levels. Confirmation with Candlestick Patterns Candlestick patterns provide valuable insights into market sentiment and can be used to confirm signals generated by trading indicators. By combining the analysis of candlestick patterns with indicator signals, you can strengthen your trading decisions. For example, if a trend-following indicator generates a buy signal, look for bullish candlestick patterns, such as a bullish engulfing pattern or a hammer, to confirm the signal. Similarly, if an oscillator indicates overbought conditions, watch for bearish candlestick patterns, like a shooting star or a bearish engulfing pattern, to validate the potential reversal. Customizing Indicator Settings Most trading indicators come with default settings, but they can be adjusted to suit your trading style and preferences. Experimenting with different parameter settings can help fine-tune the indicators for improved accuracy. For instance, moving averages have different periods (e.g., 20-day, 50-day, or 200-day). Shorter periods are more sensitive to price movements, while longer periods provide a smoother average. Find the balance that aligns with your trading strategy and the time frame you are analyzing. Backtesting and Optimization Before implementing any indicator-based strategy in live trading, it is essential to backtest and optimize the strategy using historical data. Backtesting involves applying your trading rules to past market data to assess their performance. This process helps you evaluate the profitability and reliability of your strategy before risking real capital. Additionally, optimization allows you to test different indicator settings and parameters to find the optimal configuration for your strategy. Remember to use out-of-sample data to validate your optimized strategy to ensure it is not overfitting to past data. Combine Indicators from Different Categories Another approach is to combine indicators from different categories to gain a more comprehensive view of the market. For example, you can combine a trend-following indicator, such as the Moving Average, with an oscillator, such as the Relative Strength Index (RSI), to identify potential entry points within an established trend. By using indicators from different categories, you can leverage the strengths of each indicator and increase the robustness of your trading strategy. For instance, you could wait for a trend-following indicator to confirm the direction of the market trend. Once the trend is established, you can then look for oversold or overbought conditions using an oscillator to pinpoint favorable entry or exit points within that trend. This combination helps you align your trades with the prevailing trend while also considering market momentum. Remember, it's important to strike a balance and avoid overcrowding your charts with too many indicators. Focus on a few well-chosen indicators that complement each other and provide meaningful insights into the market conditions you are trading. Practice Discipline and Patience Trading with indicators requires discipline and patience. Avoid the temptation to enter trades solely based on a single indicator signal. Wait for additional confirmation from other indicators or analysis techniques before executing a trade. By exercising patience and waiting for high-probability setups, you can increase your chances of success. Additionally, stick to your trading plan and avoid impulsive decisions based on short-term market fluctuations. Trust the signals generated by your indicators and follow your predefined risk management rules consistently. Continual Learning and Adaptation The financial markets are dynamic and ever-changing, requiring traders to continually learn and adapt. Stay updated with the latest developments in trading indicators and techniques. Explore new indicators, study different trading strategies, and analyze market conditions to refine your approach. Engage with trading communities, participate in forums or webinars, and read educational materials to gain insights from experienced traders. Continual learning and adaptation will help you stay ahead of the curve and enhance your trading skills over time. Conclusion Trading indicators are powerful tools that can provide valuable insights into market trends, momentum, and potential reversals. By understanding the different types of indicators, employing advanced strategies, and combining indicators effectively, you can enhance your trading decisions and improve the overall profitability of your trades. However, it's important to remember that indicators are not infallible and should always be used in conjunction with other analysis techniques and risk management principles. Developing a robust trading strategy that incorporates indicators while considering market conditions and individual preferences is key to successful trading. Remember, trading requires practice, discipline, and continual learning. Regularly assess and evaluate your trading performance, adapt your strategies as needed, and always prioritize risk management. With time, experience, and a deep understanding of trading indicators, you can navigate the financial markets with confidence and increase your chances of achieving consistent profitability. FAQs What are trading indicators? Trading indicators are mathematical calculations applied to historical price and volume data in the financial markets. They help traders analyze market conditions, identify trends, and make informed trading decisions. These indicators provide insights into potential entry and exit points, market strength, and trend reversals. They come in various types, such as trend-following indicators, oscillators, volume-based indicators, and volatility indicators. How do trading indicators work? Trading indicators work by processing historical market data to generate signals or graphical representations that traders can interpret. They use mathematical formulas and statistical calculations to identify patterns, trends, and potential market conditions. Traders can use these indicators to confirm or validate their trading strategies, identify buying or selling opportunities, and manage risk. What are some commonly used trading indicators? There is a wide range of trading indicators available, and the choice of which to use depends on the trader's trading style and preferences. Some commonly used trading indicators include Moving Averages, Relative Strength Index (RSI), Bollinger Bands, MACD (Moving Average Convergence Divergence), Stochastic Oscillator, and Fibonacci retracement levels. Each indicator has its specific calculation method and interpretation, providing different insights into the market. Can trading indicators guarantee profitable trades? Read the full article
0 notes
Link
#candlestickpatterns#forexmarketanalysis#Forextrading#momentumindicators#movingaverages#oscillators#supportandresistance#technicalindicators#tradingstrategies#trendanalysis
0 notes
Photo
How to Use ADX (Average Directional Index) in Forex
Average Directional Index or ADX Indicator referred to as a “market strength indicator.” ADX indicator invented by J. Welles Wilder. Pioneer in technical analysis who also devised the Relative Strength Index Indicator, the Parabolic SAR, and many other indicators. ADX is a technical analysis tool that traders may use to gain a better read on the broader market.
Visit: https://www.milliva.com/blog/know-how-to-use-adx-indicator-in-your-forex-trading/ Follow Us
Blog: https://www.milliva.com/blog
Instagram - https://www.instagram.com/millivafx
Twitter - https://twitter.com/milliva_fx
Linked in - https://www.linkedin.com/in/milliva-fx-386902221
Facebook - https://www.facebook.com/Millivaforex
#milliva #forex #Trading #trader #currencypairs #money #investment #profit #bonus #welcomebonus #freedeposit #fx #trending #new #updates #successful #forexmarket #trade #strategies #ideas #top #topper #daytrading #forexsignal #fxsignal #fxgraph #stock #business #invest #finance
0 notes
Text
Maximizing Trading Potential: Parabolic SAR, MACD, and Moving Averages Strategy
In the realm of trading, employing a combination of technical indicators can significantly enhance your decision-making process and overall profitability. This post explores the synergy between Parabolic SAR (Stop and Reverse), MACD (Moving Average Convergence Divergence), and Moving Averages, offering insights into how traders can leverage these tools effectively for informed trading…
View On WordPress
#Day trading techniques#How to use Parabolic SAR and MACD#MACD trading strategy#Moving Averages trading tips#Parabolic SAR strategy#Profitable trading strategies#Risk management in trading#Technical analysis for traders#Trading indicators explained#Trend following strategies
0 notes
Text
✅ Complete Guide to Parabolic SAR: How This Powerful Indicator Can Transform Your Trades
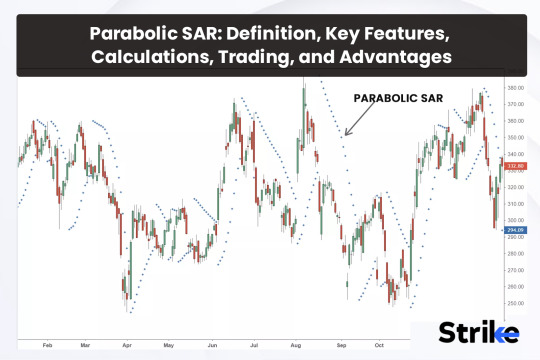
If you're searching for a way to catch trends early and ride them until they reverse, the Parabolic SAR (Stop and Reverse) could be your answer. Invented by J. Welles Wilder Jr., this indicator helps traders pinpoint entry and exit points in trending markets.
In this complete guide, we’ll break down everything: how it works, the formula, real-world examples from the Indian stock market, strategy insights, and how to use it on platforms like Strike Money and TradingView.
Let’s dive in 👇

🚀 What is Parabolic SAR and Why Do Traders Love It?
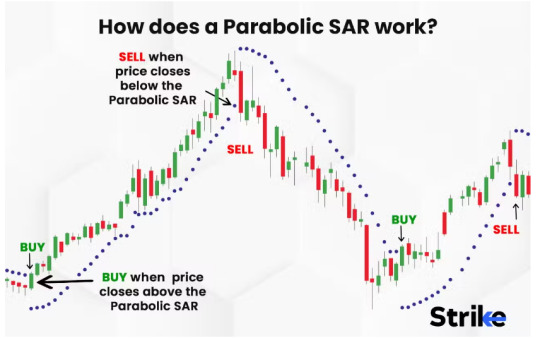
The Parabolic SAR (Stop and Reverse) is a trend-following indicator plotted as dots above or below price. When the dots flip, it signals a possible trend reversal.
✅ Dots below the price → bullish signal ✅ Dots above the price → bearish signal
This indicator is popular because it provides visual clarity on trend direction and possible stop-loss placements. Traders across forex, stocks, and crypto markets use it to time their entries and exits.
Fun fact: The Parabolic SAR is part of Wilder’s legendary contributions, alongside RSI and ATR.
In the context of the Indian stock market, you’ll often spot traders using it on Nifty 50, Bank Nifty, and liquid stocks like Reliance Industries, TCS, and Infosys.
📜 The Story Behind Parabolic SAR: Wilder’s Quest for Better Trends
In 1978, J. Welles Wilder Jr. introduced the Parabolic SAR in his book New Concepts in Technical Trading Systems. Wilder wanted an indicator that could lock in profits as trends matured without exiting too early.
He coined the term “parabolic” because the indicator’s path curves as the trend accelerates, and “stop and reverse” because it suggests reversing position when the trend flips.
Today, it’s built into platforms like Strike Money and TradingView, making it accessible to traders worldwide.
🧮 Decoding the Parabolic SAR Formula (Don’t Worry, We’ll Simplify It)
Here’s the official formula:
👉 SAR (new) = SAR (prior) + AF × (EP – SAR prior)
Where:
✨ SAR = Stop and Reverse ✨ AF = Acceleration Factor (starts at 0.02, increases by 0.02 up to 0.20) ✨ EP = Extreme Point (highest high or lowest low)
In simple terms, the SAR moves closer to the price as the trend continues. The stronger the trend, the faster SAR catches up.
💥 Example from the Indian market: Suppose you’re trading Reliance Industries trending upwards from ₹2300 to ₹2450. The SAR dots will trail the price below, moving upward daily. Once the price reverses below the SAR dot, it signals an exit or short entry.
On Strike Money, you can apply this formula automatically—no manual calculation needed.
👀 How to Read Parabolic SAR Dots: Signals Made Simple
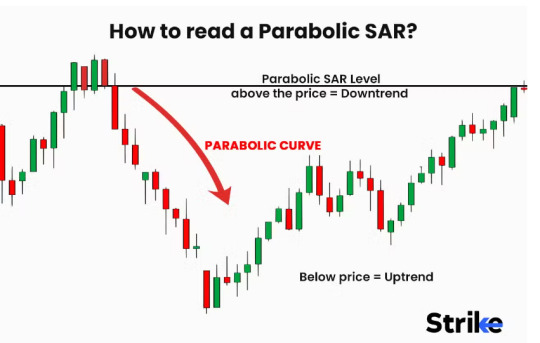
Reading Parabolic SAR is intuitive:
✅ When dots appear below candles, the trend is up → stay long or consider buying ✅ When dots flip above candles, the trend is down → exit longs or go short
⚠️ But here’s a caution: In sideways markets, the Parabolic SAR gives false signals because it’s designed for trending conditions.
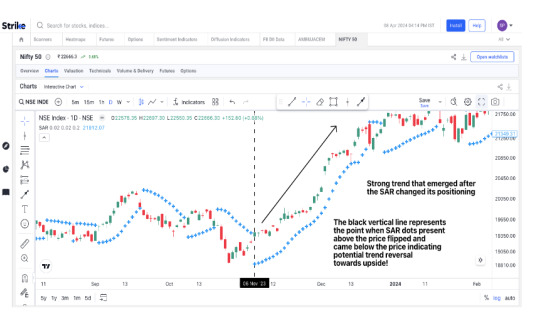
👉 Real-world example: On Nifty 50, during a trending rally post-election results, the SAR dots kept trailing neatly below candles from 18,000 to 19,200. But during choppy pre-budget sessions, SAR flipped multiple times—leading to whipsaws.
Pro tip: Always combine Parabolic SAR with other indicators like RSI or MACD to filter signals.
💡 Powerful Parabolic SAR Strategies for Indian Stock Traders
Here’s how traders use Parabolic SAR effectively:
🔹 Trend-following strategy: Enter trades in the direction of the dots. Example: Dots below Reliance’s breakout → stay long until dots flip.
🔹 Trailing stop-loss strategy: Move your stop-loss along the SAR dots as the trend advances. On Strike Money, you can visually drag your stop-loss to align with SAR.
🔹 Intraday trading: On 15-min charts of Bank Nifty, many scalpers use Parabolic SAR to trail fast moves post-market open.
👉 Important stat: A study published by Investopedia found that Parabolic SAR performs best in strong trends but loses accuracy in sideways action.
In Indian equities, trending phases like post-RBI policy moves or earnings breakouts are ideal windows for this indicator.
⚙️ Best Settings for Parabolic SAR: Should You Stick to Default?
By default, the acceleration factor is 0.02 and maximum 0.20. But here’s what traders found:
✅ For intraday on Nifty or Bank Nifty, some lower AF to 0.01 to reduce false flips ✅ For positional trades on daily charts, default 0.02 works fine ✅ For volatile stocks like Adani Enterprises, reducing AF helps avoid premature exits
On Strike Money, you can tweak these settings and visually backtest how dots behave historically.
📊 A backtest conducted on Nifty 50 from 2020–2023 showed that combining default Parabolic SAR with a 50-period EMA filter reduced false signals by 27% during range-bound phases.
🤝 Why Combining Parabolic SAR With Other Indicators Boosts Accuracy
Parabolic SAR works best with confirmation from other tools:
✨ RSI filter: Only take buy signals when RSI > 50, sell signals when RSI < 50 ✨ MACD filter: Use Parabolic SAR flips only when MACD line is above/below signal line ✨ Moving Average crossover: Enter trades when SAR flip aligns with MA crossover
Example: On Infosys daily chart, combining Parabolic SAR with a 200 EMA helped traders avoid false sell signals during a long-term bullish run.
On Strike Money, overlaying indicators is seamless—enabling multi-layered confirmations.
⚠️ When Not to Use Parabolic SAR: Beware These Traps
Many beginners misuse Parabolic SAR by:
❌ Using it in sideways markets → leads to frequent whipsaws ❌ Ignoring news events → sudden gaps make SAR flip incorrectly ❌ Applying on illiquid stocks → price gaps distort dots
👉 Example: In mid-cap stocks with poor liquidity, SAR dots may jump drastically, misleading traders.
A 2022 backtest by TradingView analysts showed Parabolic SAR had 65% accuracy in trending phases but dropped below 40% in range-bound conditions.
✅ Always check if the market is trending or consolidating before relying solely on SAR.
🔍 Backtesting Parabolic SAR: What Do the Numbers Say?
Let’s talk data.
A backtest on Nifty 50 (2018–2023) using default Parabolic SAR settings revealed:
📈 Trend trades captured 68% of total swing moves 📉 Sideways phases caused 9 false signals per quarter ⚡️ Combining SAR with RSI >50 filter reduced false signals to 4 per quarter
Similarly, on HDFC Bank daily chart (2021–2023), trailing with Parabolic SAR dots locked in an average of 12% higher profit vs. fixed stop-loss exits.
On Strike Money, traders can replay historical charts to visually see how SAR signals unfolded—an invaluable tool for testing strategies before risking capital.
🙋♂️ Frequently Asked Questions About Parabolic SAR
❓ Is Parabolic SAR better than Moving Average? 👉 Different purposes. SAR trails stop-loss; MA smooths trends. Best used together.
❓ Does Parabolic SAR repaint? 👉 No. Once a candle closes, the dot position doesn’t repaint.
❓ What’s the best timeframe? 👉 Works well on 1-hour or daily charts. Shorter timeframes increase noise.
❓ Can I use Parabolic SAR for intraday trading? 👉 Yes, but combine with volume/RSI for better accuracy on Bank Nifty/Index Futures.
❓ How do I set stop-loss using Parabolic SAR? 👉 Place your stop at the SAR dot level, moving it as dots update each session.
🎯 Is Parabolic SAR Right for You? Here’s the Verdict
If you’re a trend trader looking for a dynamic trailing stop that adapts as the market moves, the Parabolic SAR deserves a spot in your toolkit.
✅ Best in trending stocks/indices like Reliance, TCS, Nifty 50 ✅ Best paired with RSI, MACD, or EMA filters ✅ Avoid using alone in sideways markets or illiquid counters
With platforms like Strike Money, applying Parabolic SAR is effortless—you can tweak settings, overlay with other indicators, and backtest strategies visually.
Whether you’re trading stocks, forex, or crypto, understanding how the Parabolic SAR works can help you lock in profits, cut losses, and ride trends with confidence.
Ready to test it out? Open your Strike Money chart, add Parabolic SAR, and start tracking those dots today 👨💻📊
0 notes
Text
Best Technical Indicator for Trend Reversal: A Comprehensive Guide
When it comes to successful trading, identifying trend reversals is one of the most crucial skills you can develop. Spotting a reversal before the market fully shifts direction can help you get in or out of a trade at just the right moment. But how do you accurately predict trend reversals? This is where technical indicators come in handy. In this guide, we’ll explore the best technical indicators for trend reversal, their advantages, and how you can use them effectively in your trading strategy.
1. Moving Average Convergence Divergence (MACD)
The Moving Average Convergence Divergence (MACD) is one of the most popular technical indicators used by traders to identify trend reversals. It consists of two moving averages that oscillate around a zero line, providing valuable insights into momentum shifts. A crossover of the MACD line and the signal line is often used as a signal for potential trend reversals.
How to Use MACD for Trend Reversals: When the MACD line crosses above the signal line, it could indicate a potential bullish reversal. Conversely, when the MACD line crosses below the signal line, it may signal a bearish reversal. Traders often look for divergence between MACD and price action as an additional confirmation of a trend reversal.
2. Relative Strength Index (RSI)
The Relative Strength Index (RSI) is another powerful indicator for spotting trend reversals. RSI measures the strength of a security’s price action by comparing the average gains and losses over a specified period, typically 14 days.
How to Use RSI for Trend Reversals: The RSI moves between 0 and 100. When the RSI is above 70, it is considered overbought, which may suggest a potential bearish reversal. On the other hand, an RSI below 30 indicates that the market is oversold, hinting at a possible bullish reversal. Divergence between RSI and price action is also a strong signal for an upcoming trend reversal.
3. Bollinger Bands
Bollinger Bands are another useful tool for identifying trend reversals. Bollinger Bands consist of a middle band, which is a moving average, and two outer bands that represent standard deviations of the price.
How to Use Bollinger Bands for Trend Reversals: When the price moves outside the Bollinger Bands, it often indicates that the asset is overextended, and a reversal may be imminent. Traders look for price rejection at the bands and confirmation in the form of candlestick patterns to anticipate a reversal.
4. Stochastic Oscillator
The Stochastic Oscillator is a momentum indicator that can also be useful for predicting trend reversals. It compares the closing price of an asset to its price range over a certain period to determine the strength of a trend.
How to Use the Stochastic Oscillator for Trend Reversals: When the Stochastic lines cross above 80, it suggests that the market is overbought, indicating a possible trend reversal to the downside. Conversely, when the Stochastic lines cross below 20, it indicates that the market is oversold, signaling a potential bullish reversal.
5. Parabolic SAR
The Parabolic Stop and Reverse (SAR) is a trend-following indicator designed to highlight potential points where a trend might reverse.
How to Use Parabolic SAR for Trend Reversals: The Parabolic SAR plots dots above or below price bars. When the dots switch from being below to above the price, it indicates a potential bearish reversal. Conversely, when they move from above to below the price, a bullish reversal is likely. Traders often use Parabolic SAR along with other indicators like RSI or MACD for better accuracy.
6. Fibonacci Retracement Levels
Fibonacci Retracement is not a typical technical indicator, but it can provide valuable insight into where trend reversals are likely to occur. The key Fibonacci levels (23.6%, 38.2%, 50%, 61.8%) are often used to anticipate areas of potential support or resistance where the price might reverse.
How to Use Fibonacci Retracement for Trend Reversals: During an uptrend, if the price retraces to a key Fibonacci level and finds support, it could signal the end of the pullback and the start of a reversal back to the uptrend. Similarly, in a downtrend, Fibonacci levels can help predict resistance levels where a bearish reversal might occur.
Conclusion: Choosing the Best Indicator for Trend Reversals
Identifying the best technical indicator for trend reversal ultimately depends on your trading style, experience, and preference. Indicators like MACD, RSI, Bollinger Bands, Stochastic Oscillator, Parabolic SAR, and Fibonacci Retracement are all effective in identifying potential trend reversals. To improve the accuracy of your predictions, it’s often recommended to use a combination of these indicators along with proper risk management techniques.
Remember that no indicator can provide a 100% guarantee of a trend reversal. Market conditions and external factors also play a significant role in price movements. Always test and backtest your strategies before applying them in a live market.
If you’re looking for more insights and tools to enhance your trading strategy, visit Miyagi Trading. At Miyagi Trading, we provide the best trading resources, indicators, and expert advice to help you stay ahead of the market. Whether you’re a beginner or an experienced trader, our goal is to help you make informed decisions and achieve consistent results. Explore our range of tools and start improving your trading skills today!
0 notes
Text
Super Trend Indicator
Super fashion is easy and smooth to apply indicator and offers a unique studying approximately an ongoing fashion. It is constructed with parameters, particularly duration and multiplier.
The Buy and Sell sign modifies as soon as the indicator tosses over the last fee. When the Super fashion closes above the Price, a Buy sign is generated, and while the Super fashion closes underneath the Price, a Sell sign is generated.
The default values used at the same time as building a super indicator are for common authentic range. The great appropriate fee for Intraday buying and selling might be 14 days and 2.1, 2.2 for its multiplier. The common authentic range (ATR) performs a critical function in 'Super trend' because the indicator makes use of ATR to calculate its fee.
The ATR indicator indicators the dimensions of fee volatility. Where can a Super fashion indictor be used? A ‘Super trend’ indicator may be used on equities, futures or forex, and additionally on daily, weekly and hourly charts as properly however normally, it's far unsuccessful in a sideways-transferring market. Like every other indicator, ‘Super trend’ works great while used with different signs consisting of MACD, Parabolic SAR, RSI, etc.
A ‘Super trend’ additionally acts as a sturdy help or resistance and it additionally affords a trailing forestall loss for the present trade. Prior to the great fashion indicator, know-how of the ATR is essential as great fashion employs ATR values to calculate the indicator values.
The super trend indicator is plotted over the fee chart of the inventory or the index. The indicator is a non-stop line which modifications its satiation among inexperienced and pink primarily based totally at the fee second within side the underlying.
An essential element which needs to be understood right here is, Super fashion does now no longer are expecting the route, instead as soon as the route is identified it'll direct you to provoke a role and recommends you to live within side the role until the fashion maintains.
Note worth functions For Long role When the lengthy role has been identified, the dealer is suggested to maintain the location until the fee closes underneath the inexperienced line. The inexperienced line acts as a trailing stop loss for the lengthy role.
For Short role A promote sign is generated while the inventory/index fee turns lesser than the indicator fee. At this stage, the indicator satiation flip pink and you may additionally see a crossover of the fee as opposed to the indicator (fee lesser than indicator fee) The promote sign may be used to begin a clean quick or go out lengthy.
Waiting for the promote sign to go out the present lengthy role can someday cause taking a loss. So the dealer ought to use his judgment right here. Once the quick role has been identified, the dealer is suggested to maintain the location until the fee closes underneath the inexperienced line. So in a experience the pink line facilitates as a trailing stop loss for the quick role. The super trend indicator is a higher device for Intraday buying and selling while as compared to a ordinary Moving Average buying and selling system.
https://enrichbroking.in/super-trend-trader

0 notes
Text
AmiBroker Professional Edition Crack [6.35] + Registration Key {2021}

AmiBroker Professional Edition Crack License Code Free Download
AmiBroker Professional Edition Crack is a popular program for technical analysis of financial markets. The success of investing in the stock and financial markets is based on two important factors: knowledge and information that the program combines these two factors. The programs most widely used are stock exchanges, both international and financial markets such as Forex and the Tehran Stock Exchange. The only thing the program needs is basic information and data, after which, after entering this data. You May also like Prosoft Data Rescue Pro Crack The program will practically turn into a technical analysis station and an experienced consultant on the stock market. The program plays an important role in financial decision making with real-time price charts and the ability to predict market conditions based on prices and other factors. You can easily focus on your favorite metrics and monitor their rise or fall closely. In this program, you can set an alarm according to different conditions to notify the user when the price is higher or lower. AmiBroker Professional Edition License Key software makes analyzing and editing data much easier than charts on the Tehran Stock Exchange website. You can filter unnecessary sections to focus only on changes to your favorite index. One of the interesting features of is the intelligent adaptation to your needs and goals. In fact, you can see which companies can adjust your strategy by determining the strategy and calculating the desired amount of time in a short amount of time. AmiBroker Professional Edition Torrent: The data analysis speed in this program is very high, and you will not experience annoying delays. The program’s graphical interface is also very simple and well-designed to make it easier for users to interact with the program. It provides a powerful systems development environment that is capable of detecting market inefficiencies, coding systems, and validating them with powerful statistical methods, including Monte Carlo simulation and transmission tests. Furthermore, it has a user-definable GUI graphic, built-in batch processing, dozens of new AFL functions, visual debuggers, file search, bookmarks, advanced matrix support, etc. It provides a powerful system development environment capable of finding market inefficiencies. Using the automated trading interface, the software allows you to trade directly from charts or programming. It provides everything you need to be successful in trading. AmiBroker Keygen provides everything you need to be successful in trading. Check out our quick feature overview to see what's included in this powerful package. The professional edition brings, with advanced backrests and optimization, a new analysis and a real-time platform. End date and the current time. Every tick / sec / minute day interval, the real-time trading window has an unlimited number of symbols. Unlimited sales time and symbols. Includes MAE / MFE statistics. Up to 32 matching threads per analysis window. AmiBroker Professional Editions Lifetime Free: Encoding systems and validating them powerful statistical methods, including forwarding testing and simulation of Monte Carlo. Using the automated trade interface, the software allows you to trade directly from charts or programming. It provides all you need to be successful in trading. AmiBroker Serial Key provides all you need to be successful in trading. Check out our quick feature tour to see what this powerful package includes. The Professional Edition brings with it advanced back testing and optimization a new real-time and analytics platform. Date of the end and the actual time. All daytime tick / sec / minute intervals, the real-time quote window has unlimited symbols. Time in sales and unlimited symbols. Includes statistics from MAE / MFE. Per analysis window up to 32 coincident threads. Besides, It has a user-definable GUI chart, integrated batch processing, dozens of new AFL functions, visual debuggers, file finding, bookmarks.

AmiBroker Professional Edition Crack Key Features - Modern customization user interface. - Object-oriented drawing tools (Fibonacci tools, cycles, circles, rectangles, text on a chart, etc.) - Transfer of indicators to the chart (support for drag-and-drop technology) - Support for the most common intranet intervals well as custom N-minute intervals (N = 1..1380); - 5-second, 15-second, tick charts for the real-time version. - Multiple diagrams - different types and scales of time are available at the same time. - Dozens of built-in most popular indicators: ADX, Parabolic SAR, TRIX, etc. - An original symbol tree browser that allows you to group tools by sector, economy, index, etc. - support for various data sources (plugins for DDE) free FOREX market data and free end-of-day data from most world markets, downloaded via Misquote downloaded program; - A powerful built-in Formula Language (AFL) for creating custom indicators and trading systems. - AFL includes over 200 built-in functions that can be used as building blocks for your formulas. - Allows you to include VBScript / JScript codes, providing almost unlimited possibilities. - Built-in support for using multiple time frames in one formula. - Ample opportunities for creating alerts (alerts). - The ability to execute external applications through alerts, which allows you to automate trading. - A very fast back-tester with a detailed report on the results of testing the trading system. - Support for testing the trading system on a portfolio of instruments. - Built-in tools to control the size of the position, as well as the ability to control the position depending on your conditions; - Opportunities for optimizing trading strategies; System Requirements - Pentium 450 MHz or higher - 128 MB RAM - 20 MB hard disk space - 256 colour graphics card 800×600 minimum screen resolution - CPU: 1GHz or more, multiple cores. - 512 MB RAM or more. How to install AmiBroker Professional Edition Crack? - First, click one of the given download links. - Also, do not forget to uninstall the previous version of this software. - Now, Extract the .rar file. - Install the setup normally and close it when done. - Press CTRL + ALT + DELETE and go to Task Manager - Now open the ‘Crack’ or ‘Patch’ folder, copy and paste the patch into the installation folder. - After this run patch as administrator and click the crack button. - That’s it. All done now Read the full article
#amibroker57latestversionfreedownloadwithcrackactivator#amibroker620x64crack#amibroker6305crack#amibrokercrack2021#amibrokercrackversionwithfullfunctions#amibrokerfreedownloadfullversion#AmiBrokerProfessionalEditionCrack#amibrokerultimatepackprocrack#downloadamibroker630fullcrack
0 notes