#ndarray
Explore tagged Tumblr posts
Visit Tumblr Blog
Explore Tumblr blogs with no restrictions, modern design and the best experience.
Last Seen Tumblr Blogs


Fun Fact
The “We are the 99%” Tumblr blog became the slogan for the Occupy Wall Street movement.
Text
Matrice în Python - NumPy - Crearea ndarray cu np.zeros()
Va fi adesea util să creați o matrice, eventual una mare, cu toate elementele egale cu zero inițial. Printre alte scenarii, de multe ori trebuie să folosim o mulțime de variabile de contorizare pentru, ei bine, să numărăm lucrurile. (Amintiți-vă tehnica noastră de creștere din Secțiunea 5.1) Să presupunem, de exemplu, că avem o matrice uriașă care conținea numărul de aprecieri pe care le avea…
0 notes
Text
this code i'm working with uses scikit-learn's Scaler objects and packages some of the fitted scaler attributes into an ndarray. but for some reason it's complaining because the Scaler objects are returning a mix of ndarrays and raw values, and numpy doesn't like that. but presumably their code worked when they wrote it!
my version numbers are MOSTLY the same as the person who wrote this code used. python 3.10.15 instead of 3.10.6, same scikit-learn version, same pandas version. i am so baffled. would a minor version update for python cause this problem in how scikit-learn stores its attributes? i wouldn't expect it to.
2 notes
·
View notes
Text
How you can use python for data wrangling and analysis
Python is a powerful and versatile programming language that can be used for various purposes, such as web development, data science, machine learning, automation, and more. One of the most popular applications of Python is data analysis, which involves processing, cleaning, manipulating, and visualizing data to gain insights and make decisions.
In this article, we will introduce some of the basic concepts and techniques of data analysis using Python, focusing on the data wrangling and analysis process. Data wrangling is the process of transforming raw data into a more suitable format for analysis, while data analysis is the process of applying statistical methods and tools to explore, summarize, and interpret data.
To perform data wrangling and analysis with Python, we will use two of the most widely used libraries: Pandas and NumPy. Pandas is a library that provides high-performance data structures and operations for manipulating tabular data, such as Series and DataFrame. NumPy is a library that provides fast and efficient numerical computations on multidimensional arrays, such as ndarray.
We will also use some other libraries that are useful for data analysis, such as Matplotlib and Seaborn for data visualization, SciPy for scientific computing, and Scikit-learn for machine learning.
To follow along with this article, you will need to have Python 3.6 or higher installed on your computer, as well as the libraries mentioned above. You can install them using pip or conda commands. You will also need a code editor or an interactive environment, such as Jupyter Notebook or Google Colab.
Let’s get started with some examples of data wrangling and analysis with Python.
Example 1: Analyzing COVID-19 Data
In this example, we will use Python to analyze the COVID-19 data from the World Health Organization (WHO). The data contains the daily situation reports of confirmed cases and deaths by country from January 21, 2020 to October 23, 2023. You can download the data from here.
First, we need to import the libraries that we will use:import pandas as pd import numpy as np import matplotlib.pyplot as plt import seaborn as sns
Next, we need to load the data into a Pandas DataFrame:df = pd.read_csv('WHO-COVID-19-global-data.csv')
We can use the head() method to see the first five rows of the DataFrame:df.head()
Date_reportedCountry_codeCountryWHO_regionNew_casesCumulative_casesNew_deathsCumulative_deaths2020–01–21AFAfghanistanEMRO00002020–01–22AFAfghanistanEMRO00002020–01–23AFAfghanistanEMRO00002020–01–24AFAfghanistanEMRO00002020–01–25AFAfghanistanEMRO0000
We can use the info() method to see some basic information about the DataFrame, such as the number of rows and columns, the data types of each column, and the memory usage:df.info()
Output:
RangeIndex: 163800 entries, 0 to 163799 Data columns (total 8 columns): # Column Non-Null Count Dtype — — — — — — — — — — — — — — — 0 Date_reported 163800 non-null object 1 Country_code 162900 non-null object 2 Country 163800 non-null object 3 WHO_region 163800 non-null object 4 New_cases 163800 non-null int64 5 Cumulative_cases 163800 non-null int64 6 New_deaths 163800 non-null int64 7 Cumulative_deaths 163800 non-null int64 dtypes: int64(4), object(4) memory usage: 10.0+ MB “><class 'pandas.core.frame.DataFrame'> RangeIndex: 163800 entries, 0 to 163799 Data columns (total 8 columns): # Column Non-Null Count Dtype --- ------ -------------- ----- 0 Date_reported 163800 non-null object 1 Country_code 162900 non-null object 2 Country 163800 non-null object 3 WHO_region 163800 non-null object 4 New_cases 163800 non-null int64 5 Cumulative_cases 163800 non-null int64 6 New_deaths 163800 non-null int64 7 Cumulative_deaths 163800 non-null int64 dtypes: int64(4), object(4) memory usage: 10.0+ MB
We can see that there are some missing values in the Country_code column. We can use the isnull() method to check which rows have missing values:df[df.Country_code.isnull()]
Output:
Date_reportedCountry_codeCountryWHO_regionNew_casesCumulative_casesNew_deathsCumulative_deaths2020–01–21NaNInternational conveyance (Diamond Princess)WPRO00002020–01–22NaNInternational conveyance (Diamond Princess)WPRO0000……………………2023–10–22NaNInternational conveyance (Diamond Princess)WPRO07120132023–10–23NaNInternational conveyance (Diamond Princess)WPRO0712013
We can see that the missing values are from the rows that correspond to the International conveyance (Diamond Princess), which is a cruise ship that had a COVID-19 outbreak in early 2020. Since this is not a country, we can either drop these rows or assign them a unique code, such as ‘IC’. For simplicity, we will drop these rows using the dropna() method:df = df.dropna()
We can also check the data types of each column using the dtypes attribute:df.dtypes
Output:Date_reported object Country_code object Country object WHO_region object New_cases int64 Cumulative_cases int64 New_deaths int64 Cumulative_deaths int64 dtype: object
We can see that the Date_reported column is of type object, which means it is stored as a string. However, we want to work with dates as a datetime type, which allows us to perform date-related operations and calculations. We can use the to_datetime() function to convert the column to a datetime type:df.Date_reported = pd.to_datetime(df.Date_reported)
We can also use the describe() method to get some summary statistics of the numerical columns, such as the mean, standard deviation, minimum, maximum, and quartiles:df.describe()
Output:
New_casesCumulative_casesNew_deathsCumulative_deathscount162900.000000162900.000000162900.000000162900.000000mean1138.300062116955.14016023.4867892647.346237std6631.825489665728.383017137.25601215435.833525min-32952.000000–32952.000000–1918.000000–1918.00000025%-1.000000–1.000000–1.000000–1.00000050%-1.000000–1.000000–1.000000–1.00000075%-1.000000–1.000000–1.000000–1.000000max -1 -1 -1 -1
We can see that there are some negative values in the New_cases, Cumulative_cases, New_deaths, and Cumulative_deaths columns, which are likely due to data errors or corrections. We can use the replace() method to replace these values with zero:df = df.replace(-1,0)
Now that we have cleaned and prepared the data, we can start to analyze it and answer some questions, such as:
Which countries have the highest number of cumulative cases and deaths?
How has the pandemic evolved over time in different regions and countries?
What is the current situation of the pandemic in India?
To answer these questions, we will use some of the methods and attributes of Pandas DataFrame, such as:
groupby() : This method allows us to group the data by one or more columns and apply aggregation functions, such as sum, mean, count, etc., to each group.
sort_values() : This method allows us to sort the data by one or more
loc[] : This attribute allows us to select a subset of the data by labels or conditions.
plot() : This method allows us to create various types of plots from the data, such as line, bar, pie, scatter, etc.
If you want to learn Python from scratch must checkout e-Tuitions to learn Python online, They can teach you Python and other coding language also they have some of the best teachers for their students and most important thing you can also Book Free Demo for any class just goo and get your free demo.
#python#coding#programming#programming languages#python tips#python learning#python programming#python development
2 notes
·
View notes
Text
Mastering NumPy in Python – The Ultimate Guide for Data Enthusiasts

Imagine calculating the average of a million numbers using regular Python lists. You’d need to write multiple lines of code, deal with loops, and wait longer for the results. Now, what if you could do that in just one line? Enter NumPy in Python, the superhero of numerical computing in Python.
NumPy in Python (short for Numerical Python) is the core package that gives Python its scientific computing superpowers. It’s built for speed and efficiency, especially when working with arrays and matrices of numeric data. At its heart lies the ndarray—a powerful n-dimensional array object that’s much faster and more efficient than traditional Python lists.
What is NumPy in Python and Why It Matters
Why is NumPy a game-changer?
It allows operations on entire arrays without writing for-loops.
It’s written in C under the hood, so it’s lightning-fast.
It offers functionalities like Fourier transforms, linear algebra, random number generation, and so much more.
It’s compatible with nearly every scientific and data analysis library in Python like SciPy, Pandas, TensorFlow, and Matplotlib.
In short, if you’re doing data analysis, machine learning, or scientific research in Python, NumPy is your starting point.
The Evolution and Importance of NumPy in Python Ecosystem
Before NumPy in Python, Python had numeric libraries, but none were as comprehensive or fast. NumPy was developed to unify them all under one robust, extensible, and fast umbrella.
Created by Travis Oliphant in 2005, NumPy grew from an older package called Numeric. It soon became the de facto standard for numerical operations. Today, it’s the bedrock of almost every other data library in Python.
What makes it crucial?
Consistency: Most libraries convert input data into NumPy arrays for consistency.
Community: It has a huge support community, so bugs are resolved quickly and the documentation is rich.
Cross-platform: It runs on Windows, macOS, and Linux with zero change in syntax.
This tight integration across the Python data stack means that even if you’re working in Pandas or TensorFlow, you’re indirectly using NumPy under the hood.
Setting Up NumPy in Python
How to Install NumPy
Before using NumPy, you need to install it. The process is straightforward:
bash
pip install numpy
Alternatively, if you’re using a scientific Python distribution like Anaconda, NumPy comes pre-installed. You can update it using:
bash
conda update numpy
That’s it—just a few seconds, and you’re ready to start number-crunching!
Some environments (like Jupyter notebooks or Google Colab) already have NumPy installed, so you might not need to install it again.
Importing NumPy in Python and Checking Version
Once installed, you can import NumPy using the conventional alias:
python
import numpy as np
This alias, np, is universally recognized in the Python community. It keeps your code clean and concise.
To check your NumPy version:
python
print(np.__version__)
You’ll want to ensure that you’re using the latest version to access new functions, optimizations, and bug fixes.
If you’re just getting started, make it a habit to always import NumPy with np. It’s a small convention, but it speaks volumes about your code readability.
Understanding NumPy in Python Arrays
The ndarray Object – Core of NumPy
At the center of everything in NumPy lies the ndarray. This is a multidimensional, fixed-size container for elements of the same type.
Key characteristics:
Homogeneous Data: All elements are of the same data type (e.g., all integers or all floats).
Fast Operations: Built-in operations are vectorized and run at near-C speed.
Memory Efficiency: Arrays take up less space than lists.
You can create a simple array like this:
python
import numpy as np arr = np.array([1, 2, 3, 4])
Now arr is a NumPy array (ndarray), not just a Python list. The difference becomes clearer with larger data or when applying operations:
python
arr * 2 # [2 4 6 8]
It’s that easy. No loops. No complications.
You can think of an ndarray like an Excel sheet with superpowers—except it can be 1d, 2d, 3d, or even higher dimensions!
1-Dimensional Arrays – Basics and Use Cases
1d arrays are the simplest form—just a list of numbers. But don’t let the simplicity fool you. They’re incredibly powerful.
Creating a 1D array:
python
a = np.array([10, 20, 30, 40])
You can:
Multiply or divide each element by a number.
Add another array of the same size.
Apply mathematical functions like sine, logarithm, etc.
Example:
python
b = np.array([1, 2, 3, 4]) print(a + b) # Output: [11 22 33 44]
This concise syntax is possible because NumPy performs element-wise operations—automatically!
1d arrays are perfect for:
Mathematical modeling
Simple signal processing
Handling feature vectors in ML
Their real power emerges when used in batch operations. Whether you’re summing elements, calculating means, or applying a function to every value, 1D arrays keep your code clean and blazing-fast.
2-Dimensional Arrays – Matrices and Their Applications
2D arrays are like grids—rows and columns of data. They’re also the foundation of matrix operations in NumPy in Python.
You can create a 2D array like this:
python
arr_2d = np.array([[1, 2, 3], [4, 5, 6]])
Here’s what it looks like:
lua
[[1 2 3] [4 5 6]]
Each inner list becomes a row. This structure is ideal for:
Representing tables or datasets
Performing matrix operations like dot products
Image processing (since images are just 2D arrays of pixels)
Some key operations:
python
arr_2d.shape # (2, 3) — 2 rows, 3 columns arr_2d[0][1] # 2 — first row, second column arr_2d.T # Transpose: swaps rows and columns
You can also use slicing just like with 1d arrays:
python
arr_2d[:, 1] # All rows, second column => [2, 5] arr_2d[1, :] # Second row => [4, 5, 6]
2D arrays are extremely useful in:
Data science (e.g., CSVS loaded into 2D arrays)
Linear algebra (matrices)
Financial modelling and more
They’re like a spreadsheet on steroids—flexible, fast, and powerful.
3-Dimensional Arrays – Multi-Axis Data Representation
Now let’s add another layer. 3d arrays are like stacks of 2D arrays. You can think of them as arrays of matrices.
Here’s how you define one:
python
arr_3d = np.array([ [[1, 2], [3, 4]], [[5, 6], [7, 8]] ])
This array has:
2 matrices
Each matrix has 2 rows and 2 columns
Visualized as:
lua
[ [[1, 2], [3, 4]],[[5, 6], [7, 8]] ]
Accessing data:
python
arr_3d[0, 1, 1] # Output: 4 — first matrix, second row, second column
Use cases for 3D arrays:
Image processing (RGB images: height × width × color channels)
Time series data (time steps × variables × features)
Neural networks (3D tensors as input to models)
Just like with 2D arrays, NumPy’s indexing and slicing methods make it easy to manipulate and extract data from 3D arrays.
And the best part? You can still apply mathematical operations and functions just like you would with 1D or 2D arrays. It’s all uniform and intuitive.
Higher Dimensional Arrays – Going Beyond 3D
Why stop at 3D? NumPy in Python supports N-dimensional arrays (also called tensors). These are perfect when dealing with highly structured datasets, especially in advanced applications like:
Deep learning (4D/5D tensors for batching)
Scientific simulations
Medical imaging (like 3D scans over time)
Creating a 4D array:
python
arr_4d = np.random.rand(2, 3, 4, 5)
This gives you:
2 batches
Each with 3 matrices
Each matrix has 4 rows and 5 columns
That’s a lot of data—but NumPy handles it effortlessly. You can:
Access any level with intuitive slicing
Apply functions across axes
Reshape as needed using .reshape()
Use arr.ndim to check how many dimensions you’re dealing with. Combine that with .shape, and you’ll always know your array’s layout.
Higher-dimensional arrays might seem intimidating, but NumPy in Python makes them manageable. Once you get used to 2D and 3D, scaling up becomes natural.
NumPy in Python Array Creation Techniques
Creating Arrays Using Python Lists
The simplest way to make a NumPy array is by converting a regular Python list:
python
a = np.array([1, 2, 3])
Or a list of lists for 2D arrays:
python
b = np.array([[1, 2], [3, 4]])
You can also specify the data type explicitly:
python
np.array([1, 2, 3], dtype=float)
This gives you a float array [1.0, 2.0, 3.0]. You can even convert mixed-type lists, but NumPy will automatically cast to the most general type to avoid data loss.
Pro Tip: Always use lists of equal lengths when creating 2D+ arrays. Otherwise, NumPy will make a 1D array of “objects,” which ruins performance and vectorization.
Array Creation with Built-in Functions (arange, linspace, zeros, ones, etc.)
NumPy comes with handy functions to quickly create arrays without writing out all the elements.
Here are the most useful ones:
np.arange(start, stop, step): Like range() but returns an array.
np.linspace(start, stop, num): Evenly spaced numbers between two values.
np.zeros(shape): Array filled with zeros.
np.ones(shape): Array filled with ones.
np.eye(N): Identity matrix.
These functions help you prototype, test, and create arrays faster. They also avoid manual errors and ensure your arrays are initialized correctly.
Random Array Generation with random Module
Need to simulate data? NumPy’s random module is your best friend.
python
np.random.rand(2, 3) # Uniform distribution np.random.randn(2, 3) # Normal distribution np.random.randint(0, 10, (2, 3)) # Random integers
You can also:
Shuffle arrays
Choose random elements
Set seeds for reproducibility (np.random.seed(42))
This is especially useful in:
Machine learning (generating datasets)
Monte Carlo simulations
Statistical experiments.
Reshaping, Flattening, and Transposing Arrays
Reshaping is one of NumPy’s most powerful features. It lets you reorganize the shape of an array without changing its data. This is critical when preparing data for machine learning models or mathematical operations.
Here’s how to reshape:
python
a = np.array([1, 2, 3, 4, 5, 6]) b = a.reshape(2, 3) # Now it's 2 rows and 3 columns
Reshaped arrays can be converted back using .flatten():
python
flat = b.flatten() # [1 2 3 4 5 6]
There’s also .ravel()—similar to .flatten() but returns a view if possible (faster and more memory-efficient).
Transposing is another vital transformation:
python
matrix = np.array([[1, 2], [3, 4]]) matrix.T # Output: # [[1 3] # [2 4]]
Transpose is especially useful in linear algebra, machine learning (swapping features with samples), and when matching shapes for operations like matrix multiplication.
Use .reshape(-1, 1) to convert arrays into columns, and .reshape(1, -1) to make them rows. This flexibility gives you total control over the structure of your data.
Array Slicing and Indexing Tricks
You can access parts of an array using slicing, which works similarly to Python lists but more powerful in NumPy in Python.
Basic slicing:
python
arr = np.array([10, 20, 30, 40, 50]) arr[1:4] # [20 30 40]
2D slicing:
python
mat = np.array([[1, 2, 3], [4, 5, 6], [7, 8, 9]]) mat[0:2, 1:] # Rows 0-1, columns 1-2 => [[2 3], [5 6]]
Advanced indexing includes:
Boolean indexing:
python
arr[arr > 30] # Elements greater than 30
Fancy indexing:
python
arr[[0, 2, 4]] # Elements at indices 0, 2, 4
Modifying values using slices:
python
arr[1:4] = 99 # Replace elements at indices 1 to 3
Slices return views, not copies. So if you modify a slice, the original array is affected—unless you use .copy().
These slicing tricks make data wrangling fast and efficient, letting you filter and extract patterns in seconds.
Broadcasting and Vectorized Operations
Broadcasting is what makes NumPy in Python shine. It allows operations on arrays of different shapes and sizes without writing explicit loops.
Let’s say you have a 1D array:
python
a = np.array([1, 2, 3])
And a scalar:
python
b = 10
You can just write:
python
c = a + b # [11, 12, 13]
That’s broadcasting in action. It also works for arrays with mismatched shapes as long as they are compatible:
python
a = np.array([[1], [2], [3]]) # Shape (3,1) b = np.array([4, 5, 6]) # Shape (3,)a + b
This adds each element to each element b, creating a full matrix.
Why is this useful?
It avoids for-loops, making your code cleaner and faster
It matches standard mathematical notation
It enables writing expressive one-liners
Vectorization uses broadcasting behind the scenes to perform operations efficiently:
python
a * b # Element-wise multiplication np.sqrt(a) # Square root of each element np.exp(a) # Exponential of each element
These tricks make NumPy in Python code shorter, faster, and far more readable.
Mathematical and Statistical Operations
NumPy offers a rich suite of math functions out of the box.
Basic math:
python
np.add(a, b) np.subtract(a, b) np.multiply(a, b) np.divide(a, b)
Aggregate functions:
python
np.sum(a) np.mean(a) np.std(a) np.var(a) np.min(a) np.max(a)
Axis-based operations:
python
arr_2d = np.array([[1, 2, 3], [4, 5, 6]]) np.sum(arr_2d, axis=0) # Sum columns: [5 7 9] np.sum(arr_2d, axis=1) # Sum rows: [6 15]
Linear algebra operations:
python
np.dot(a, b) # Dot product np.linalg.inv(mat) # Matrix inverse np.linalg.det(mat) # Determinant np.linalg.eig(mat) # Eigenvalues
Statistical functions:
python
np.percentile(a, 75) np.median(a) np.corrcoef(a, b)
Trigonometric operations:
python
np.sin(a) np.cos(a) np.tan(a)
These functions let you crunch numbers, analyze trends, and model complex systems in just a few lines.
NumPy in Python I/O – Saving and Loading Arrays
Data persistence is key. NumPy in Python lets you save and load arrays easily.
Saving arrays:
python
np.save('my_array.npy', a) # Saves in binary format
Loading arrays:
python
b = np.load('my_array.npy')
Saving multiple arrays:
python
np.savez('data.npz', a=a, b=b)
Loading multiple arrays:
python
data = np.load('data.npz') print(data['a']) # Access saved 'a' array
Text file operations:
python
np.savetxt('data.txt', a, delimiter=',') b = np.loadtxt('data.txt', delimiter=',')
Tips:
Use .npy or .npz formats for efficiency
Use .txt or .csv for interoperability
Always check array shapes after loading
These functions allow seamless transition between computations and storage, critical for real-world data workflows.
Masking, Filtering, and Boolean Indexing
NumPy in Python allows you to manipulate arrays with masks—a powerful way to filter and operate on elements that meet certain conditions.
Here’s how masking works:
python
arr = np.array([10, 20, 30, 40, 50]) mask = arr > 25
Now mask is a Boolean array:
graphql
[False False True True True]
You can use this mask to extract elements:
python
filtered = arr[mask] # [30 40 50]
Or do operations:
python
arr[mask] = 0 # Set all elements >25 to 0
Boolean indexing lets you do conditional replacements:
python
arr[arr < 20] = -1 # Replace all values <20
This technique is extremely useful in:
Cleaning data
Extracting subsets
Performing conditional math
It’s like SQL WHERE clauses but for arrays—and lightning-fast.
Sorting, Searching, and Counting Elements
Sorting arrays is straightforward:
python
arr = np.array([10, 5, 8, 2]) np.sort(arr) # [2 5 8 10]
If you want to know the index order:
python
np.argsort(arr) # [3 1 2 0]
Finding values:
python
np.where(arr > 5) # Indices of elements >5
Counting elements:
python
np.count_nonzero(arr > 5) # How many elements >5
You can also use np.unique() to find unique values and their counts:
python
np.unique(arr, return_counts=True)
Need to check if any or all elements meet a condition?
python
np.any(arr > 5) # True if any >5 np.all(arr > 5) # True if all >5
These operations are essential when analyzing and transforming datasets.
Copy vs View in NumPy in Python – Avoiding Pitfalls
Understanding the difference between a copy and a view can save you hours of debugging.
By default, NumPy tries to return views to save memory. But modifying a view also changes the original array.
Example of a view:
python
a = np.array([1, 2, 3]) b = a[1:] b[0] = 99 print(a) # [1 99 3] — original changed!
If you want a separate copy:
python
b = a[1:].copy()
Now b is independent.
How to check if two arrays share memory?
python
np.may_share_memory(a, b)
When working with large datasets, always ask yourself—is this a view or a copy? Misunderstanding this can lead to subtle bugs.
Useful NumPy Tips and Tricks
Let’s round up with some power-user tips:
Memory efficiency: Use dtype to optimize storage. For example, use np.int8 instead of the default int64 for small integers.
Chaining: Avoid chaining operations that create temporary arrays. Instead, use in-place ops like arr += 1.
Use .astype() For type conversion:
Suppress scientific notation:
Timing your code:
Broadcast tricks:
These make your code faster, cleaner, and more readable.
Integration with Other Libraries (Pandas, SciPy, Matplotlib)
NumPy plays well with others. Most scientific libraries in Python depend on it:
Pandas
Under the hood, pandas.DataFrame uses NumPy arrays.
You can extract or convert between the two seamlessly:
Matplotlib
Visualizations often start with NumPy arrays:
SciPy
Built on top of NumPy
Adds advanced functionality like optimization, integration, statistics, etc.
Together, these tools form the backbone of the Python data ecosystem.
Conclusion
NumPy is more than just a library—it’s the backbone of scientific computing in Python. Whether you’re a data analyst, machine learning engineer, or scientist, mastering NumPy gives you a massive edge.
Its power lies in its speed, simplicity, and flexibility:
Create arrays of any dimension
Perform operations in vectorized form
Slice, filter, and reshape data in milliseconds
Integrate easily with tools like Pandas, Matplotlib, and SciPy
Learning NumPy isn’t optional—it’s essential. And once you understand how to harness its features, the rest of the Python data stack falls into place like magic.
So fire up that Jupyter notebook, start experimenting, and make NumPy your new best friend.
FAQs
1. What’s the difference between a NumPy array and a Python list? A NumPy array is faster, uses less memory, supports vectorized operations, and requires all elements to be of the same type. Python lists are more flexible but slower for numerical computations.
2. Can I use NumPy for real-time applications? Yes! NumPy is incredibly fast and can be used in real-time data analysis pipelines, especially when combined with optimized libraries like Numba or Cython.
3. What’s the best way to install NumPy? Use pip or conda. For pip: pip install numpy, and for conda: conda install numpy.
4. How do I convert a Pandas DataFrame to a NumPy array? Just use .values or .to_numpy():
python
array = df.to_numpy()
5. Can NumPy handle missing values? Not directly like Pandas, but you can use np.nan and functions like np.isnan() and np.nanmean() to handle NaNs.
0 notes
Text
ISBN: 978-960-02-4104-4 Συγγραφέας: Jake VanderPlas Εκδότης: Εκδόσεις Παπαζήση Σελίδες: 682 Ημερομηνία Έκδοσης: 2023-10-10 Διαστάσεις: 24x17 Εξώφυλλο: Μαλακό εξώφυλλο
0 notes
Text
Processing invoices using Pytorch
SROIE dataset
For Invoice dataset we are using ICDAR 2019 RObust reading challenge on Scanned Receipts OCR and information extraction competition Dataset. https://rrc.cvc.uab.es/?ch=13&com=introduction https://github.com/zzzDavid/ICDAR-2019-SROIE
Problem statement
https://byteridge.com/blog/images/data_sample.jpg
Tasks
The competition is divided into 3 tasks:
Scanned Receipt Text Localisation: The aim of this task is to accurately localize texts with 4 vertices.
Scanned Receipt OCR: The aim of this task is to accurately recognize the text in a receipt image. No localisation information is provided, or is required.
Key Information Extraction from Scanned Receipts: The aim of this task is to extract texts of a number of key fields from given receipts, and save the texts for each receipt image in a json file.
We will go a little ahead and deploy this as a Flask app and make a generic tool out of the models.
The below concepts are key concepts for further processing.
Pytorch
Its a python based package for serving as a replacement of Numpy and to provide flexibility as a Deep Learning Development Platform offered by Facebook.
Tensors
Tensors are similar to numpy’s ndarrays, with the addition being that Tensors can also be used on a GPU to accelerate computing.
Tensors are multi dimensional Matrices.torch.Tensor(x,y)
This will create a X by Y dimensional Tensor that has been instantiated with random values.
To Create a 6×4 Tensor with values randomly selected from a Uniform Distribution between -1 and 1,torch.Tensor(6, 4).uniform_(-1, 1)
Tensors have a size attribute that can be called to check their sizeprint(x.size())
CTPN
CTPN stands for Connectionist Text Proposal Network CTPN is a deep learning method that accurately predicts text lines in a natural image. It is an end-to-end trainable model which consists of both CNN and RNN layers.
This algorithm detects text or words in any kind of image including both scanned documents and natural images. It accurately localizes text lines in natural image and detects a text line in a sequence of fine-scale text proposals directly in convolutional feature maps. CTPN works reliably on multi-scale and multi-language text without further post-processing, departing from previous bottom-up methods requiring multi-step post-processing.It is computationally efficient with 0:14s/image, by using the very deep VGG16 model.
continues.... https://www.byteridge.com/expert-opinions/processing-invoices-using-pytorch/
0 notes
Text
Python OpenCV: Copy image
How to copy an image in OpenCV, using Python.

Introduction
In this short tutorial we will learn how to copy an image in OpenCV, using Python.
Copying an image might be useful if we need more than one instance of it. For example, we might want to manipulate the image (ex: drawing shapes on it) but still preserve the original one to display side by side. So, instead of having to read that image multiple times, we will check how to copy…
View On WordPress
0 notes
Text
Attend 2 Days "FREE PYTHON" Master Class
Click on the link below provided
https://tinyurl.com/c4ecbp5c
Limited seat allocation based on first- to register basis
Mode of class: Online Zoom Meeting
( Meeting ID & Password to be shared with the participants a day before the class on their email ids)
Start your python programming course with RVM now!!
Faculty with 11+ years of experience in programming
Day 1: 24th April 2021
Day: Saturday
Timings: 10AM -12 PM
Topic: Explore Python Essentials
Coverage
1. Python language fundamentals
2. Python data structures
3. Python modules
Day 2. : 25th April 2021
Day. : Sunday
Timings: 10AM -12 PM
Topic: Explore numpy Library
Coverage
1. How to create Ndarrays
2. How to access Ndarrays
3. How to slice Ndarrays
4. How to shaping and reshaping Ndarrays
5. How to perform search and sorting in Ndarrays
#pythonprogramming#programminglanguage#pythonlearning#pythonforbeginners#pythonforfinance#technicalanalysis#fundamentalanalysis#pythoncode#numpyarrays#Ndarrays#coding
0 notes
Link
Ndarray is the n-dimensional array object defined in the numpy. It stores the collection of elements of the same type. Elements in the collection can be accessed using a zero-based index. Each element in an ndarray takes the same size in memory.
1 note
·
View note
Text
Master NumPy Library for Data Analysis in Python in 10 Minutes
Learn and Become a Master of one of the most used Python tools for Data Analysis.

Introduction:-
NumPy is a python library used for working with arrays.It also has functions for working in domain of linear algebra, fourier transform, and matrices.It is an open source project and you can use it freely. NumPy stands for Numerical Python.
NumPy — Ndarray Object
The most important object defined in NumPy is an N-dimensional array type called ndarray. It describes the collection of items of the same type. Items in the collection can be accessed using a zero-based index.Every item in an ndarray takes the same size of block in the memory.
Each element in ndarray is an object of data-type object (called dtype).Any item extracted from ndarray object (by slicing) is represented by a Python object of one of array scalar types.
The following diagram shows a relationship between ndarray, data type object (dtype) and array scalar type −
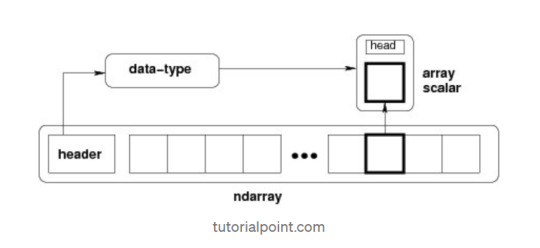
It creates an ndarray from any object exposing array interface, or from any method that returns an array.
numpy.array(object, dtype = None, copy = True, order = None, subok = False, ndmin = 0)
The above constructor takes the following parameters −
Object :- Any object exposing the array interface method returns an array, or any (nested) sequence.
Dtype : — Desired data type of array, optional.
Copy :- Optional. By default (true), the object is copied.
Order :- C (row major) or F (column major) or A (any) (default).
Subok :- By default, returned array forced to be a base class array. If true, sub-classes passed through.
ndmin :- Specifies minimum dimensions of resultant array.
Operations on Numpy Array
In this blog, we’ll walk through using NumPy to analyze data on wine quality. The data contains information on various attributes of wines, such as pH and fixed acidity, along with a quality score between 0 and 10 for each wine. The quality score is the average of at least 3 human taste testers. As we learn how to work with NumPy, we’ll try to figure out more about the perceived quality of wine.
The data was downloaded from the winequality-red.csv, and is available here. file, which we’ll be using throughout this tutorial:
Lists Of Lists for CSV Data
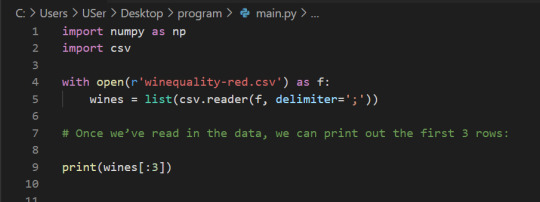
Before using NumPy, we’ll first try to work with the data using Python and the csv package. We can read in the file using the csv.reader object, which will allow us to read in and split up all the content from the ssv file.
In the below code, we:
Import the csv library.
Open the winequality-red.csv file.
With the file open, create a new csv.reader object.
Pass in the keyword argument delimiter=";" to make sure that the records are split up on the semicolon character instead of the default comma character.
Call the list type to get all the rows from the file.
Assign the result to wines.
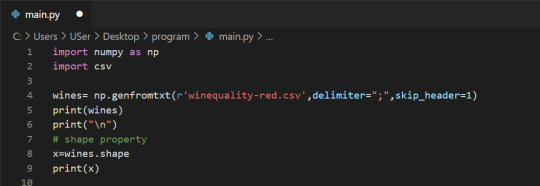
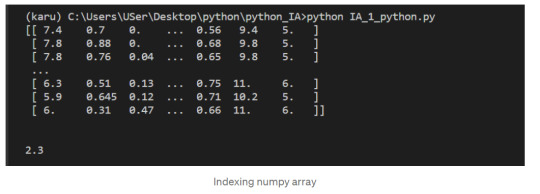
We can check the number of rows and columns in our data using the shape property of NumPy arrays:
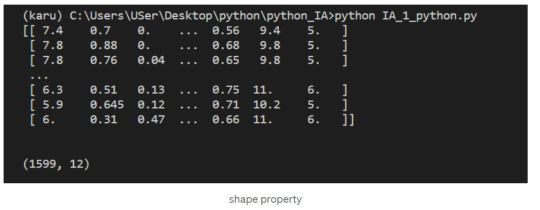
Indexing NumPy Arrays
Let’s select the element at row 3 and column 4. In the below code, we pass in the index 2 as the row index, and the index 3 as the column index. This retrieves the value from the fourth column of the third row:
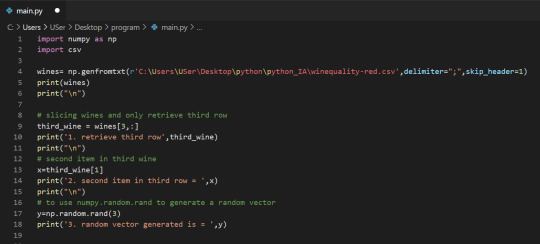
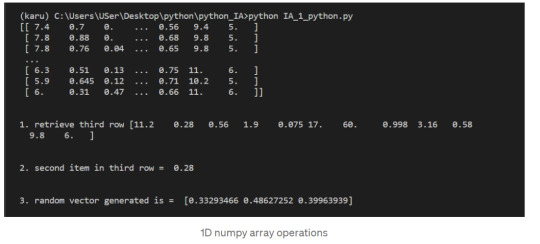
1-Dimensional NumPy Arrays
So far, we’ve worked with 2-dimensional arrays, such as wines. However, NumPy is a package for working with multidimensional arrays. One of the most common types of multidimensional arrays is the 1-dimensional array, or vector.
1.Just like a list of lists is analogous to a 2-dimensional array, a single list is analogous to a 1-dimensional array. If we slice wines and only retrieve the third row, we get a 1-dimensional array:
2. We can retrieve individual elements from third_wine using a single index. The below code will display the second item in third_wine:
3. Most NumPy functions that we’ve worked with, such as numpy.random.rand, can be used with multidimensional arrays. Here’s how we’d use numpy.random.rand to generate a random vector:
After successfully reading our dataset and learning about List, Indexing, & 1D array in NumPy we can start performing the operation on it.
The first element of each row is the fixed acidity, the second is the volatile ,acidity, and so on. We can find the average quality of the wines. The below code will:
Extract the last element from each row after the header row.
Convert each extracted element to a float.
Assign all the extracted elements to the list qualities.
Divide the sum of all the elements in qualities by the total number of elements in qualities to the get the mean.
NumPy Array Methods
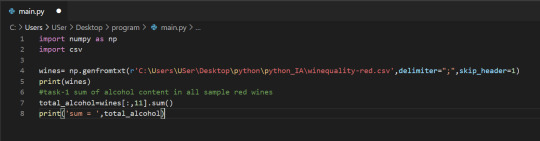
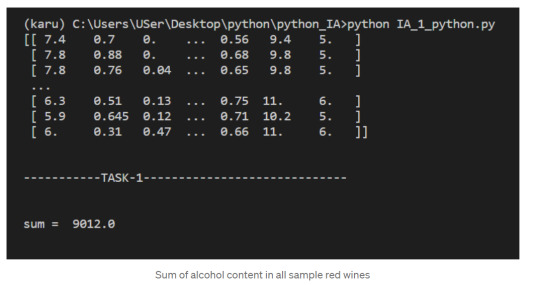
In addition to the common mathematical operations, NumPy also has several methods that you can use for more complex calculations on arrays. An example of this is the numpy.ndarray.sum method. This finds the sum of all the elements in an array by default:
2. Sum of alcohol content in all sample red wines
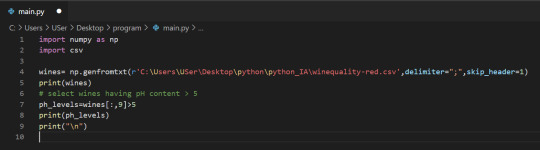
NumPy Array Comparisons
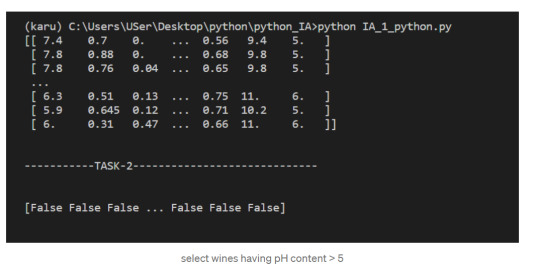
We get a Boolean array that tells us which of the wines have a quality rating greater than 5. We can do something similar with the other operators. For instance, we can see if any wines have a quality rating equal to 10:
3. select wines having pH content > 5
Subsetting
We select only the rows where high_Quality contains a True value, and all of the columns. This subsetting makes it simple to filter arrays for certain criteria. For example, we can look for wines with a lot of alcohol and high quality. In order to specify multiple conditions, we have to place each condition in parentheses, and separate conditions with an ampersand (&):
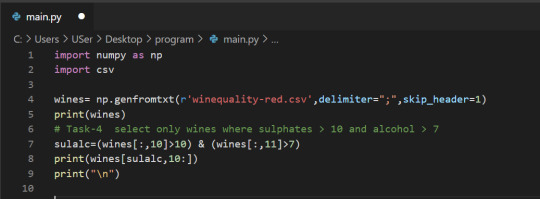
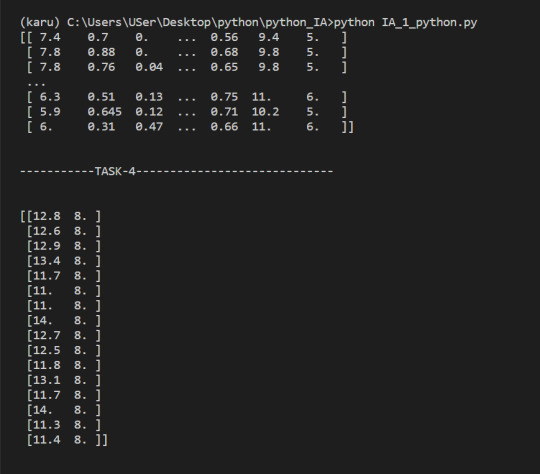
4. Select only wines where sulphates >10 and alcohol >7
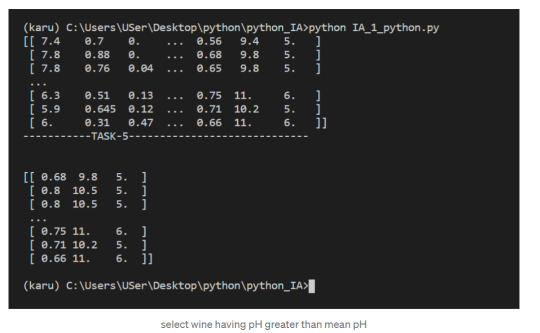
5. select wine having pH greater than mean pH
We have seen what NumPy is, and some of its most basic uses. In the following posts we will see more complex functionalities and dig deeper into the workings of this fantastic library!
To check it out follow me on tumblr, and stay tuned!
That is all, I hope you liked the post. Feel Free to follow me on tumblr
Also, you can take a look at my other posts on Data Science and Machine Learning here. Have a good read!
1 note
·
View note
Quote
dotの第一、第二引数には内積や積を求めたいベクトルや行列を指定します。まずはndarrayを指定して計算してみます。 In [1]: import numpy as np In [2]: a = np.array([1, 2]) In [3]: b = np.array([4, 3]) In [4]: np.dot(a, b) # まずは2次元ベクトル同士の内積から。 Out[4]: 10 In [5]: np.dot(a, a) # これでベクトルのノルムの2乗が出る。 Out[5]: 5 1次元のベクトルの内積計算が計算されました。1 * 4 + 2 * 3 = 10になります。同じ値を指定して計算すると、ノルムの二乗になります。 np.dotにはスカラー値も入れて計算することができます。 In [6]: np.dot(4, 5) # ただの数字を入れてもその積が返される。 Out[6]: 20 また、複素数も計算することができます。 In [7]: c = np.array([1j, 2j]) # 複素数でやってみる。 In [8]: d = np.array([4j, 3j]) In [9]: np.dot(c, d) Out[9]: (-10+0j) In [10]: np.dot(a, d) Out[10]: 10j このとき、np.arrayだけでなくnp.matrixも使うことができます。np.matrixはnp.arrayの二次元配列を再定義したものになっていますが挙動が行列の演算に比較的近いものになっています。 np.arrayからnp.matrixに変えてやってみましょう。列ベクトルか行ベクトルかで計算できるかどうかが変わってくるので注意が必要です。 In [11]: e = np.matrix([1,2]) In [12]: f = np.matrix([4, 3]) In [13]: np.dot(e, f) # np.matrixで同じようにやろうとするとエラーが返ってくる。 --------------------------------------------------------------------------- (エラーメッセージが表示される) ValueError: shapes (1,2) and (1,2) not aligned: 2 (dim 1) != 1 (dim 0) In [14]: f = np.matrix([[4], [3]]) # fを列ベクトルに変換すれば In [15]: np.dot(e, f) # 同じ結果を得ることができる。 Out[15]: matrix([[10]]) 次は行列同士の積をみていきます。 In [20]: a = np.array([[1,2], [3,4]]) In [21]: b = np.array([[4, 3], [2,1]]) In [22]: np.dot(a, b) # 2×2の行列同士の積 Out[22]: array([[ 8, 5], [20, 13]]) In [23]: np.dot(b, a) # aとの順番を入れ替えると返ってくる行列も違ってくる。 Out[23]: array([[13, 20], [ 5, 8]]) In [24]: c = np.arange(9).reshape((3,3)) In [25]: d = np.ones((3,3)) # 要素が1の3×3の配列を生成。 In [26]: np.dot(c, d) # 3×3の行列同士でももちろんできる。 Out[26]: array([[ 3., 3., 3.], [ 12., 12., 12.], [ 21., 21., 21.]]) 左からかける行列の列数(axis = 1)と右からかける行列の行数(axis = 0)とが一致していないとうまく積を求めることができません。 In [27]: a = np.arange(12).reshape((4, 3)) In [28]: b = np.arange(16).reshape((4, 4)) In [29]: np.dot(a, b) # aのaxis = 1とbのaxis = 0が異なると演算ができな���。 --------------------------------------------------------------------------- (エラーメッセージが表示される) ValueError: shapes (4,3) and (4,4) not aligned: 3 (dim 1) != 4 (dim 0)
ベクトルの内積や行列の積を求めるnumpy.dot関数の使い方 - DeepAge
0 notes
Text
[Pythonわからない] なんでnp.arrayにDataframeを指定するだけで、ndarrayができあがってしまうの? わからない…to_numpy()は使わなくていいの…? https://t.co/4MF7aeFVbr
[Pythonわからない] なんでnp.arrayにDataframeを指定するだけで、ndarrayができあがってしまうの? わからない…to_numpy()は使わなくていいの…? pic.twitter.com/4MF7aeFVbr
— いちる 🌖 サービスの企画屋&さすらいの編集長 (@kotoripiyopiyo) June 10, 2020
from Twitter https://twitter.com/kotoripiyopiyo June 10, 2020 at 10:04PM via IFTTT
1 note
·
View note
Text
Q: okay, so now we do have a feel that we could eventually learn, and understand, and master, any piece of mathematics we encounter.
A: let's not get ahead of ourselves yet; we haven't yet jumped about graduate-level basics, I don't think. But anyway.
Q: ...so with that in mind, I have a question to you. How does one invent mathematics? Seems prudent to learn to do that earlier than later.
A: Two ways, I think. First, we just keep thinking the obvious, keep noticing trivial and slightly nontrivial theorems. For now, they are all simple — although recall the type-theoretic notion of a natural transformation (we should look up whether it's been done) — but as we go on, fewer and fewer explorers will have been there before, and eventually these observations cease to be known results and become original work.
Q: I am suspicious of this. I don't remember offhand any case at all in which our "original work" wasn't an application of a known result. Or inspired by one, and performed with already-made tools.
A: But we have touched the boundary of progress, haven't we? Ndarray typing is undone, for example. ...lifting Python to a formal verification level might be a fool's errand without much better tooling in pretty much every part of formal methods we've seen, but it could be done.
A: And also: "inspired by" is really just as good as original, we really should know that by now. Better, really, because who knows whether originality comes from, and inspiration is kind of organic.
Q: Okay, okay, that sounds like it could possibly work. What's the second way?
A: Oh, the usual. You pick an impossible problem to serve as a direction, you search for best tools to help you, they shatter in your hands, you learn how they worked and build something better. Practice this-all on toy problems, move on to more general, etc.
Q: ...could you expand on "learn how they worked and build something better", that sounds hard but perhaps comprehensible. (And, inconveniently, it sounds long.)
A: That thing where we thought at a proof via Compactness theorem until it became a step small enough to fit in memory? Practice with inductive principles until writing out proof terms by hand is sometimes easier than tactics?
Q: This sounds like studying/mastering a tool, not like looking at its structure and extending it, nor like building something entirely new.
A: ...hm. Okay, let me try to find some situations in which we might've practiced discovery if we knew to.
A: Maybe: zero morphisms? I think we had some chance of guessing how they work from just their name. And this plausibly extends to all other kinds of morphisms.
Q: Still kind of bases on these kinds being already invented and suggestively named.
A: Mm. We could try to categorify everything in sight in set theory or abstract algebra, and note when we don't see how, and try to invent some construction that'd let us, and see how that matches w/ standards?
Q: ..."inspired by", but yeah, that sounds like something that might work. Problem: this sounds insufferably long. Reading about extant constructions is so much faster / more concentrated.
A: Could meditate on living by your own strength and this being an optimal way to study if there was time, but yeah. Not sure it is though. And, perhaps, "reading cutting-edge papers for inspiration", extracting insight from them and/or doing obvious extensions would be enough even if we never grok how to discover "really" new things.
Q: All right then.
2 notes
·
View notes
Text
The Ultimate Ndarray Handbook: Mastering the Art of Scientific Computing with Rust | by Mahmoud Harmouch
An overview of different Rust’s built-in data structures and a deep dive into the Ndarray library Photo by Crissy Jarvis on Unsplash TLDR; Rust has gained immense popularity as a programming language globally, and it’s not without reason. Additionally, when discussing data analysis specifically, Rust stands out from its peers with its exceptional capabilities in this field. The extensive library…

View On WordPress
0 notes
Text
OpenCVを使う場合も、PythonのOpenCVでは画像データをndarrayとして扱う
import numpy as np import cv2 as cv
img = cv.imread("画像ファイル名") type(img) # numpy.ndarray img.shape # (縦ピクセル数, 横ピクセル数, チャンネル数)
0 notes