#pivottable
Explore tagged Tumblr posts
Visit Tumblr Blog
Explore Tumblr blogs with no restrictions, modern design and the best experience.
Last Seen Tumblr Blogs


Fun Fact
Tumblr has a low social media market share in South America.
Text

🧠 QUIZ TIME!
Think you know Excel? Let’s find out!
🔍What is a Pivot Table used for in Excel?
A) Fixing Typos B) Drawing Shapes C) Summarizing Data D) Encrypting Files
📊 Pivot Tables help you quickly understand and summarize big data in Excel. They’re an important skill for anyone learning data analytics!
👇 Comment your answer below!
👉 Join our Data Analytics Masters Program today!
📞 +91 9948801222
🌐 www.dataanalyticsmasters.in 📍 Location: Hyderabad
#ExcelTips#PivotTable#DataAnalytics#ExcelSkills#LearnExcel#DataTools#AnalyticsMadeEasy#ExcelForBeginners#StudyTips#UpskillNow#DataScienceBasics#MasterExcel#ExcelTraining#DataAnalyticsMasters#OnlineLearning
0 notes
Text
Creating a pivot table in Microsoft Excel is a powerful way to analyze and summarize data. Here’s a step-by-step guide to creating a pivot table:
1. Prepare Your Data: Ensure that your data is organized in a tabular format with clear headers. Each column should represent a different attribute, and each row should contain a record.
2. Select Your Data: Click on any cell within your data range. Alternatively, you can press `Ctrl + A` to select the entire dataset.
3. Insert Pivot Table: — Go to the “Insert” tab on the Excel ribbon. — Click on the “PivotTable” button. This opens the “Create PivotTable” dialog box.
4. Choose Data Range: — Ensure that the “Table/Range” field in the dialog box displays the correct range for your data. — You can manually adjust the range if needed.
5. Select Location: — Choose whether you want the pivot table to be placed in a new worksheet or an existing one. — Click “OK.”
6. Design Your Pivot Table: — In the new worksheet, you’ll see the PivotTable Field List on the right and a blank grid on the left. — Drag and drop fields from the Field List into the areas below: — Values: This is where you place the fields you want to perform calculations on (e.g., sum, count, average). — Rows: This is where you place the fields whose unique values you want as the rows of your pivot table. — Columns: This is where you place the fields whose unique values you want as the columns of your pivot table. — Filters: This is where you place fields to filter the data.
7. Customize Your Pivot Table: — You can customize the appearance and behavior of your pivot table using various options available in the PivotTable Tools Design and Analyze tabs that appear when you click inside the pivot table.
8. Refresh Data: — If your source data changes, right-click on the pivot table and select “Refresh” to update the pivot table with the latest data.
That’s it! You’ve successfully created a pivot table in Microsoft Excel. Experiment with the placement of fields and explore the various options to tailor the pivot table to your specific analysis needs.
Watch Now:- The Knowledge Academy
0 notes
Text
Excel test tomorrow. The last excel test was easy enough (probably the easiest test so far: but that might be because I’d done the two word tests before and some things repeat) but this more advanced one I’m a bit more nervous about. At least my notes and print outs should guide me. I know where vaguely to flick to if I need to look them up.
#Memories of school return#polka blabs#I think I need to not look at it but pivottables don’t come naturally to me so it’ll probably be on test haha#Also don’t see point of index function honestly but /shrug
3 notes
·
View notes
Text
Elevate Client Services with Excel: Expert Tips for Financial Consultants by Grayson Garelick

Financial consultants operate in a dynamic environment where precision, efficiency, and client satisfaction are paramount. Excel, as a versatile tool, offers an array of features that can significantly enhance the services provided by financial consultants. Grayson Garelick, an accomplished financial analyst and consultant, shares invaluable Excel tips to help financial consultants elevate their client services and add tangible value.
The Role of Excel in Financial Consulting
Excel serves as the backbone of financial consulting, enabling consultants to analyze data, create models, and generate insights that drive informed decision-making. As the demands of clients become increasingly complex, mastering Excel becomes essential for financial consultants aiming to deliver exceptional services.
1. Customize Excel Templates
One of the most effective ways to streamline workflows and improve efficiency is by creating customized Excel templates tailored to specific client needs. Grayson suggests developing templates for budgeting, forecasting, and financial reporting that can be easily adapted for different clients, saving time and ensuring consistency.
2. Utilize PivotTables for Data Analysis
PivotTables are powerful tools in Excel that allow financial consultants to analyze large datasets and extract meaningful insights quickly. Grayson emphasizes the importance of mastering PivotTables for segmenting data, identifying trends, and presenting information in a clear and concise manner to clients.
3. Implement Conditional Formatting
Conditional formatting is a valuable feature in Excel that allows consultants to highlight important information and identify outliers effortlessly. By setting up conditional formatting rules, consultants can draw attention to key metrics, discrepancies, or trends, facilitating easier interpretation of data by clients.
4. Leverage Excel Add-ins
Excel offers a variety of add-ins that extend its functionality and provide additional features tailored to financial analysis and reporting. Grayson recommends exploring add-ins such as Power Query, Power Pivot, and Solver to enhance data manipulation, modeling, and optimization capabilities.
5. Automate Repetitive Tasks with Macros
Macros enable financial consultants to automate repetitive tasks and streamline workflows, saving valuable time and reducing the risk of errors. Grayson advises recording and editing macros to automate tasks such as data entry, formatting, and report generation, allowing consultants to focus on value-added activities.
6. Master Advanced Formulas and Functions
Excel's extensive library of formulas and functions offers endless possibilities for financial analysis and modeling. Grayson suggests mastering advanced formulas such as VLOOKUP, INDEX-MATCH, and array formulas to perform complex calculations, manipulate data, and create sophisticated models tailored to client needs.
7. Visualize Data with Charts and Graphs
Visualizing data is essential for conveying complex information in an easily digestible format. Excel offers a variety of chart types and customization options that enable consultants to create compelling visuals that resonate with clients. Grayson recommends experimenting with different chart styles to find the most effective way to present data and insights.
8. Collaborate and Share Workbooks Online
Excel's collaboration features enable financial consultants to work seamlessly with clients, colleagues, and stakeholders in real-time. Grayson highlights the benefits of sharing workbooks via OneDrive or SharePoint, allowing multiple users to collaborate on the same document, track changes, and maintain version control.
9. Protect Sensitive Data with Security Features
Data security is a top priority for financial consultants handling sensitive client information. Excel's built-in security features, such as password protection and encryption, help safeguard confidential data and ensure compliance with regulatory requirements. Grayson advises implementing security protocols to protect client data and maintain trust.
10. Stay Updated with Excel Training and Certification
Excel is a constantly evolving tool, with new features and updates released regularly. Grayson stresses the importance of staying updated with the latest Excel training and certification programs to enhance skills, explore new capabilities, and maintain proficiency in Excel's ever-changing landscape.
Elevating Client Services with Excel Mastery
Excel serves as a catalyst for innovation and excellence in financial consulting, empowering consultants to deliver exceptional services that add tangible value to clients. By implementing Grayson Garelick Excel tips, financial consultants can streamline workflows, enhance data analysis capabilities, and foster collaboration, ultimately driving client satisfaction and success. As financial consulting continues to evolve, mastering Excel remains a cornerstone of excellence, enabling consultants to thrive in a competitive landscape and exceed client expectations.
#Financial Consulting#grayson garelick#Customize Excel Templates#Utilize PivotTables#Implement Conditional Formatting#Leverage Excel Add-ins#Automate Repetitive Tasks with Macros#Advanced Formulas and Functions#Visualize Data with Charts and Graphs#Collaborate and Share Workbooks#Protect Sensitive Data with Security#Stay Updated with Excel Training#Elevating Client Services with Excel
3 notes
·
View notes
Video
youtube
EXCEL - Formulas and Functions - Statistics - averageifs #viralvideo #vi...
#youtube#excel MicrosoftExcel Exceltutorial Exceltips Exceltricks Excelshortcuts Excelfunctions Excelformulas Pivottables VLOOKUP HLOOKUP XLOOKUP Con
0 notes
Text
Best Advanced MS Excel Course in Phagwara
Unlock Your Potential with Advanced MS Excel at TechCadd, Phagwara
In today's fast-paced digital world, knowing how to use Excel isn't just a bonus—it’s a necessity. That’s why TechCadd in Phagwara offers a specialized Advanced MS Excel course designed to equip you with the skills that top employers demand. Whether you’re a student, working professional, or business owner, Excel can help you save time, make smarter decisions, and stay ahead of the competition. Our advanced MS Excel in Phagwara training focuses on practical learning, helping you gain confidence in handling data more efficiently and effectively.
Unlike basic Excel classes, this program dives deep into powerful tools and features that most users overlook. Our advanced MS Excel course covers essential techniques such as complex formulas, logical functions, pivot tables, data visualization, and error handling. We also teach automation through macros and introduce tools like Power Query, which can completely transform how you process data. At TechCadd, we make sure the learning experience is interactive, hands-on, and personalized to suit different learning paces. With this advanced MS Excel training, you’ll be ready to take on any data challenge with clarity and skill.
There’s a growing demand for Excel experts in industries like finance, marketing, IT, and logistics. That’s why more and more learners are turning to TechCadd for advanced MS Excel in Phagwara. We’ve structured our course to simulate real-life business scenarios. You won’t just learn how to use features—you’ll understand when and why to use them. From automating monthly reports to building dashboards for KPIs, our course helps you apply your knowledge in practical ways. Whether you want to stand out in your job, change careers, or simply work smarter, this training gives you the tools to do so.
At TechCadd, we believe that learning should be practical and career-focused. That’s why our advanced MS Excel course includes case studies, projects, and continuous support. We don’t just train—we mentor. You’ll have access to certified trainers, doubt-clearing sessions, and real-world exercises that boost your confidence. Our goal is to ensure that every learner walks out of our classrooms with hands-on experience and a clear understanding of how Excel can simplify complex tasks. When it comes to advanced MS Excel, we’re known for quality training and lasting results.
Choosing TechCadd for advanced MS Excel in Phagwara means choosing a future where you’re more efficient, more informed, and more in control of your data. We help learners transition from just knowing Excel to actually mastering it. Our alumni have gone on to become data analysts, project managers, financial planners, and team leads—all thanks to the strong foundation they built here. If you're looking to upgrade your skills with a trusted institute, this is the advanced MS Excel course you’ve been waiting for.
https://techcaddphagwara.com/best-Advanced-MS-Excel-Course-in-Phagwara.php
#AdvancedExcel#ExcelTraining#ExcelExperts#LearnExcel#ExcelTips#ExcelSkills#ExcelMastery#MicrosoftExcel#ExcelFunctions#ExcelCourse#DataAnalysis#ExcelForProfessionals#ExcelTutorial#PivotTables#ExcelVBA#ExcelFormulas#ExcelDashboard#ExcelAutomation#SpreadsheetSkills#BusinessAnalytics#ExcelLearning#ExcelOnlineCourse#ExcelPowerQuery#ExcelData#ProductivityWithExcel
0 notes
Text
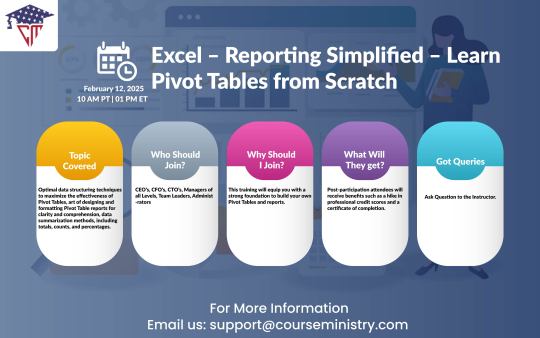
Excel – Reporting Simplified – Learn Pivot Tables from Scratch
Master Excel reporting with "Excel – Reporting Simplified – Learn Pivot Tables from Scratch." This course guides you step by step in using Pivot Tables to analyze data efficiently, create insightful reports, and simplify complex datasets. Perfect for beginners and professionals alike!
For more expert-led webinars and online courses, visit course ministry – your go-to platform for skill enhancement. 🚀
#Excel#PivotTables#DataAnalytics#OnlineLearning#ExcelTraining#onlinecourses#livewebinar#compliance training online#regulatory compliance training
0 notes
Video
youtube
Excel for Data Analytics: Vlookup Approx Match (Lesson 13)
1 note
·
View note
Text
ADVANCE EXCEL COURSE
An advanced Excel course offers comprehensive training in using Excel for complex data analysis, reporting, and automation. Topics include advanced functions like VLOOKUP, INDEX-MATCH, and array formulas, data visualization with charts and graphs, creating dynamic dashboards, pivot tables, and power query for data cleaning. It also covers automation through macros and Visual Basic for Applications (VBA), enabling the creation of custom solutions and streamlined workflows. Learners will gain expertise in handling large datasets, forecasting, and advanced data modeling, making it ideal for professionals in fields such as finance, marketing, data science, and business analytics.

#AdvancedExcel#ExcelForProfessionals#DataAnalysis#ExcelFunctions#PivotTables#ExcelAutomation#VBA#Macros#DataVisualization#ExcelDashboards#BusinessAnalytics#ExcelForBusiness
0 notes
Text
#Excel#DataAnalysis#InterviewTips#DataAnalyst#ExcelSkills#PivotTables#VLOOKUP#DataValidation#ExcelFormulas#TechInterviews#DataScience#Analytics
0 notes
Text
At APTRON Solutions, we understand the importance of Excel proficiency in today's job market. Whether you're a beginner looking to grasp the fundamentals or an experienced professional aiming to enhance your expertise, our Excel and Advanced Excel Institute in Noida provides tailored courses to suit your needs.
#APTRONSolutions#ExcelTraining#AdvancedExcel#ExcelInstitute#Noida#DataAnalysis#PivotTables#ExcelSkills#CareerGrowth#JobPlacement#ExcelProficiency#LearnExcel
0 notes
Text
Pivot Table In Excel
A Pivot Table is a powerful feature in Microsoft Excel that allows you to summarize and analyze large sets of data. It is particularly useful for transforming and presenting data in a more structured and meaningful way. Here's a basic guide on how to create a Pivot Table in Excel:
Step-by-Step Guide:
Prepare Your Data: Ensure that your data is organized in a tabular format with column headers. Each column should represent a different variable, and each row should contain a unique record.
Select Your Data: Highlight the range of cells that you want to include in your Pivot Table.
Insert Pivot Table:
Go to the "Insert" tab on the Excel ribbon.
Click on "PivotTable" in the Tables group.
Create Pivot Table Dialog Box:
In the "Create PivotTable" dialog box, make sure the table range is correct.
Choose where you want to place your Pivot Table: either in a new worksheet or an existing worksheet.
Pivot Table Fields:
A new worksheet will open with a blank grid and a list of fields on the right side.
Drag the fields from your data into the following areas:
Rows: This is where you put the fields that you want to see as rows in your table.
Columns: This is where you put the fields that you want to see as columns in your table.
Values: This is where you put the fields that you want to summarize (e.g., sum, count, average).
Customize the Pivot Table:
You can further customize your Pivot Table by dragging and dropping fields, changing the summary function (e.g., sum, average), or applying filters.
Refresh Data:
If your source data changes, you might need to refresh the Pivot Table. Right-click on the Pivot Table and select "Refresh" or use the "Refresh All" button on the ribbon.
Format the Pivot Table:
Format your Pivot Table as needed using Excel's formatting options.
Tips:
Experiment with dragging different fields into rows, columns, and values to see how it affects the summary.
You can create calculated fields or items to perform custom calculations within the Pivot Table.
Use the "Filter" options within the Pivot Table to focus on specific data.
Pivot Tables are dynamic, meaning you can easily rearrange and modify them as needed. They are an excellent tool for data analysis and reporting in Excel.
Watch Now:- The Knowledge Academy
0 notes
Video
youtube
Pivot table excel in hindi | Pivot Chart | how to create pivot table in ...
#youtube#Pivot table excel in hindi | Pivot Chart | how to create pivot table in excel 2019 | create pivot table and chart in excel pivot pivottable
0 notes
Text
What is the most awesome Microsoft product? Why?
The “most awesome” Microsoft product depends on your needs, but here are some top contenders and why they stand out:
Top Microsoft Products and Their Awesome Features
1. Microsoft Excel
Why? It’s the ultimate tool for data analysis, automation (with Power Query & VBA), and visualization (Power Pivot, PivotTables).
Game-changer feature: Excel’s Power Query and dynamic arrays revolutionized how users clean and analyze data.
2. Visual Studio Code (VS Code)
Why? A lightweight, free, and extensible code editor loved by developers.
Game-changer feature: Its extensions marketplace (e.g., GitHub Copilot, Docker, Python support) makes it indispensable for devs.
3. Windows Subsystem for Linux (WSL)
Why? Lets you run a full Linux kernel inside Windows—perfect for developers.
Game-changer feature: WSL 2 with GPU acceleration and Docker support bridges the gap between Windows and Linux.
4. Azure (Microsoft Cloud)
Why? A powerhouse for AI, cloud computing, and enterprise solutions.
Game-changer feature: Azure OpenAI Service (GPT-4 integration) and AI-driven analytics make it a leader in cloud tech.
5. Microsoft Power BI
Why? Dominates business intelligence with intuitive dashboards and AI insights.
Game-changer feature: Natural language Q&A lets users ask data questions in plain English.
Honorable Mentions:
GitHub (owned by Microsoft) �� The #1 platform for developers.
Microsoft Teams – Revolutionized remote work with deep Office 365 integration.
Xbox Game Pass – Netflix-style gaming with cloud streaming.
Final Verdict?
If you’re a developer, VS Code or WSL is unbeatable. If you’re into data, Excel or Power BI wins. For cutting-edge cloud/AI, Azure is king.
What’s your favorite?
If you need any Microsoft products, such as Windows , Office , Visual Studio, or Server , you can go and get it from our online store keyingo.com
8 notes
·
View notes
Text
Fecha: 15 de Noviembre.
En medio de la quietud de la noche, el refugio se sacude con un grito inesperado. Un militar irrumpe en los pasillos, sudoroso y fuera de sí, despertando a todos con su agitación. Su mensaje, aunque incompleto en su primer momento, rápidamente se esparce entre los habitantes del refugio: han encontrado un pequeño grupo de sobrevivientes en las afueras. En un suspiro, la calma de la noche desaparece y el refugio se llena de un nuevo tipo de energía.
Sin perder tiempo, los nuevos sobrevivientes son traídos al refugio, uno por uno. Su llegada es casi silenciosa, pero la emoción contenida en cada rostro lo dice todo. Son pocos, desnutridos y agotados, pero siguen vivos. Los pocos que logran reunirse en el comedor observan en silencio cómo los llevan a un rincón apartado para que puedan descansar. Las miradas entre los miembros del refugio son mixtas: desconcierto, esperanza, temor.
Por un momento, la tensión en el aire es palpable, como si todos esperaran que algo más sucediera. Pero nada más ocurre, al menos no de inmediato. Lo que ha sido una noticia inesperada y cargada de promesas se convierte en una cuestión de incertidumbre. Los sobrevivientes han llegado, pero la pregunta sigue en el aire: ¿qué significan para el futuro del refugio?
Al compartirse sus nombres, se mencionan los siguientes:
Clementine Turner, Wyatt Lee, Anton Pivott, Alycia Saat y Olivia Torres.
13 notes
·
View notes