#solardynamics
Explore tagged Tumblr posts
Visit Tumblr Blog
Explore Tumblr blogs with no restrictions, modern design and the best experience.
Last Seen Tumblr Blogs


Fun Fact
Tumblr has been banned in Indonesia for providing people with access to pornographic content.
Text
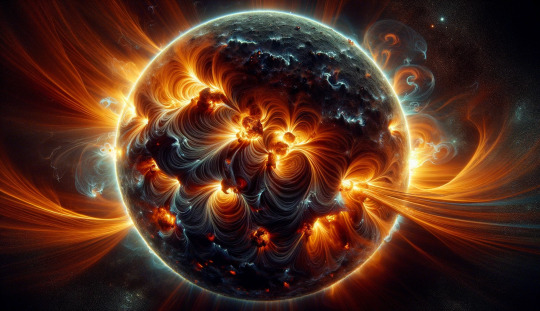
Solar Filament Eruption

From Earth, we rarely glimpse the violent flows of our home star. Here, a filament erupts from the photosphere creating a coronal mass ejection, captured in ultraviolet wavelengths by the Solar Dynamics Observatory. (Image credit: NASA/GSFC/SDO; via APOD) Read the full article
#coronalmassejection#fluiddynamics#magneticfield#magnetohydrodynamics#NASASDO#physics#plasma#science#solardynamics#sun
134 notes
·
View notes
Text
The Suns Secret | Next Solar Cycle Detected Early
https://www.youtube.com/watch?v=-WJPSHBs2vY The Sun's current solar cycle, Cycle 25, is at its peak, but scientists have already detected the first signs of the next cycle, Cycle 26, using sound waves deep within the Sun. In this video, we explore how researchers from the University of Birmingham identified these early rumblings and what this means for our understanding of solar activity. Discover how this breakthrough could impact our predictions of sunspots, solar flares, and coronal mass ejections, which have direct effects on Earth. Source: Royal Astronomical Society. #astronomy #RoyalAstronomicalsociety #solarflare #sun #solarcycle #trendstorm #sunspots #astronomynews #solaractivity #sunscience #spaceweather #Helioseismology #solarresearch #spaceexploration #Sunspots2024 #solarphysics #SolarCycle25 #SolarCycle26 #astronomyfacts #solarobservation #sunresearch #spacescience #solarphenomena #magneticfield #spacenews #solarevent #cosmicevents #solardynamics #solarsystem #solarobservation #spaceresearch #solarobservation #solartechnology #spacephysics #solarenergy #astronomyresearch #solarmax #spacediscovery Next Solar Cycle detected early Solar Cycle 26 first signs Early detection of solar cycle 26 Solar Cycle 25 and 26 comparison Upcoming solar cycles predictions Solar maximum of Cycle 25 Sun's internal sound waves in solar cycles Sunspots increase during solar maximum Solar torsional oscillation explained Detecting solar cycles through sound waves Solar activity cycle research How solar cycles affect Earth Solar Cycle 25 magnetic field changes Solar Cycle 26 predictions Understanding solar cycles in astronomy First signs of solar cycle 26 Solar torsional oscillation pattern Solar activity and its impact on Earth Solar Cycle 26 early detection Astronomical discoveries about solar cycles Solar cycles and sunspot activity How sun's sound waves predict solar cycles Solar maximum phenomena explained Solar Cycle 26 rumblings detected Sun's magnetic field and solar cycles How scientists detect new solar cycles Solar Cycle 25 halfway mark Upcoming solar activity predictions Solar cycle detection methods Sun's torsional oscillation patterns Solar cycles and aurorae visibility Solar flares during solar maximum Solar activity cycle research 2024 Solar Cycle 26 early signs Solar energy surge during solar maximum Solar Cycle 25 research updates New discoveries in solar cycles Solar Cycle 26 detected in sound waves Understanding the sun's magnetic field Solar Cycle 25 sunspot increase Solar Cycle 26 starting signs Solar Cycle 25 impact on Earth Predicting solar cycles with sound waves Solar maximum sunspot activity Solar Cycle 26 early detection research The sun's next solar cycle Astronomical research on solar cycles Solar torsional oscillation and cycles Solar Cycle 25 vs. 26 differences Early predictions for Solar Cycle 26 Solar activity cycles in astronomy Solar Cycle 25 peak activity Understanding sun's torsional oscillation Solar Cycle 26 discovery Solar Cycle 25 ongoing research Solar activity impact on Earth Solar Cycle 26 sunspot predictions Solar Cycle 25 peak phase Solar magnetic field and cycles Solar Cycle 26 early observations Sun's internal sound waves research Solar Cycle 25 to 26 transition Solar maximum and solar cycles Solar Cycle 26 future predictions Solar cycles and Earth's weather Solar Cycle 25 data analysis How solar cycles are detected Solar torsional oscillation in solar cycles Solar Cycle 26 early indicators Understanding solar maximum via Trend Storm https://www.youtube.com/channel/UCF1F2JAMftAe2z2hl32FXmQ August 22, 2024 at 05:30PM
0 notes
Text
NASA's Solar Dynamics Observatory Discovers Massive Sunspot with Potential for Solar Flares
NASA's Solar Dynamics Observatory Discovers Massive Sunspot with Potential for #SolarFlares. @neosciencehub #NASA #SDO #SunspotDiscovery #SpaceWeather #EarthImpact #SpaceScience #Astronomy #SolarObservation #SolarPhenomena #SolarDynamics #Astrophysics
In a groundbreaking discovery, NASA’s Solar Dynamics Observatory (SDO) has illuminated a colossal sunspot on the surface of the Sun, harboring energy capable of unleashing M-class solar flares. This development comes as the peak of solar cycle 25 approaches, marked by a surge in solar activities such as coronal mass ejections (CMEs), solar flares, and storms. The identified sunspot, named…
View On WordPress
#Coronal Mass Ejections (CMEs)#Earth-directed flares#featured#M-class solar flares#nasa#Solar activity#Solar cycle 25#Solar Dynamics Observatory (SDO)#Solar flares#Solar observation#Solar phenomena#space#Space science#Space weather#Sun&039;s energy#Sunspot Complex AR3490-91-92#Technological impact of solar flares
0 notes
Text
A Year on the Sun Through Our Satellite’s Eyes
Did you know we’re watching the Sun 24/7 from space?
We use a whole fleet of satellites to monitor the Sun and its influences on the solar system. One of those is the Solar Dynamics Observatory. It’s been in space for eight years, keeping an eye on the Sun almost every moment of every day. Launched on Feb. 11, 2010, this satellite (also known as SDO) was originally designed for a two-year mission, but it’s still collecting data to this day — and one of our best ways to keep an eye on our star.
To celebrate another year of SDO, we’re sharing some of our favorite solar views that the spacecraft sent back to Earth in 2017.
March: A long spotless stretch

For 15 days starting on March 7, SDO saw the yolk-like spotless Sun in visible light.
The Sun goes through a natural 11-year cycle of activity marked by two extremes: solar maximum and solar minimum. Sunspots are dark regions of complex magnetic activity on the Sun’s surface, and the number of sunspots at any given time is used as an index of solar activity.
Solar maximum = intense solar activity and more sunspots
Solar minimum = less solar activity and fewer sunspots
This March 2017 period was the longest stretch of spotlessness since the last solar minimum in April 2010 – a sure sign that the solar cycle is marching on toward the next minimum, which scientists expect in 2019-2020. For comparison, the images on the left are from Feb. 2014 – during the last solar maximum – and show a much spottier Sun.
June: Energized active regions

A pair of relatively small but frenetic active regions – areas of intense and complex magnetic fields – rotated into SDO’s view May 31 – June 2, while spouting off numerous small flares and sweeping loops of plasma. The dynamic regions were easily the most remarkable areas on the Sun during this 42-hour period.
July: Two weeks in the life of a sunspot
youtube
On July 5, SDO watched an active region rotate into view on the Sun. The satellite continued to track the region as it grew and eventually rotated across the Sun and out of view on July 17.
With their complex magnetic fields, sunspots are often the source of interesting solar activity: During its 13-day trip across the face of the Sun, the active region — dubbed AR12665 — put on a show for our Sun-watching satellites, producing several solar flares, a coronal mass ejection and a solar energetic particle event.
August: An eclipse in space

While millions of people in North America experienced a total solar eclipse on Aug. 21, SDO saw a partial eclipse from space. SDO actually sees several lunar transits a year from its perspective – but an eclipse on the ground doesn’t necessarily mean that SDO will see anything out of the ordinary. Even on Aug. 21, SDO saw only 14 percent of the Sun blocked by the Moon, while most US residents saw 60 percent blockage or more.
September: A spate of solar activity

In September 2017, SDO saw a spate of solar activity, with the Sun emitting 31 notable flares and releasing several powerful coronal mass ejections between Sept. 6-10. Solar flares are powerful bursts of radiation, while coronal mass ejections are massive clouds of solar material and magnetic fields that erupt from the Sun at incredible speeds.
One of the flares imaged by SDO on Sept. 6 was classified as X9.3 – clocking in at the most powerful flare of the current solar cycle. The current cycle began in December 2008 and is now decreasing in intensity, heading toward solar minimum. During solar minimum, such eruptions on the Sun are increasingly rare, but history has shown that they can nonetheless be intense.
September: A trio of tempests

Three distinct solar active regions with towering arches rotated into SDO’s view over a three-day period from Sept. 24-26. Charged particles spinning along the ever-changing magnetic field lines above the active regions trace out the magnetic field in extreme ultraviolet light, a type of light that is typically invisible to our eyes, but is colorized here in gold. To give some sense of scale, the largest arches are many times the size of Earth.
December: A curling prominence

SDO saw a small prominence arch up and send streams of solar material curling back into the Sun over a 30-hour period on Dec. 13-14. Prominences are relatively cool strands of solar material tethered above the Sun’s surface by magnetic fields.
December: Solar question mark

An elongated coronal hole — the darker area near the center of the Sun’s disk — looked something like a question mark when seen in extreme ultraviolet light by SDO on Dec. 21-22. Coronal holes are magnetically open areas on the Sun that allow high-speed solar wind to gush out into space. They appear as dark areas when seen in certain wavelengths of extreme ultraviolet light.
For all the latest on the Solar Dynamics Observatory, visit nasa.gov/sdo. Keep up with the latest on the Sun on Twitter @NASASun or at facebook.com/NASASunScience.
Make sure to follow us on Tumblr for your regular dose of space: http://nasa.tumblr.com
#nasa#space#sun#heliophysics#solar#observatory#SolarDynamicsObservatory#spacecraft#solardynamics#energy#magneticfield#cme#solarflare#eclipse#totalsolareclipse
2K notes
·
View notes
Video
instagram
OUR Sun Today. May 28 2020. #OurSun #SolarDynamics #Sunspots #SolarFlares #solarminimumisalongtime https://www.instagram.com/p/CAuvE6MnjK9/?igshid=38ombxbj4qb3
0 notes
Video
tumblr
The magnetic field lines between a pair of active regions formed a beautiful set of swaying arches, seen in this footage captured by our Solar Dynamics Observatory on April 24-26, 2017.
These arches, which form a connection between regions of opposite magnetic polarity, are visible in exquisite detail in this wavelength of extreme ultraviolet light. Extreme ultraviolet light is typically invisible to our eyes, but is colorized here in gold.
Take a closer look: https://go.nasa.gov/2pGgYZt
Make sure to follow us on Tumblr for your regular dose of space: http://nasa.tumblr.com
2K notes
·
View notes