#sql on prem to azure
Explore tagged Tumblr posts
Visit Tumblr Blog
Explore Tumblr blogs with no restrictions, modern design and the best experience.
Last Seen Tumblr Blogs


Fun Fact
Tumblr Inc. is using 66 technologies for its website.
Text
How Azure Supports Big Data and Real-Time Data Processing

The explosion of digital data in recent years has pushed organizations to look for platforms that can handle massive datasets and real-time data streams efficiently. Microsoft Azure has emerged as a front-runner in this domain, offering robust services for big data analytics and real-time processing. Professionals looking to master this platform often pursue the Azure Data Engineering Certification, which helps them understand and implement data solutions that are both scalable and secure.
Azure not only offers storage and computing solutions but also integrates tools for ingestion, transformation, analytics, and visualization—making it a comprehensive platform for big data and real-time use cases.
Azure’s Approach to Big Data
Big data refers to extremely large datasets that cannot be processed using traditional data processing tools. Azure offers multiple services to manage, process, and analyze big data in a cost-effective and scalable manner.
1. Azure Data Lake Storage
Azure Data Lake Storage (ADLS) is designed specifically to handle massive amounts of structured and unstructured data. It supports high throughput and can manage petabytes of data efficiently. ADLS works seamlessly with analytics tools like Azure Synapse and Azure Databricks, making it a central storage hub for big data projects.
2. Azure Synapse Analytics
Azure Synapse combines big data and data warehousing capabilities into a single unified experience. It allows users to run complex SQL queries on large datasets and integrates with Apache Spark for more advanced analytics and machine learning workflows.
3. Azure Databricks
Built on Apache Spark, Azure Databricks provides a collaborative environment for data engineers and data scientists. It’s optimized for big data pipelines, allowing users to ingest, clean, and analyze data at scale.
Real-Time Data Processing on Azure
Real-time data processing allows businesses to make decisions instantly based on current data. Azure supports real-time analytics through a range of powerful services:
1. Azure Stream Analytics
This fully managed service processes real-time data streams from devices, sensors, applications, and social media. You can write SQL-like queries to analyze the data in real time and push results to dashboards or storage solutions.
2. Azure Event Hubs
Event Hubs can ingest millions of events per second, making it ideal for real-time analytics pipelines. It acts as a front-door for event streaming and integrates with Stream Analytics, Azure Functions, and Apache Kafka.
3. Azure IoT Hub
For businesses working with IoT devices, Azure IoT Hub enables the secure transmission and real-time analysis of data from edge devices to the cloud. It supports bi-directional communication and can trigger workflows based on event data.
Integration and Automation Tools
Azure ensures seamless integration between services for both batch and real-time processing. Tools like Azure Data Factory and Logic Apps help automate the flow of data across the platform.
Azure Data Factory: Ideal for building ETL (Extract, Transform, Load) pipelines. It moves data from sources like SQL, Blob Storage, or even on-prem systems into processing tools like Synapse or Databricks.
Logic Apps: Allows you to automate workflows across Azure services and third-party platforms. You can create triggers based on real-time events, reducing manual intervention.
Security and Compliance in Big Data Handling
Handling big data and real-time processing comes with its share of risks, especially concerning data privacy and compliance. Azure addresses this by providing:
Data encryption at rest and in transit
Role-based access control (RBAC)
Private endpoints and network security
Compliance with standards like GDPR, HIPAA, and ISO
These features ensure that organizations can maintain the integrity and confidentiality of their data, no matter the scale.
Career Opportunities in Azure Data Engineering
With Azure’s growing dominance in cloud computing and big data, the demand for skilled professionals is at an all-time high. Those holding an Azure Data Engineering Certification are well-positioned to take advantage of job roles such as:
Azure Data Engineer
Cloud Solutions Architect
Big Data Analyst
Real-Time Data Engineer
IoT Data Specialist
The certification equips individuals with knowledge of Azure services, big data tools, and data pipeline architecture—all essential for modern data roles.
Final Thoughts
Azure offers an end-to-end ecosystem for both big data analytics and real-time data processing. Whether it’s massive historical datasets or fast-moving event streams, Azure provides scalable, secure, and integrated tools to manage them all.
Pursuing an Azure Data Engineering Certification is a great step for anyone looking to work with cutting-edge cloud technologies in today’s data-driven world. By mastering Azure’s powerful toolset, professionals can design data solutions that are future-ready and impactful.
#Azure#BigData#RealTimeAnalytics#AzureDataEngineer#DataLake#StreamAnalytics#CloudComputing#AzureSynapse#IoTHub#Databricks#CloudZone#AzureCertification#DataPipeline#DataEngineering
0 notes
Text
Top 10 AI Tools for Embedded Analytics and Reporting (May 2025)
New Post has been published on https://thedigitalinsider.com/top-10-ai-tools-for-embedded-analytics-and-reporting-may-2025/
Top 10 AI Tools for Embedded Analytics and Reporting (May 2025)
Embedded analytics refers to integrating interactive dashboards, reports, and AI-driven data insights directly into applications or workflows. This approach lets users access analytics in context without switching to a separate BI tool. It’s a rapidly growing market – valued around $20 billion in 2024 and projected to reach $75 billion by 2032 (18% CAGR).
Organizations are embracing embedded analytics to empower end-users with real-time information. These trends are fueled by demand for self-service data access and AI features like natural language queries and automated insights, which make analytics more accessible.
Below we review top tools that provide AI-powered embedded analytics and reporting. Each tool includes an overview, key pros and cons, and a breakdown of pricing tiers.
AI Tools for Embedded Analytics and Reporting (Comparison Table)
AI Tool Best For Price Features Explo Turnkey, white-label SaaS dashboards Free internal · embed from $795/mo No-code builder, Explo AI NLQ, SOC 2/HIPAA ThoughtSpot Google-style NL search for data in apps Dev trial free · usage-based quote SpotIQ AI insights, search & Liveboards embed Tableau Embedded Pixel-perfect visuals & broad connectors $12–70/user/mo Pulse AI summaries, drag-drop viz, JS API Power BI Embedded Azure-centric, cost-efficient scaling A1 capacity from ~$735/mo NL Q&A, AutoML visuals, REST/JS SDK Looker Governed metrics & Google Cloud synergy Custom (≈$120k+/yr) LookML model, secure embed SDK, BigQuery native Sisense OEMs needing deep white-label control Starter ≈$10k/yr · Cloud ≈$21k/yr ElastiCube in-chip, NLQ, full REST/JS APIs Qlik Associative, real-time data exploration $200–2,750/mo (capacity-based) Associative engine, Insight Advisor AI, Nebula.js Domo Everywhere Cloud BI with built-in ETL & sharing From ~$3k/mo (quote) 500+ connectors, alerts, credit-based scaling Yellowfin BI Data storytelling & flexible OEM pricing Custom (≈$15k+/yr) Stories, Signals AI alerts, multi-tenant Mode Analytics SQL/Python notebooks to embedded reports Free · Pro ≈$6k/yr Notebooks, API embed, Visual Explorer
(Source: Explo)
Explo is an embedded analytics platform designed for product and engineering teams to quickly add customer-facing dashboards and reports to their apps. It offers a no-code interface for creating interactive charts and supports white-labeled embedding, so the analytics blend into your product’s UI.
Explo focuses on self-service: end-users can explore data and even build ad hoc reports without needing developer intervention. A standout feature is Explo AI, a generative AI capability that lets users ask free-form questions and get back relevant charts automatically.
This makes data exploration as easy as typing a query in natural language. Explo integrates with many databases and is built to scale from startup use cases to enterprise deployments (it’s SOC II, GDPR, and HIPAA compliant for security).
Pros and Cons
Drag-and-drop dashboards—embed in minutes
Generative AI (Explo AI) for NLQ insights
Full white-label + SOC 2 / HIPAA compliance
Young platform; smaller community
Costs rise with large end-user counts
Cloud-only; no on-prem deployment
Pricing: (Monthly subscriptions – USD)
Launch – Free: Internal BI use only; unlimited internal users/dashboards.
Growth – from $795/month: For embedding in apps; includes 3 embedded dashboards, 25 customer accounts.
Pro – from $2,195/month: Advanced embedding; unlimited dashboards, full white-label, scales with usage.
Enterprise – Custom: Custom pricing for large scale deployments; includes priority support, SSO, custom features.
Visit Explo →
ThoughtSpot is an AI-driven analytics platform renowned for its search-based interface. With ThoughtSpot’s embedded analytics, users can type natural language queries (or use voice) to explore data and instantly get visual answers.
This makes analytics accessible to non-technical users – essentially a Google-like experience for your business data. ThoughtSpot’s in-memory engine handles large data volumes, and its AI engine (SpotIQ) automatically finds insights and anomalies.
For embedding, ThoughtSpot provides low-code components and robust REST APIs/SDKs to integrate interactive Liveboards (dashboards) or even just the search bar into applications. It’s popular for customer-facing analytics in apps where end-users need ad-hoc querying ability.
Businesses in retail, finance, and healthcare use ThoughtSpot to let frontline employees and customers ask data questions on the fly. The platform emphasizes ease-of-use and fast deployment, though it also offers enterprise features like row-level security and scalability across cloud data warehouses.
Pros and Cons
Google-style NL search for data
SpotIQ AI auto-surfaces trends
Embeds dashboards, charts, or just the search bar
Enterprise-grade pricing for SMBs
Limited advanced data modeling
Setup needs schema indexing expertise
Pricing: (Tiered, with consumption-based licensing – USD)
Essentials – $1,250/month (billed annually): For larger deployments; increased data capacity and features.
ThoughtSpot Pro: Custom quote. Full embedding capabilities for customer-facing apps (up to ~500 million data rows).
ThoughtSpot Enterprise: Custom quote. Unlimited data scale and enterprise SLA. Includes multi-tenant support, advanced security, etc.
Visit ThoughtSpot →
Tableau (part of Salesforce) is a leading BI platform known for its powerful visualization and dashboarding capabilities. Tableau Embedded Analytics allows organizations to integrate Tableau’s interactive charts and reports into their own applications or websites.
Developers can embed Tableau dashboards via iFrames or using the JavaScript API, enabling rich data visuals and filtering in-app. Tableau’s strength lies in its breadth of out-of-the-box visuals, drag-and-drop ease for creating dashboards, and a large user community.
It also has introduced AI features – for example, in 2024 Salesforce announced Tableau Pulse, which uses generative AI to deliver automated insights and natural language summaries to users. This augments embedded dashboards with proactive explanations.
Tableau works with a wide range of data sources and offers live or in-memory data connectivity, ensuring that embedded content can display up-to-date info. It’s well-suited for both internal embedded use (e.g. within an enterprise portal) and external customer-facing analytics, though licensing cost and infrastructure must be planned accordingly.
Pros and Cons
Market-leading visual library
New “Pulse” AI summaries & NLQ
Broad data connectors + massive community
License cost balloons at scale
Requires Tableau Server/Cloud infrastructure
Styling customization via JS API only
Pricing: (Subscription per user, with role-based tiers – USD)
Creator – $70 per user/month: Full authoring license (data prep, dashboard creation). Needed for developers building embedded dashboards.
Explorer – $35 per user/month: For users who explore and edit limited content. Suitable for internal power users interacting with embedded reports.
Viewer – $12 per user/month: Read-only access to view dashboards. For end viewers of embedded analytics.
Visit Tableau →
Microsoft Power BI is a widely-used BI suite, and Power BI Embedded refers to the Azure service and APIs that let you embed Power BI visuals into custom applications. This is attractive for developers building customer-facing analytics, as it combines Power BI’s robust features (interactive reports, AI visuals, natural language Q&A, etc.) with flexible embedding options.
You can embed full reports or individual tiles, control them via REST API, and apply row-level security for multi-tenant scenarios. Power BI’s strengths include tight integration with the Microsoft ecosystem (Azure, Office 365), strong data modeling (via Power BI Desktop), and growing AI capabilities (e.g. the Q&A visual that allows users to ask questions in plain English).
Pros and Cons
Rich BI + AI visuals (NL Q&A, AutoML)
Azure capacity pricing scales to any user base
Deep Microsoft ecosystem integration
Initial setup can be complex (capacities, RLS)
Devs need Power BI Pro licenses
Some portal features absent in embeds
Pricing: (Azure capacity-based or per-user – USD)
Power BI Pro – $14/user/month: Enables creating and sharing reports. Required for developers and any internal users of embedded content.
Power BI Premium Per User – $24/user/month: Enhanced features (AI, larger datasets) on a per-user basis. Useful if a small number of users need premium capabilities instead of a full capacity.
Power BI Embedded (A SKUs) – From ~$735/month for A1 capacity (3 GB RAM, 1 v-core). Scales up to ~$23,500/month for A6 (100 GB, 32 cores) for high-end needs. Billed hourly via Azure, with scale-out options.
Visit Power BI →
Looker is a modern analytics platform now part of Google Cloud. It is known for its unique data modeling layer, LookML, which lets data teams define business metrics and logic centrally.
For embedded analytics, Looker provides a robust solution: you can embed interactive dashboards or exploratory data tables in applications, leveraging the same Looker backend. One of Looker’s core strengths is consistency – because of LookML, all users (and embedded views) use trusted data definitions, avoiding mismatched metrics.
Looker also excels at integrations: it connects natively to cloud databases (BigQuery, Snowflake, etc.), and because it’s in the Google ecosystem, it integrates with Google Cloud services (permissions, AI/ML via BigQuery, etc.).
Pros and Cons
LookML enforces single source of truth
Secure embed SDK + full theming
Tight BigQuery & Google AI integration
Premium six-figure pricing common
Steep LookML learning curve
Visuals less flashy than Tableau/Power BI
Pricing: (Custom quotes via sales; example figures)
Visit Looker →
Sisense is a full-stack BI and analytics platform with a strong focus on embedded analytics use cases. It enables companies to infuse analytics into their products via flexible APIs or web components, and even allows building custom analytic apps.
Sisense is known for its ElastiCube in-chip memory technology, which can mash up data from multiple sources and deliver fast performance for dashboards. In recent years, Sisense has incorporated AI features (e.g. NLQ, automated insights) to stay competitive.
A key advantage of Sisense is its ability to be fully white-labeled and its OEM-friendly licensing, which is why many SaaS providers choose it to power their in-app analytics. It offers both cloud and on-premises deployment options, catering to different security requirements.
Sisense also provides a range of customization options: you can embed entire dashboards or individual widgets, and use their JavaScript library to deeply customize look and feel. It’s suited for organizations that need an end-to-end solution – from data preparation to visualization – specifically tailored for embedding in external applications.
Pros and Cons
ElastiCube fuses data fast in-memory
White-label OEM-friendly APIs
AI alerts & NLQ for end-users
UI learning curve for new users
Quote-based pricing can be steep
Advanced setup often needs dev resources
Pricing: (Annual license, quote-based – USD)
Starter (Self-Hosted) – Starts around $10,000/year for a small deployment (few users, basic features). This would typically be an on-prem license for internal BI or limited OEM use.
Cloud (SaaS) Starter – ~$21,000/year for ~5 users on Sisense Cloud (cloud hosting carries ~2× premium over self-host).
Growth/Enterprise OEM – Costs scale significantly with usage; mid-range deployments often range $50K-$100K+ per year. Large enterprise deals can reach several hundred thousand or more if there are very high numbers of end-users.
Visit Sisense →
Qlik is a long-time leader in BI, offering Qlik Sense as its modern analytics platform. Qlik’s embedded analytics capabilities allow you to integrate its associative data engine and rich visuals into other applications.
Qlik’s differentiator is its Associative Engine: users can freely explore data associations (making selections across any fields) and the engine instantly updates all charts to reflect those selections, revealing hidden insights.
In an embedded scenario, this means end-users can get powerful interactive exploration, not just static filtered views. Qlik provides APIs (Capability API, Nebula.js library, etc.) to embed charts or even build fully custom analytics experiences on top of its engine. It also supports standard embed via iframes or mashups.
Qlik has incorporated AI as well – the Insight Advisor can generate insights or chart suggestions automatically. For developers, Qlik’s platform is quite robust: you can script data transformations in its load script, use its security rules for multi-tenant setups, and even embed Qlik into mobile apps.
Pros and Cons
Associative engine enables free exploration
Fast in-memory performance for big data
Robust APIs + Insight Advisor AI
Unique scripting → higher learning curve
Enterprise-level pricing
UI can feel dated without theming
Pricing: (USD)
Starter – $200 / month (billed annually): Includes 10 users + 25 GB “data for analysis.” No extra data add-ons available.
Standard – $825 / month: Starts with 25 GB; buy more capacity in 25 GB blocks. Unlimited user access.
Premium – $2,750 / month: Starts with 50 GB, adds AI/ML, public/anonymous access, larger app sizes (10 GB).
Enterprise – Custom quote: Begins at 250 GB; supports larger app sizes (up to 40 GB), multi-region tenants, expanded AI/automation quotas.
Visit Qlik →
Domo is a cloud-first business intelligence platform, and Domo Everywhere is its embedded analytics solution aimed at sharing Domo’s dashboards outside the core Domo environment. With Domo Everywhere, companies can distribute interactive dashboards to customers or partners via embed codes or public links, while still managing everything from the central Domo instance.
Domo is known for its end-to-end capabilities in the cloud – from data integration (500+ connectors, built-in ETL called Magic ETL) to data visualization and even a built-in data science layer.
For embedding, Domo emphasizes ease of use: non-technical users can create dashboards in Domo’s drag-and-drop interface, then simply embed them with minimal coding. It also offers robust governance so you can control what external viewers see.
Pros and Cons
End-to-end cloud BI with 500+ connectors
Simple drag-and-embed workflow
Real-time alerts & collaboration tools
Credit-based pricing tricky to budget
Cloud-only; no on-prem option
Deeper custom UI needs dev work
Pricing: (Subscription, contact Domo for quote – USD)
Basic Embedded Package – roughly $3,000 per month for a limited-user, limited-data scenario. This might include a handful of dashboards and a moderate number of external viewers.
Mid-size Deployment – approximately $20k–$50k per year for mid-sized businesses. This would cover more users and data; e.g., a few hundred external users with regular usage.
Enterprise – $100k+/year for large-scale deployments. Enterprises with thousands of external users or very high data volumes can expect costs in six figures. (Domo often structures enterprise deals as unlimited-user but metered by data/query credits.)
Visit Domo →
Yellowfin is a BI platform that has carved a niche in embedded analytics and data storytelling. It offers a cohesive solution with modules for dashboards, data discovery, automated signals (alerts on changes), and even a unique Story feature for narrative reporting.
For embedding, Yellowfin Embedded Analytics provides OEM partners a flexible licensing model and technical capabilities to integrate Yellowfin content into their applications. Yellowfin’s strength lies in its balanced focus: it’s powerful enough for enterprise BI but also streamlined for embedding, with features like multi-tenant support and white-labeling.
It also has NLP query (natural language querying) and AI-driven insights, aligning with modern trends. A notable feature is Yellowfin’s data storytelling – you can create slide-show style narratives with charts and text, which can be embedded to give end-users contextual analysis, not just raw dashboards.
Yellowfin is often praised for its collaborative features (annotations, discussion threads on charts) which can be beneficial in an embedded context where you want users to engage with the analytics.
Pros and Cons
Built-in Stories & Signals for narratives
OEM pricing adaptable (fixed or revenue-share)
Multi-tenant + full white-label support
Lower brand recognition vs. “big three”
Some UI elements feel legacy
Advanced features require training
Pricing: (Custom – Yellowfin offers flexible models)
Visit Yellowfin →
Mode is a platform geared towards advanced analysts and data scientists, combining BI with notebooks. It’s now part of ThoughtSpot (acquired in 2023) but still offered as a standalone solution.
Mode’s appeal in an embedded context is its flexibility: analysts can use SQL, Python, and R in one environment to craft analyses, then publish interactive visualizations or dashboards that can be embedded into web apps. This means if your application’s analytics require heavy custom analysis or statistical work, Mode is well-suited.
It has a modern HTML5 dashboarding system and recently introduced “Visual Explorer” for drag-and-drop charting, plus AI assist features for query suggestions. Companies often use Mode to build rich, bespoke analytics for their customers – for example, a software company might use Mode to develop a complex report, and then embed that report in their product for each customer with the data filtered appropriately.
Mode supports white-label embedding, and you can control it via their API (to provision users, run queries, etc.). It’s popular with data teams due to the seamless workflow from coding to sharing insights.
Pros and Cons
Unified SQL, Python, R notebooks → dashboards
Strong API for automated embedding
Generous free tier for prototyping
Analyst skills (SQL/Python) required
Fewer NLQ/AI features for end-users
Visualization options less extensive than Tableau
Pricing: (USD)
Studio (Free) – $0 forever for up to 3 users. This includes core SQL/Python/R analytics, private data connections, 10MB query limit, etc. Good for initial development and testing of embedded ideas.
Pro (Business) – Starts around ~$6,000/year (estimated). Mode doesn’t list fixed prices, but third-party sources indicate pro plans in the mid four-figure range annually for small teams.
Enterprise – Custom pricing, typically five-figure annually up to ~$50k for large orgs. Includes all Pro features plus enterprise security (SSO, advanced permissions), custom compute for heavy workloads, and premium support.
Visit Mode →
How to Choose the Right Embedded Analytics Tool
Selecting an embedded analytics solution requires balancing your company’s needs with each tool’s strengths. Start with your use case and audience: Consider who will be using the analytics and their technical level. If you’re embedding dashboards for non-technical business users or customers, a tool with an easy UI could be important. Conversely, if your application demands highly custom analyses or you have a strong data science team, a more flexible code-first tool might be better.
Also evaluate whether you need a fully managed solution (more plug-and-play, e.g. Explo or Domo) or are willing to manage more infrastructure for a potentially more powerful platform (e.g. self-hosting Qlik or Sisense for complete control). The size of your company (and engineering resources) will influence this trade-off – startups often lean towards turnkey cloud services, while larger enterprises might integrate a platform into their existing tech stack.
Integration and scalability are critical factors. Look at how well the tool will integrate with your current systems and future architecture. Finally, weigh pricing and total cost of ownership against your budget and revenue model. Embedded analytics tools vary from per-user pricing to usage-based and fixed OEM licenses. Map out a rough projection of costs for 1 year and 3 years as your user count grows.
FAQs (Embedded Analytics and Reporting)
1. What are the main differences between Tableau and Power BI?
Tableau focuses on advanced visual design, cross-platform deployment (on-prem or any cloud), and a large viz library, but it costs more per user. Power BI is cheaper, tightly integrated with Microsoft 365/Azure, and great for Excel users, though some features require an Azure capacity and Windows-centric stack.
2. How does Sisense handle large datasets compared to other tools?
Sisense’s proprietary ElastiCube “in-chip” engine compresses data in memory, letting a single node serve millions of rows while maintaining fast query response; benchmarks show 500 GB cubes on 128 GB RAM. Competing BI tools often rely on external warehouses or slower in-memory engines for similar workloads.
3. Which embedded analytics tool offers the best customization options?
Sisense and Qlik are stand-outs: both expose full REST/JavaScript APIs, support deep white-labeling, and let dev teams build bespoke visual components or mashups—ideal when you need analytics to look and feel 100 % native in your app.
4. Are there any free alternatives to Tableau and Sisense?
Yes—open-source BI platforms like Apache Superset, Metabase, Redash, and Google’s free Looker Studio deliver dashboarding and basic embedded options at zero cost (self-hosted or SaaS tiers), making them good entry-level substitutes for smaller teams or tight budgets.
#000#2023#2024#2025#250#Accounts#ADD#ai#ai tools#AI-powered#AI/ML#alerts#amp#analyses#Analysis#Analytics#anomalies#Apache#API#APIs#app#applications#approach#apps#architecture#automation#autoML#azure#benchmarks#Best Of
0 notes
Text
Understanding Data Movement in Azure Data Factory: Key Concepts and Best Practices
Introduction
Azure Data Factory (ADF) is a fully managed, cloud-based data integration service that enables organizations to move and transform data efficiently. Understanding how data movement works in ADF is crucial for building optimized, secure, and cost-effective data pipelines.
In this blog, we will explore: ✔ Core concepts of data movement in ADF ✔ Data flow types (ETL vs. ELT, batch vs. real-time) ✔ Best practices for performance, security, and cost efficiency ✔ Common pitfalls and how to avoid them
1. Key Concepts of Data Movement in Azure Data Factory
1.1 Data Movement Overview
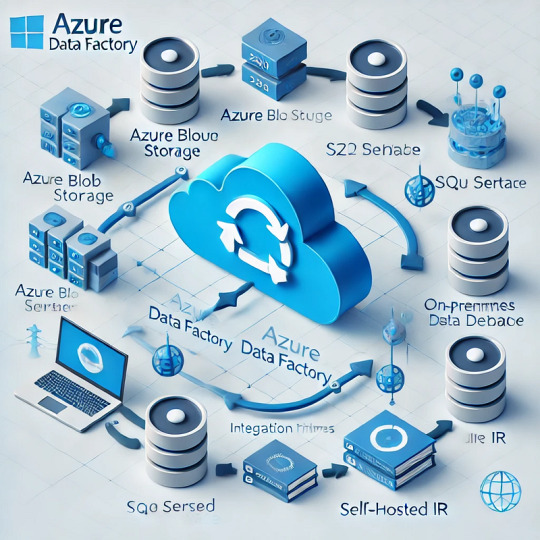
ADF moves data between various sources and destinations, such as on-premises databases, cloud storage, SaaS applications, and big data platforms. The service relies on integration runtimes (IRs) to facilitate this movement.
1.2 Integration Runtimes (IRs) in Data Movement
ADF supports three types of integration runtimes:
Azure Integration Runtime (for cloud-based data movement)
Self-hosted Integration Runtime (for on-premises and hybrid data movement)
SSIS Integration Runtime (for lifting and shifting SSIS packages to Azure)
Choosing the right IR is critical for performance, security, and connectivity.
1.3 Data Transfer Mechanisms
ADF primarily uses Copy Activity for data movement, leveraging different connectors and optimizations:
Binary Copy (for direct file transfers)
Delimited Text & JSON (for structured data)
Table-based Movement (for databases like SQL Server, Snowflake, etc.)
2. Data Flow Types in ADF
2.1 ETL vs. ELT Approach
ETL (Extract, Transform, Load): Data is extracted, transformed in a staging area, then loaded into the target system.
ELT (Extract, Load, Transform): Data is extracted, loaded into the target system first, then transformed in-place.
ADF supports both ETL and ELT, but ELT is more scalable for large datasets when combined with services like Azure Synapse Analytics.
2.2 Batch vs. Real-Time Data Movement
Batch Processing: Scheduled or triggered executions of data movement (e.g., nightly ETL jobs).
Real-Time Streaming: Continuous data movement (e.g., IoT, event-driven architectures).
ADF primarily supports batch processing, but for real-time processing, it integrates with Azure Stream Analytics or Event Hub.
3. Best Practices for Data Movement in ADF
3.1 Performance Optimization
✅ Optimize Data Partitioning — Use parallelism and partitioning in Copy Activity to speed up large transfers. ✅ Choose the Right Integration Runtime — Use self-hosted IR for on-prem data and Azure IR for cloud-native sources. ✅ Enable Compression — Compress data during transfer to reduce latency and costs. ✅ Use Staging for Large Data — Store intermediate results in Azure Blob or ADLS Gen2 for faster processing.
3.2 Security Best Practices
🔒 Use Managed Identities & Service Principals — Avoid using credentials in linked services. 🔒 Encrypt Data in Transit & at Rest — Use TLS for transfers and Azure Key Vault for secrets. 🔒 Restrict Network Access — Use Private Endpoints and VNet Integration to prevent data exposure.
3.3 Cost Optimization
💰 Monitor & Optimize Data Transfers — Use Azure Monitor to track pipeline costs and adjust accordingly. 💰 Leverage Data Flow Debugging — Reduce unnecessary runs by debugging pipelines before full execution. 💰 Use Incremental Data Loads — Avoid full data reloads by moving only changed records.
4. Common Pitfalls & How to Avoid Them
❌ Overusing Copy Activity without Parallelism — Always enable parallel copy for large datasets. ❌ Ignoring Data Skew in Partitioning — Ensure even data distribution when using partitioned copy. ❌ Not Handling Failures with Retry Logic — Use error handling mechanisms in ADF for automatic retries. ❌ Lack of Logging & Monitoring — Enable Activity Runs, Alerts, and Diagnostics Logs to track performance.
Conclusion
Data movement in Azure Data Factory is a key component of modern data engineering, enabling seamless integration between cloud, on-premises, and hybrid environments. By understanding the core concepts, data flow types, and best practices, you can design efficient, secure, and cost-effective pipelines.
Want to dive deeper into advanced ADF techniques? Stay tuned for upcoming blogs on metadata-driven pipelines, ADF REST APIs, and integrating ADF with Azure Synapse Analytics!
WEBSITE: https://www.ficusoft.in/azure-data-factory-training-in-chennai/
0 notes
Text
Migrating SQL Server On-Prem to the Cloud: A Guide to AWS, Azure, and Google Cloud
Taking your on-premises SQL Server databases to the cloud opens a world of benefits such as scalability, flexibility, and often, reduced costs. However, the journey requires meticulous planning and execution. We will delve into the migration process to three of the most sought-after cloud platforms: Amazon Web Services (AWS), Microsoft Azure, and Google Cloud Platform (GCP), providing you with…
View On WordPress
0 notes
Link
2 notes
·
View notes
Text
2019 Documentation & 2020 Resolution
回想起来自己已经两年没有写博客啦。这样没有记录的生活,再回想起来,竟然不记得多少回忆的瞬间:当然,如果硬着头皮想想,我还是能记起两年来的每个瞬间,可是以后呢?
2019年的这些瞬间,有些是现在想起来都觉得幸福和快乐的,有些呢,有些我只希望把那些瞬间永远的掩埋在那些时间里,然后再立上一座墓碑。
一月
想想2019年的一年,年初的时候我在哪里?刚刚去boc山里的项目,为了可视化报表的事情而加班,一直一直加班到春节前。那时候的目标很简单:和boc的兄弟们融入到一起,然后尽力把自己手上负责PowerBI和服务器所有开发的事情做完。重复地加班,在���关村的公司,和兄弟们一起奋斗的感觉是很幸福的。也是那段时间后PowerBI的从头到尾都让我有了一些底气。
二月
春节时候和教员、茄子和她的小伙伴一起去丹东旅行,冬天的旅行就是泡温泉和暖气房里的Switch游戏,后来茄子的男朋友也加入游戏,整个三天都很放松。独自回京后,在山里的办公场地转到了海鹰,从起初几天的没什么事情可做(正是这个时间里我读完了英文版全本的SQL Query Guidance),到二期可视化的内容开始:又一批暗无天日的加班。在自己的阴历生日时候,加班后请海涛和刚哥深夜烧烤,是二月份最开心的一晚了。
其实从那时起注意到伟哥每天晚上都很早下班,去住酒店,注意到他中午从不回座位,后来又听说了他和办公室里小姑娘的故事,后来的后来又发生了很多很多事情…
三月
二期的项目在三月中旬接近尾声,这个月我和yaj学会了打壁球(她打得好好),和昕桐周末呆在一起,还和龙哥去爬了次山(虽然后来再没有爬过,希望开春再去爬山)。运动又春天的一个月。
四月
项目结束后,在球台的项目做了一个差不多的项目,这个时候慢慢做一点点SQL的事情。在四月底的时候做了科技大会的项目:第一次写代码写到去厕所哭的地步,可是这次之后我学到两件事情:没有什么是真的解决不了的;永远做好十足的准备。科技大会顺利结束,期间清明节和教员去了济南,后来又去zhuozhuo家录了些合唱。看了心动的信号和喜欢你我也是两个综艺——这两个综艺最大的收获其实是:女生可以多么优秀呢?看看华尔街纳斯达克的超超:)
五月
五月是自己最黑暗的一个月:二期投产后,没有什么事情可做,整天呆在工位东想西想,完全不在状态。五月的末尾去了上海培训,其实我希望能够再去一次、再逛一次上海,希望可以覆盖掉所有五月黑暗的经历。后来八月的前奏,我写了一首歌词,又在20年的2月修改后谱了曲。
六月
六月的端午节科技大会闭幕,白天依然没事可做,东想西想下去,周末和zhuozhuo出去玩,又去TMC和人说说话。实话讲,我不知道自己6月做了什么。
七月
去美国ready之前,最后一个在海鹰的晚上,我放着海龟先生的《咿呀呀》,在楼下的椅子上哭了很久,在海鹰的日子终于结束,我又有一个新的开始。
Ready是和朋友们,和zhuozhuo一起玩耍最快乐的时候:晚上和zhuozhuo录歌,白天因为时差而醒不过来,唯一遗憾的是没有认真听课。和zhuozhuo偷偷跑了很多很多地方,后面又和yaj,然总逛遍旧金山和LA。当然在这期间我想通了:要和自己喜欢的人在一起,不喜欢的人不必勉强,不喜欢的人会吸走你身上的正能量的。
八月
Ready回来,先是自己过了很多MIP,后面就在山里,坐在新的工位上,一边做非功能项目的事情,一边做运维的熟悉。八月和九月一直在出差,去长春,顺便回家,去大连,去武汉…把zhuozhuo请到家里来玩,和教员一起,又在很多个周末做了有趣的乐器录歌,感觉自己很幸福。开始学习指弹吉他:)
九月
九月的主题应该是断舍离与零浪费。这个月里我尝试了很多很多断舍离和零浪费的方法,并且希望自己一直一直做下去,认清自己需要的东西,而不是应该需要的东西。九月的末尾搬了家,和新生活say hello。我彻底摆脱了三个月前灰暗的、停滞不前的生活。
九月的末尾我加入了乐队,编曲、排练,是民乐团之后最快乐的时候。愿意来回打车两个小时从客户去公司,每周期待两个晚上的排练,就像本科时候每周期待的PSC活动。
十月
十月的开头,我和zhuo去了甘南和阿坝,第一次上到了四千多米的高原地区,明显感觉到心跳加速,可是整个旅程轻松又愉快。十月又去了天津看反光镜乐队的live,在深夜的街上跳舞,去了陪你走一路公益活动,在深夜的地坛群魔乱舞——十月是秋游的季节,每个周末都在秋游:去石花洞,去欢乐谷过山车,去客户旁边的野外爬山…周中的晚上也有排练,试了吉他、打鼓、合成器,觉得最喜欢的还是站着弹吉他,因为可以随意晃动呀!
十一月
十一月的开头和于二狗去听了Rachael的live:这是一场我预谋好久的live,最喜欢的外国女歌手,演唱会的最后竟唱了那首<Sunday Afternoon>,那段时间最喜欢的一首歌。有人在下面喊“you saved me”。
十一月也做完了动态基线的项目,在公司跟戈哥他们呆了很多天,做完了让苗老板表扬的Presentation,跟于二狗去试了空中瑜伽,末尾又去了澳门出差,跟阿俊和mingjie讲了很多很多话,发现人不论到了什么年纪,打开心扉的时候都是不自信且孩子气的;澳门的周末zhuozhuo从深圳过来一起玩,又一起回了深圳。
十一月的末尾也交了另一个好朋友队长,开心并幸运。
alter ego perfecto.
十二月
十二月最开心的事就是去海淀二小给小朋友们讲编程一小时。与其说是给小朋友讲,不如说自己在其中学到了很多:小学生的英文水平、思辨能力、给孩子讲故事的tips…还有Alain看起来很喜欢那堂课的样子。
后来迎接beer和他的女朋友从瑞典回来,为数不多让我觉得超级和谐的一对:一起去射了箭,逗了柴犬,吃了火锅…又去听了zhuo在少年宫的合唱纪念:匆匆的每一天都那么充实。十二月“醉”了很多次,醉了之后想不起前半年的奇怪的生活和思绪,醉了也会放大所有感情的表达,奇奇怪怪地用完了很多拍立得相片…
一月
过年之前乐队音乐会这件大事终于完成,借着音乐会的完成,晚上的智能柜台的聚餐我又醉了一次:这一年就要结束了呀,心情就像一个反抛物线:如果我又回到那时的自己,我可以更快地走过来吗?如果没有回到山里的决定,我究竟什么时候可以走下楼顶呢?
其实一月还是有件不开心的事,pm把bot的事情给我之后,我一直都处于很纠结的状态:和这边的另一个dev很久也没有编译成功他的工程,虽然没有更多进展的需求,但是对于c#等等所有编程语言的不了解,像哽在喉咙里。
-------------------------
一年的流水账就这样过去,很多很多的快乐和一些又一些的遗憾。
最大的快乐是每个周末都跟朋友们有闪光的回忆,乐队的排练和演出,和交到好朋友。但是经历了前半年心里的起伏之后,以后的我也不会容易地掉入循环之中了。 最大的遗憾是没有在课余生活那么努力地学习了,
事情多起来的时候仿佛就把重要但不紧��的事情放到了旁边。
新的一年第一件事一定是set up goal and tight schedule了.
-------------------------
这一年的主题给自己定为Productivity & Hack the Habits.
从工作以来的经历看,我感兴趣的一直在于BI相关开发,几个月来让我学习AD,System Center各种软件的时候,总是没有那么有动力;而在做数据相关工作的时候,总是喜欢自愿加班,快快完成。在学生时代我做过各种各样的尝试,那些尝试都没有给我过这样的感觉。
Responsibilities
Data Scientist in London, Other, United Kingdom | Engineering at MicrosoftJob details | Microsoft Careers
Consult with stakeholders across the organisation to design, run and evaluate experiments (ABn, multivariate test etc.)
Conduct in-depth analysis on huge datasets, and present rich and actionable insights that enables a data-lead product cycle
Research novel statistical approaches to ensure we are using the cutting-edge techniques to analyse our data
Develop and deploy machine learning models powering intelligence product features
Create compelling dashboards that improve team’s self-serve capability
Educate internal customers on data insights and promote data-driven culture
Design innovative metrics that reflect immediate and long-term impacts on user experience
Qualifications
We’d like to hear from you if you
Value diversity and inclusivity in the workplace
Are empathetic and eager to work collaboratively with your team
Have 3+ years of experience as data scientist designing, running and evaluating experiments
Are proficient in data wrangling using SQL and big data frameworks
Have 3+ years of programming experience with Python or R and relevant statistical packages
Have a relevant degree (e.g. Math, Statistics, Computer Science, Engineering) or equivalent industry experience
Ability to communicate quantitative data insights efficiently and articulate how they will impact user experience
Have good understanding of statistics, data science and machine learning disciplines
Are comfortable with working in agile environments
Desirable but not required skills:
Experience in Apache Spark
Knowledge about cloud infrastructure Azure or AWS
Commercial experience in product analytics or growth analytics
Proficiency in data visualisation tools and frameworks
Experience in NLP
MSc or PhD in quantitative fields
Knowledge of major AI/deep learning frameworks Tensorflow/Pytorch
Responsibilities
The Data Science team within Visual Studio brings the unique IQ of understanding data through statistical techniques and building systems using cutting-edge machine learning algorithms at scale. The scientists closely work with business to design and develop novel AI solutions. They also work toward gathering deep insights and help in making data-driven business decisions.
Qualifications
Basic Qualifications:
Undergraduate degree in Computer Science, Engineering, Mathematics, Statistics
2+ years development skills in Python, C#, C++ or Java.
Preferred Qualifications:
Masters or PhD degree in Computer Science, Statistics, or related fields (undergraduates with significant appropriate experience will be considered).
Strong academic work and professional experience in statistics, machine learning, including deep learning, NLP, econometrics.
Experience in building cloud-scale systems and experience working with open source stacks for data processing and data science is desirable.
Excellent communication skills, ability to present and write reports, strong teamwork and collaboration skills.
三年的目标是Data Analyst/Scientist见上图, 年底的目标是:
1.职业与学习:On-prem&cloud DB\DW进一步enhancment (admin和BI两方面, admin是为了日常的运维需求);统计建模,A / B 测试,机器学习,数据清洗;
2.技能:英文水平再有提升;
3.运动:一次性50个俯卧撑+体脂保持在18.5%,肌肉量从35kg增长到37kg;
4.音乐:每个月可以录首歌,钢琴完成K457奏鸣曲,吉他完成陈亮《无题》
Task:
-1- 职业与学习 -1-
Azure DP-100,DP-200的认证;
BP domain要求的MIP,以及DI domain的SQL/cloud DB MIP;
完成AI-Edu;
选择并完成额外培训;
-2- 技能 -2-
Word Power Made Easy和小绿书做完;
完成头马Pathway, 拿到DTM;
-3- 运动 -3-
运动法则遵循Two days rule;
保持每天50俯卧撑;
-4- 音乐 -4-
每天有30min的练习时间;
完成Yousician;
1 note
·
View note
Text
9,000+ Devops Engineer jobs in India (111 new)
9,000+ Devops Engineer jobs in India (111 new)
Source : LinkedIn Job Category : Devops / Cloud EngineerJobs Job Role : Full Time Salary : As per industry Qualification : Any Graduate Required Skills : Knowledge and experience on .Net, Sql Server, Python, Robot Framework, Selenium library, React JS, Postgre SQL, SQL Azure, Citrix Web framework, PA Framework library, Backbone JS, Bootstrap and HTML, SharePoint 2016 on prem, Nintex Forms and…
View On WordPress
0 notes
Text
How are organizations winning with Snowflake?
Cloud has evolved pretty considerably throughout the last decade, giving confidence to organizations still hoping on legacy systems for their analytical ventures. There's an excess of choices for organizations enthusiastic about their immediate or specific data management requirements.
This blog addresses anyone or any organization looking for data warehousing options that are accessible in the cloud then here you are, its Snowflake - a cloud data platform, and how it nicely fits if you are thinking of migrating to a new cloud data warehouse.
The cloud data warehouse market is a very challenging space but is also characterized by the specialized offerings of different players. Azure, AWS Redshift, SQL data warehouse, Google BigQuery are ample alternatives that are available in a rapidly advanced data warehousing market, which estimates its value over 18 billion USD.
To help get you there, let's look at some of the key ways to establish a sustainable and adaptive enterprise data warehouse with Snowflake solutions.
#1 Rebuilding
Numerous customers are moving from on-prem to cloud to ask, "Can I leverage my present infrastructure standards and best practices, such as user management and database , DevOps and security?" This brings up a valid concern about building policies from scratch, but it's essential to adapt to new technological advancements and new business opportunities. And that may, in fact, require some rebuilding. If you took an engine from a 1985 Ford and installed it in a 2019 Ferrari, would you expect the same performance?
It's essential to make choices not because "that's how we've always done it," but because those choices will assist you adopt new technology, empower, and gain agility to business processes and applications. Major areas to review involve- policies, user management, sandbox setups, data loading practices, ETL frameworks, tools, and codebase.
#2 Right Data Modelling
Snowflake serves manifold purposes: data mart, data lake, data warehouse, database and ODS. It even supports numerous modeling techniques like - Snowflake, Star, BEAM and Data Vault.
Snowflake can also support "schema on write'' and "schema on read"." This sometimes curates glitches on how to position Snowflake properly.
The solution helps to let your usage patterns predict your data model in an easy way. Think about how you foresee your business applications and data consumers leveraging data assets in Snowflake. This will assist you clarify your organization and resources to get the best result from Snowflake.
Here's an example. In complex use cases, it's usually a good practice to develop composite solutions involving:
Layer1 as Data Lake to ingest all the raw structured and semi-structured data.
Layer2 as ODS to store staged and validated data.
Layer3 as Data Warehouse for storing cleansed, categorized, normalized and transformed data.
Layer4 as Data Mart to deliver targeted data assets to end consumers and applications.
#3 Ingestion and integration
Snowflake adapts seamlessly with various data integration patterns, including batch (e.g., fixed schedule), near real-time (e.g., event-based) and real-time (e.g., streaming). To know the best pattern, collate your data loading use cases. Organizations willing to collate all the patterns—where data is recieved on a fixed basis goes via a static batch process, and easily delivered data uses dynamic patterns. Assess your data sourcing needs and delivery SLAs to track them to a proper ingestion pattern.
Also, account for your coming use cases. For instance: "data X" is received by 11am daily, so it's good to schedule a batch workflow running at 11am, right? But what if instead it is ingested by an event-based workflow—won't this deliver data faster, improve your SLA, convert static dependency and avoid efforts when delays happen to an automated mechanism? Try to think as much as you can through different scenarios.
Once integration patterns are known, ETL tooling comes next. Snowflake supports many integration partners and tools such as Informatica, Talend, Matillion, Polestar solutions, Snaplogic, and more. Many of them have also formed a native connector with Snowflake. And also, Snowflake supports no-tool integration using open source languages such as Python.
To choose the prompt integration platform, calculate these tools against your processing requirements, data volume, and usage. Also, examine if it could process in memory and perform SQL push down (leveraging Snowflake warehouse for processing). Push down technique is excellent help on Big Data use cases, as it eliminates the bottleneck with the tool's memory.
#4 Managing Snowflake
Here are a few things to know after Snowflake is up and running: Security practices. Establish strong security practices for your organization—leverage Snowflake role-based access control (RBAC) over Discretionary Access Control (DAC). Snowflake also supports SSO and federated authentication, merging with third-party services such as Active Directory and Oakta.
Access management. Identify user groups, privileges, and needed roles to define a hierarchical structure for your applications and users.
Resource monitors. Snowflake offers infinitely compute and scalable storage. The tradeoff is that organizations must establish monitoring and control protocols to keep your operating budget under control. The two primary comes here is:
Snowflake Cloud Data Warehouse configuration. It's typically best to curate different Snowflake Warehouses for each user, business area, group, or application. This assists to manage billing and chargeback when required. To further govern, assign roles specific to Warehouse actions (monitor, access/ update / create) so that only designed users can alter or develop the warehouse.
Billing alerts assist with monitoring and making the right actions at the right time. Define Resource Monitors to assist monitor your cost and avoid billing overage. You can customize these alerts and activities based on disparate threshold scenarios. Actions range from suspending a warehouse to simple email warnings.
Final Thoughts
If you have an IoT solutions database or a diverse data ecosystem, you will need a cloud-based data warehouse that gives scalability, ease of use, and infinite expansion. And you will require a data integration solution that is optimized for cloud operation. Using Stitch to extract and load data makes migration simple, and users can run transformations on data stored within Snowflake.
As a Snowflake Partner, we help organizations assess their data management requirements & quantify their storage needs. If you have an on-premise DW, our data & cloud experts help you migrate without any downtime or loss of data or logic. Further, our snowflake solutions enables data analysis & visualization for quick decision-making to maximize the returns on your investment.
0 notes
Text
Innovations in Data Orchestration: How Azure Data Factory is Adapting
Introduction
As businesses generate and process vast amounts of data, the need for efficient data orchestration has never been greater. Data orchestration involves automating, scheduling, and managing data workflows across multiple sources, including on-premises, cloud, and third-party services.
Azure Data Factory (ADF) has been a leader in ETL (Extract, Transform, Load) and data movement, and it continues to evolve with new innovations to enhance scalability, automation, security, and AI-driven optimizations.
In this blog, we will explore how Azure Data Factory is adapting to modern data orchestration challenges and the latest features that make it more powerful than ever.
1. The Evolution of Data Orchestration
🚀 Traditional Challenges
Manual data integration between multiple sources
Scalability issues in handling large data volumes
Latency in data movement for real-time analytics
Security concerns in hybrid and multi-cloud setups
🔥 The New Age of Orchestration
With advancements in cloud computing, AI, and automation, modern data orchestration solutions like ADF now provide: ✅ Serverless architecture for scalability ✅ AI-powered optimizations for faster data pipelines ✅ Real-time and event-driven data processing ✅ Hybrid and multi-cloud connectivity
2. Key Innovations in Azure Data Factory
✅ 1. Metadata-Driven Pipelines for Dynamic Workflows
ADF now supports metadata-driven data pipelines, allowing organizations to:
Automate data pipeline execution based on dynamic configurations
Reduce redundancy by using parameterized pipelines
Improve reusability and maintenance of workflows
✅ 2. AI-Powered Performance Optimization
Microsoft has introduced AI-powered recommendations in ADF to:
Suggest best data pipeline configurations
Automatically optimize execution performance
Detect bottlenecks and improve parallelism
✅ 3. Low-Code and No-Code Data Transformations
Mapping Data Flows provide a visual drag-and-drop interface
Wrangling Data Flows allow users to clean data using Power Query
Built-in connectors eliminate the need for custom scripting
✅ 4. Real-Time & Event-Driven Processing
ADF now integrates with Event Grid, Azure Functions, and Streaming Analytics, enabling:
Real-time data movement from IoT devices and logs
Trigger-based workflows for automated data processing
Streaming data ingestion into Azure Synapse, Data Lake, or Cosmos DB
✅ 5. Hybrid and Multi-Cloud Data Integration
ADF now provides:
Expanded connector support (AWS S3, Google BigQuery, SAP, Databricks)
Enhanced Self-Hosted Integration Runtime for secure on-prem connectivity
Cross-cloud data movement with Azure, AWS, and Google Cloud
✅ 6. Enhanced Security & Compliance Features
Private Link support for secure data transfers
Azure Key Vault integration for credential management
Role-based access control (RBAC) for governance
✅ 7. Auto-Scaling & Cost Optimization Features
Auto-scaling compute resources based on workload
Cost analysis tools for optimizing pipeline execution
Pay-per-use model to reduce costs for infrequent workloads
3. Use Cases of Azure Data Factory in Modern Data Orchestration
🔹 1. Real-Time Analytics with Azure Synapse
Ingesting IoT and log data into Azure Synapse
Using event-based triggers for automated pipeline execution
🔹 2. Automating Data Pipelines for AI & ML
Integrating ADF with Azure Machine Learning
Scheduling ML model retraining with fresh data
🔹 3. Data Governance & Compliance in Financial Services
Secure movement of sensitive data with encryption
Using ADF with Azure Purview for data lineage tracking
🔹 4. Hybrid Cloud Data Synchronization
Moving data from on-prem SAP, SQL Server, and Oracle to Azure Data Lake
Synchronizing multi-cloud data between AWS S3 and Azure Blob Storage
4. Best Practices for Using Azure Data Factory in Data Orchestration
✅ Leverage Metadata-Driven Pipelines for dynamic execution ✅ Enable Auto-Scaling for better cost and performance efficiency ✅ Use Event-Driven Processing for real-time workflows ✅ Monitor & Optimize Pipelines using Azure Monitor & Log Analytics ✅ Secure Data Transfers with Private Endpoints & Key Vault
5. Conclusion
Azure Data Factory continues to evolve with innovations in AI, automation, real-time processing, and hybrid cloud support. By adopting these modern orchestration capabilities, businesses can:
Reduce manual efforts in data integration
Improve data pipeline performance and reliability
Enable real-time insights and decision-making
As data volumes grow and cloud adoption increases, Azure Data Factory’s future-ready approach ensures that enterprises stay ahead in the data-driven world.
WEBSITE: https://www.ficusoft.in/azure-data-factory-training-in-chennai/
0 notes
Text
A Brief Overview of Migrating Your On-Prem SSRS to Azure Power BI
Ever thought about moving your SQL Server Reporting Services (SSRS) from the comfort of its on-premise setup to the cloud? With Azure and Power BI waving from the horizon, it’s a journey worth considering. This leap not only catapults your business intelligence (BI) tools into the future but also taps into Azure’s scalability and Power BI’s slick analytics. But let’s not sugarcoat it; this…
View On WordPress
#Azure SQL Database#Cloud BI transformation#Power BI integration#Power BI report optimization#SSRS to Azure migration
0 notes
Text
Azure-Data-Engineer-
+ Azure Data Engineer Location: Dallas - TX Skill Description Azure SQL DB Unix Python ADLS Databricks Familiar with unix and python scripting Azure SQL DB (SQLserver lift and shift or SQLDB lift and shift) and snowflake experience. (no modelling). 2. SQLserver on prem to SQL equivalent on Azure migration expertise 3. SQLDB to ADLS migration expertise 4. Should have good Azure technical skills 5. Should have good experience in Azure Data lake SQL DB SQL queries Databricks 6. Knowledge in Azure data factory 8. Should be having good communication 9. Experience in handling client requirement gathering & understanding 10. Good experience in coordinating with... source https://jobportals.website/jobdetail.html?id=513-Azure-Data-Engineer-
0 notes
Text
DevOps Engineer
Source : LinkedIn Job Category : Devops / Cloud EngineerJobs Job Role : Full Time Salary : As per industry Qualification : Any Graduate Required Skills : Knowledge and experience on .Net, Sql Server, Python, Robot Framework, Selenium library, React JS, Postgre SQL, SQL Azure, Citrix Web framework, PA Framework library, Backbone JS, Bootstrap and HTML, SharePoint 2016 on prem, Nintex Forms and…
View On WordPress
0 notes
Text
Exploring the Role of Azure Data Factory in Hybrid Cloud Data Integration

Introduction
In today’s digital landscape, organizations increasingly rely on hybrid cloud environments to manage their data. A hybrid cloud setup combines on-premises data sources, private clouds, and public cloud platforms like Azure, AWS, or Google Cloud. Managing and integrating data across these diverse environments can be complex.
This is where Azure Data Factory (ADF) plays a crucial role. ADF is a cloud-based data integration service that enables seamless movement, transformation, and orchestration of data across hybrid cloud environments.
In this blog, we’ll explore how Azure Data Factory simplifies hybrid cloud data integration, key use cases, and best practices for implementation.
1. What is Hybrid Cloud Data Integration?
Hybrid cloud data integration is the process of connecting, transforming, and synchronizing data between: ✅ On-premises data sources (e.g., SQL Server, Oracle, SAP) ✅ Cloud storage (e.g., Azure Blob Storage, Amazon S3) ✅ Databases and data warehouses (e.g., Azure SQL Database, Snowflake, BigQuery) ✅ Software-as-a-Service (SaaS) applications (e.g., Salesforce, Dynamics 365)
The goal is to create a unified data pipeline that enables real-time analytics, reporting, and AI-driven insights while ensuring data security and compliance.
2. Why Use Azure Data Factory for Hybrid Cloud Integration?
Azure Data Factory (ADF) provides a scalable, serverless solution for integrating data across hybrid environments. Some key benefits include:
✅ 1. Seamless Hybrid Connectivity
ADF supports over 90+ data connectors, including on-prem, cloud, and SaaS sources.
It enables secure data movement using Self-Hosted Integration Runtime to access on-premises data sources.
✅ 2. ETL & ELT Capabilities
ADF allows you to design Extract, Transform, and Load (ETL) or Extract, Load, and Transform (ELT) pipelines.
Supports Azure Data Lake, Synapse Analytics, and Power BI for analytics.
✅ 3. Scalability & Performance
Being serverless, ADF automatically scales resources based on data workload.
It supports parallel data processing for better performance.
✅ 4. Low-Code & Code-Based Options
ADF provides a visual pipeline designer for easy drag-and-drop development.
It also supports custom transformations using Azure Functions, Databricks, and SQL scripts.
✅ 5. Security & Compliance
Uses Azure Key Vault for secure credential management.
Supports private endpoints, network security, and role-based access control (RBAC).
Complies with GDPR, HIPAA, and ISO security standards.
3. Key Components of Azure Data Factory for Hybrid Cloud Integration
1️⃣ Linked Services
Acts as a connection between ADF and data sources (e.g., SQL Server, Blob Storage, SFTP).
2️⃣ Integration Runtimes (IR)
Azure-Hosted IR: For cloud data movement.
Self-Hosted IR: For on-premises to cloud integration.
SSIS-IR: To run SQL Server Integration Services (SSIS) packages in ADF.
3️⃣ Data Flows
Mapping Data Flow: No-code transformation engine.
Wrangling Data Flow: Excel-like Power Query transformation.
4️⃣ Pipelines
Orchestrate complex workflows using different activities like copy, transformation, and execution.
5️⃣ Triggers
Automate pipeline execution using schedule-based, event-based, or tumbling window triggers.
4. Common Use Cases of Azure Data Factory in Hybrid Cloud
🔹 1. Migrating On-Premises Data to Azure
Extracts data from SQL Server, Oracle, SAP, and moves it to Azure SQL, Synapse Analytics.
🔹 2. Real-Time Data Synchronization
Syncs on-prem ERP, CRM, or legacy databases with cloud applications.
🔹 3. ETL for Cloud Data Warehousing
Moves structured and unstructured data to Azure Synapse, Snowflake for analytics.
🔹 4. IoT and Big Data Integration
Collects IoT sensor data, processes it in Azure Data Lake, and visualizes it in Power BI.
🔹 5. Multi-Cloud Data Movement
Transfers data between AWS S3, Google BigQuery, and Azure Blob Storage.
5. Best Practices for Hybrid Cloud Integration Using ADF
✅ Use Self-Hosted IR for Secure On-Premises Data Access ✅ Optimize Pipeline Performance using partitioning and parallel execution ✅ Monitor Pipelines using Azure Monitor and Log Analytics ✅ Secure Data Transfers with Private Endpoints & Key Vault ✅ Automate Data Workflows with Triggers & Parameterized Pipelines
6. Conclusion
Azure Data Factory plays a critical role in hybrid cloud data integration by providing secure, scalable, and automated data pipelines. Whether you are migrating on-premises data, synchronizing real-time data, or integrating multi-cloud environments, ADF simplifies complex ETL processes with low-code and serverless capabilities.
By leveraging ADF’s integration runtimes, automation, and security features, organizations can build a resilient, high-performance hybrid cloud data ecosystem.
WEBSITE: https://www.ficusoft.in/azure-data-factory-training-in-chennai/
0 notes
Text
8,000+ Salesforce Developer jobs in India (425 new)
8,000+ Salesforce Developer jobs in India (425 new)
Source : LinkedIn Job Category : Devops / Cloud EngineerJobs Job Role : Full Time Salary : As per industry Qualification : Any Graduate Required Skills : Knowledge and experience on .Net, Sql Server, Python, Robot Framework, Selenium library, React JS, Postgre SQL, SQL Azure, Citrix Web framework, PA Framework library, Backbone JS, Bootstrap and HTML, SharePoint 2016 on prem, Nintex Forms and…
View On WordPress
0 notes