#sql table editor
Explore tagged Tumblr posts
Visit Tumblr Blog
Explore Tumblr blogs with no restrictions, modern design and the best experience.
Last Seen Tumblr Blogs


Fun Fact
The average Tumblr user visits about 67 pages every month.
Video
youtube
SQL Server Table Editor / Management Tool | Visual Studio
#youtube#visual studio automation#visual studio sql editor#sql table editor#edit sql tables in bulk#enter sql data in bulk
0 notes
Text
the times tables
#have i talked about the time i cheated on my times tables. ok so in 3rd we had a series of times tables tests starting from 0 going to 12#and however many you passed determined what you got for the ice cream party. 0s was ice cream 1s was choccy sauce etc#but the tests were timed so you actually had to know the answers you couldnt just sit there calculating for each answer#so anyway yeah the temptation of a tangible reward and the recognition of my peers got to me and i used a cheat sheet for some of them#idk if it was even worth it... some of the tiers were like chopped nuts or bananas or cherries and i wouldnt have wanted those anyway#well my cheating days are behind me. except for when during my job interview i looked up sql syntax on my phone bc i forgor#like the reason you write that stuff in an editor is so it can tell you when the syntax is wrong. but other than that yeah
0 notes
Text
Backend update
Had the most horrible time working with Sequelize today! As I usually do whenever I work with Sequelize! Sequelize is an SQL ORM - instead of writing raw SQL, ORM gives you an option to code it in a way that looks much more like an OOP, which is arguably simpler if you are used to programming that way. So to explain my project a little bit, it's a full stack web app - an online photo editor for dragging and dropping stickers onto canvas/picture. Here is the diagram.
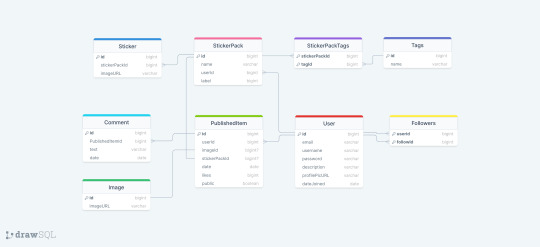
I'm doing it with Next which I've never used before, I only did vanilla js, React and a lil bit of Angular before. The architecture of a next project immediately messed me up so much, it's way different from the ones I've used before and I often got lost in the folders and where to put stuff properly (this is a huge thing to me because I always want it to be organized by the industry standard and I had no reference Next projects from any previous jobs/college so it got really overwhelming really soon :/) . The next problem was setting up my MySQL database with Sequelize because I know from my past experience that Sequelize is very sensitive to where you position certain files/functions and in which order are they. I made all the models (Sequelize equivalent of tables) and when it was time to sync, it would sync only two models out of nine. I figured it was because the other ones weren't called anywhere. Btw a fun fact
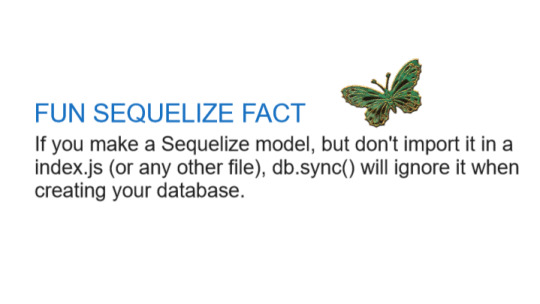
So I imported them to my index.js file I made in my database folder. It was reporting an db.define() is not a function error now. That was weird because it didn't report that for the first two tables that went through. To make a really long story short - because I was used to an server/client architecture, I didn't properly run the index.js file, but just did an "npm run dev" and was counting on all of the files to run in an order I am used to, that was not the case tho. After about an hour, I figured I just needed to run index.js solo first. The only reasons those first two tables went through in the beginning is because of the test api calls I made to them in a separate file :I I cannot wait to finish this project, it is for my bachelors thesis or whatever it's called...wish me luck to finish this by 1.9. XD
Also if you have any questions about any of the technologies I used here, feel free to message me c: <3 Bye!
#codeblr#code#programming#webdevelopment#mysql#nextjs#sequelize#full stack web development#fullstackdeveloper#student#computer science#women in stem#backend#studyblr
15 notes
·
View notes
Text
https://www.oktoolbox.com
LED Scrolling Text Led subtitle scrolling tool, suitable for playing work content, text reminders, advertising slogans, etc. on computers or mobile phones
XML Formatter The XML formatter can beautify the compressed XML code or compress the XML code
Timestamp Converter The tool can convert timestamps into date and time, and can also convert date and time into timestamps
QR Code Generator The tool can generate QR code pictures from web addresses or text, and can set the format, fault tolerance, size, color and logo of QR codes
Text Encryption and Decryption Online text encryption and decryption tools, support AES, DES, RC4, rabbit, tripledes
URL Encode and Decode You can convert a normal URL to an encoded URL or an encoded URL to a normal URL
Image Color Recognition Free online image color recognition tool, which can extract the main color of the image
Flow Chart Online flow chart tool, with built-in multiple graphics such as rectangle, circle, line, arrow and flow chart, supports exporting SVG/PNG/JPG.
Color Picker The color code, hex and RGB values can be obtained through the color selector, color table and color name
Character Counter This tool can quickly calculate the number of words, letters, numbers, punctuation and Chinese characters in the article
Morse Code Morse code encoding and decoding tools help you encode text into Morse code and decode Morse code into text
UTF-8 Encode and Decode You can convert text to UTF-8 or UTF-8 to text
Decimal Converter The online binary converter provides binary, octal, decimal, hexadecimal and other mutual conversion functions
GIF Generator You can make GIF pictures online and combine multiple static pictures into one dynamic picture
JSON Formatter The JSON formatter can beautify the compressed JSON code or compress the JSON code
Cartoon Avatar Maker Free cartoon avatar online production tool, you can freely choose the facial expression, facial features and clothing of the characters
Htpasswd Generator Generate Apache HTTP basic authentication password file online
Letter Case Converter The tool can convert uppercase letters to lowercase letters, and also convert lowercase letters to uppercase letters
SQL Formatter SQL formatter can beautify the compressed SQL code or compress the SQL code
Markdown Editor You can write markdown code and preview it in real time in the browser
Regular Expression Online regular expression testing tools can help you quickly test whether the regular expressions you write are correct
CSS Formatter CSS formatter can beautify compressed CSS code and compress CSS code
Text Deduplication This tool can automatically remove duplicate content lines in articles or text
ASCII Encode and Decode It can convert the local characters in the code into Unicode and solve the problem of garbled code encountered in programming
Port Scanner Scan common or specified ports to see if they are open
Text Compare The two texts can be compared online to detect the difference between the two texts
Image Format Converter Can modify the image format, support JPG, PNG, BMP, JPEG, GIF, SVG, webp, ICO formats
Date Calculator You can calculate the number of days between dates, and calculate the number of days from today to a certain day in the past or the future
Unicode Encode and Decode You can convert text to unicode or Unicode to text
ICO Converter You can crop pictures online and convert them into favicon.ico files
Image Character Recognition The characters in the image can be recognized online
Base64 Encode and Decode Base64 encoding and decoding tools help you encode text into Base64 and decode Base64 into text
Face Recognition It can automatically recognize the faces in the photos and cut out the head pictures in batches
Image to Base64 You can convert pictures to Base64 or Base64 to pictures
Photo Background Color You can modify the background color and size of photos online
Random Password Generator You can randomly generate a password containing numbers, uppercase letters, lowercase letters and symbols
Photo to Sketch A tool for automatically generating hand drawn style photos, which can set the blur level of hand drawn pictures
Random Number Generator One number can be generated randomly, or multiple random numbers can be generated in batch at a time
Calculator Mathematical calculation of addition, subtraction, multiplication, division, root square, PI, reciprocal, sine and cosine
Text Flow Chart A tool for drawing flow chart using ASCII code
XML to JSON The tool can convert XML to JSON or JSON to XML
Table Data Conversion A tool that can convert table data into JSON format
Mind Map You can make mind map, directory organization chart, fishbone chart, logical structure chart, organization chart online
MD5 Encryption It can convert text into MD5 and generate 32-bit and 16-bit MD5 ciphertext
Gantt Chart You can use this tool to draw Gantt Chart, which is convenient for project management and schedule management
Image compressor It can help you compress PNG/JPEG images online
Image to PDF You can combine multiple pictures of unlimited format and size into a complete PDF document
Image Watermarking The image watermarking tool can customize the text, font size, font color, transparency and text spacing
2 notes
·
View notes
Text
How to Drop Tables in MySQL Using dbForge Studio: A Simple Guide for Safer Table Management
Learn how to drop a table in MySQL quickly and safely using dbForge Studio for MySQL — a professional-grade IDE designed for MySQL and MariaDB development. Whether you’re looking to delete a table, use DROP TABLE IF EXISTS, or completely clear a MySQL table, this guide has you covered.
In article “How to Drop Tables in MySQL: A Complete Guide for Database Developers” we explain:
✅ How to drop single and multiple tables Use simple SQL commands or the intuitive UI in dbForge Studio to delete one or several tables at once — no need to write multiple queries manually.
✅ How to use the DROP TABLE command properly Learn how to avoid errors by using DROP TABLE IF EXISTS and specifying table names correctly, especially when working with multiple schemas.
✅ What happens when you drop a table in MySQL Understand the consequences: the table structure and all its data are permanently removed — and can’t be recovered unless you’ve backed up beforehand.
✅ Best practices for safe table deletion Backup first, check for dependencies like foreign keys, and use IF EXISTS to avoid runtime errors if the table doesn’t exist.
✅ How dbForge Studio simplifies and automates this process With dbForge Studio, dropping tables becomes a controlled and transparent process, thanks to:
- Visual Database Explorer — right-click any table to drop it instantly or review its structure before deletion. - Smart SQL Editor — get syntax suggestions and validation as you type DROP TABLE commands. - Built-in SQL execution preview — see what will happen before executing destructive commands. - Schema and data backup tools — create instant backups before making changes. - SQL script generation — the tool auto-generates DROP TABLE scripts, which you can edit and save for future use. - Role-based permissions and warnings — helps prevent accidental deletions in shared environments.
💡 Whether you’re cleaning up your database or optimizing its structure, this article helps you do it efficiently — with fewer risks and more control.
🔽 Try dbForge Studio for MySQL for free and experience smarter MySQL development today: 👉 https://www.devart.com/dbforge/mysql/studio/download.html
1 note
·
View note
Text
How to Create Interactive Reports in Power BI
In today's data-driven world, businesses need powerful tools to visualize, analyze, and share insights effectively. Microsoft Power BI is one such tool that enables users to create interactive, real-time reports and dashboards with ease. Whether you're a business analyst, student, or aspiring data professional, learning to build interactive reports in Power BI is a key skill that adds tremendous value.
If you're looking for Power BI training in KPHB, this article will guide you through the fundamentals of creating engaging, user-friendly reports in Power BI.

What is an Interactive Report in Power BI?
An interactive report in Power BI allows users to:
Filter and slice data with visual controls
Drill down into data for deeper insights
Use tooltips and visuals for storytelling
Explore data dynamically without editing the report
Interactivity transforms static charts into powerful data exploration tools.
Step-by-Step: Creating Interactive Reports in Power BI
1. Connect to Your Data
Power BI supports multiple data sources—Excel, SQL Server, SharePoint, and many more.
Open Power BI Desktop
Click on “Get Data” and select your data source
Load the data into your report
2. Clean and Prepare Your Data
Use Power Query Editor to:
Remove unwanted columns
Fix formatting issues
Create calculated columns or measures
Clean data ensures accurate and reliable reporting.
3. Add Visualizations
Drag and drop fields onto the canvas to create visuals like:
Bar and column charts
Pie charts
Maps
Tables
Cards and KPIs
4. Enable Interactivity
You can make your report interactive by:
Adding Slicers (e.g., date range, region, category)
Enabling Drillthrough pages for detailed views
Using Bookmarks and Buttons for navigation
Setting up Tooltips to show extra details on hover
These features allow users to explore data without altering the actual dataset.
5. Use Filters and Sync Slicers
Apply visual-level, page-level, or report-level filters to control what data appears. Sync slicers across pages to maintain consistency in filtering.
6. Publish and Share
Save and publish your report to the Power BI Service
Set up permissions and share with your team or clients
Schedule data refreshes for real-time updates
Tips for Designing User-Friendly Reports
Keep visuals simple and clear
Use consistent colors and fonts
Highlight key metrics using cards or KPIs
Group related visuals together
Use white space effectively for readability
Who Should Learn Power BI?
Power BI is essential for:
Business Analysts
Data Analysts
Project Managers
Marketing Professionals
Students aspiring to enter the data field
If you're in KPHB or nearby, enrolling in a Power BI training in KPHB can give you hands-on experience and help you master these concepts faster.
Frequently Asked Questions
Q1. Do I need coding skills to use Power BI? No! Power BI is designed with a drag-and-drop interface. Basic knowledge of DAX (Data Analysis Expressions) can be helpful but is not required for beginners.
Q2. Can I use Power BI for real-time dashboards? Yes. With the right data connection and refresh settings, you can build real-time dashboards.
Q3. Is Power BI free? Power BI Desktop is free. Power BI Pro and Premium offer additional sharing and collaboration features at a cost.
➡️ For more FAQs, visit our website.
Ready to Learn More?
If you're serious about mastering Power BI and want expert guidance, consider joining a Power BI training in KPHB. It’s a great way to build your skills and get certified under professional mentorship.
#PowerBI#DataAnalytics#BusinessIntelligence#PowerBItraining#KPHB#InteractiveReports#DataVisualization
0 notes
Text
youtube
Databricks: what’s new in May 2025? Updates & Features Explained! #databricks Databricks, What’s New in Databricks? May 2025 Updates & Features Explained! In May 2025, Databricks added several key features. 📌 Key Highlights for This Month: - *0:16* 16.4 LTS - *0:28* Autoloader auto cleaner - *2:28* Lakeflow UI connectors - *3:01* Workflow run with different settings - *4:27* ETL/DLT editor - *5:30* PRIVATE materialised views and streaming tables - *6:48* Delta share materialised views and streaming tables - *7:27* Clean rooms up to 10 collaborators - *7:57* Predictive optimisation for all - *8:45* Just-in-time user provisioning - *10:04* Cluster logs - *11:13* Run the code inside the assistant - *13:22* Query snippets - *14:34* New charts - *15:43* Run apps locally - *16:51* Custom data sources - *18:01* Syntax highlighter - *19:25* String aggregation ============================= 📚 *Notebooks from the video:* 🔗 [GitHub Repository](https://ift.tt/aJpTNju) 🔔𝐃𝐨𝐧'𝐭 𝐟𝐨𝐫𝐠𝐞𝐭 𝐭𝐨 𝐬𝐮𝐛𝐬𝐜𝐫𝐢𝐛𝐞 𝐭𝐨 𝐦𝐲 𝐜𝐡𝐚𝐧𝐧𝐞𝐥 𝐟𝐨𝐫 𝐦𝐨𝐫𝐞 𝐮𝐩𝐝𝐚𝐭𝐞𝐬. https://www.youtube.com/@databricks_hubert_dudek/?sub_confirmation=1 🔗 Support Me Here! ☕Buy me a coffee: https://ift.tt/nlEDgNR ✨ Explore Databricks AI insights and workflows—read more: https://ift.tt/hUeGRFE ============================= 🎬Suggested videos for you: ▶️ [What’s new in January 2025](https://www.youtube.com/watch?v=JJiwSplZmfk) ▶️ [What’s new in February 2025](https://www.youtube.com/watch?v=tuKI0sBNbmg) ▶️ [What’s new in March 2025](https://youtu.be/hJD7KoNq-uE) ▶️ [What’s new in April 2025](https://youtu.be/FDgtNVeLTc8) ============================= 📚 **New Articles for Further Reading:** - 📝 *Clean Landing Zone — autoloader cleanSource:* 🔗 [Read the full article](https://ift.tt/gS2h1s3) - 📝 *Nested groups in databricks:* 🔗 [Read the full article](https://ift.tt/TileUHn) - 📝 *Cost Benchmark: 2 billion records from bronze to silver on serverless:* 🔗 [Read the full article](https://ift.tt/WUnICfR) - 📝 *Logs to Volumes and to Dataframe:* 🔗 [Read the full article](https://ift.tt/Reya0pJ) ============================= 🔎 Related Phrases: #databricks #bigdata #dataengineering #machinelearning #sql #cloudcomputing #dataanalytics #ai #azure #googlecloud #aws #etl #python #data #database #datawarehouse via databricks by Hubert Dudek https://www.youtube.com/channel/UCR99H9eib5MOHEhapg4kkaQ May 19, 2025 at 03:07AM
#databricks#dataengineering#machinelearning#sql#dataanalytics#ai#databrickstutorial#databrickssql#databricksai#Youtube
0 notes
Text
Text to SQL LLM: What is Text to SQL And Text to SQL Methods
SQL LLM text
How text-to-SQL approaches help AI write good SQL
SQL is vital for organisations to acquire quick and accurate data-driven insights for decision-making. Google uses Gemini to generate text-to-SQL from natural language. This feature lets non-technical individuals immediately access data and boosts developer and analyst productivity.
How is Text to SQL?
A feature dubbed “text-to-SQL” lets systems generate SQL queries from plain language. Its main purpose is to remove SQL code by allowing common language data access. This method maximises developer and analyst efficiency while letting non-technical people directly interact with data.
Technology underpins
Recent Text-to-SQL improvements have relied on robust large language models (LLMs) like Gemini for reasoning and information synthesis. The Gemini family of models produces high-quality SQL and code for Text-to-SQL solutions. Based on the need, several model versions or custom fine-tuning may be utilised to ensure good SQL production, especially for certain dialects.
Google Cloud availability
Current Google Cloud products support text-to-SQL:
BigQuery Studio: available via Data Canvas SQL node, SQL Editor, and SQL Generation.
Cloud SQL Studio has “Help me code” for Postgres, MySQL, and SQLServer.
AlloyDB Studio and Cloud Spanner Studio have “Help me code” tools.
AlloyDB AI: This public trial tool connects to the database using natural language.
Vertex AI provides direct access to Gemini models that support product features.
Text-to-SQL Challenges
Text-to-SQL struggles with real-world databases and user queries, even though the most advanced LLMs, like Gemini 2.5, can reason and convert complex natural language queries into functional SQL (such as joins, filters, and aggregations). The model needs different methods to handle critical problems. These challenges include:
Provide Business-Specific Context:
Like human analysts, LLMs need a lot of “context” or experience to write appropriate SQL. Business case implications, semantic meaning, schema information, relevant columns, data samples—this context may be implicit or explicit. Specialist model training (fine-tuning) for every database form and alteration is rarely scalable or cost-effective. Training data rarely includes semantics and business knowledge, which is often poorly documented. An LLM won't know how a cat_id value in a table indicates a shoe without context.
User Intent Recognition
Natural language is less accurate than SQL. An LLM may offer an answer when the question is vague, causing hallucinations, but a human analyst can ask clarifying questions. The question “What are the best-selling shoes?” could mean the shoes are most popular by quantity or revenue, and it's unclear how many responses are needed. Non-technical users need accurate, correct responses, whereas technical users may benefit from an acceptable, nearly-perfect query. The system should guide the user, explain its decisions, and ask clarifying questions.
LLM Generation Limits:
Unconventional LLMs are good at writing and summarising, but they may struggle to follow instructions, especially for buried SQL features. SQL accuracy requires careful attention to specifications, which can be difficult. The many SQL dialect changes are difficult to manage. MySQL uses MONTH(timestamp_column), while BigQuery SQL uses EXTRACT(MONTH FROM timestamp_column).
Text-to-SQL Tips for Overcoming Challenges
Google Cloud is constantly upgrading its Text-to-SQL agents using various methods to improve quality and address the concerns identified. These methods include:
Contextual learning and intelligent retrieval: Provide data, business concepts, and schema. After indexing and retrieving relevant datasets, tables, and columns using vector search for semantic matching, user-provided schema annotations, SQL examples, business rule implementations, and current query samples are loaded. This data is delivered to the model as prompts using Gemini's long context windows.
Disambiguation LLMs: To determine user intent by asking the system clarifying questions. This usually involves planning LLM calls to see if a question can be addressed with the information available and, if not, to create follow-up questions to clarify purpose.
SQL-aware Foundation Models: Using powerful LLMs like the Gemini family with targeted fine-tuning to ensure great and dialect-specific SQL generation.
Verification and replenishment: LLM creation non-determinism. Non-AI methods like query parsing or dry runs of produced SQL are used to get a predicted indication if something crucial was missed. When provided examples and direction, models can typically remedy mistakes, thus this feedback is sent back for another effort.
Self-Reliability: Reducing generation round dependence and boosting reliability. After creating numerous queries for the same question (using different models or approaches), the best is chosen. Multiple models agreeing increases accuracy.
The semantic layer connects customers' daily language to complex data structures.
Query history and usage pattern analysis help understand user intent.
Entity resolution can determine user intent.
Model finetuning: Sometimes used to ensure models supply enough SQL for dialects.
Assess and quantify
Enhancing AI-driven capabilities requires robust evaluation. Although BIRD-bench and other academic benchmarks are useful, they may not adequately reflect workload and organisation. Google Cloud has developed synthetic benchmarks for a variety of SQL engines, products, dialects, and engine-specific features like DDL, DML, administrative requirements, and sophisticated queries/schemas. Evaluation uses offline and user metrics and automated and human methods like LLM-as-a-judge to deliver cost-effective performance understanding on ambiguous tasks. Continuous reviews allow teams to quickly test new models, prompting tactics, and other improvements.
#SQLLLM#TexttoSQLLLM#TexttoSQL#VertexAI#TexttoSQLMethods#ChallengesofTexttoSQL#technology#technews#news#technologynews#technologytrends#govindhtech
0 notes
Text
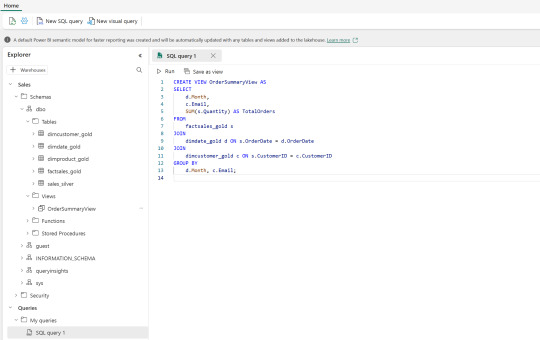
Query and transform data
Now that you know how to implement a data warehouse in Fabric, let’s prepare the data for analytics. There are two ways to query data from your data warehouse. The Visual query editor provides a no-code, drag-and-drop experience to create your queries. If you’re comfortable with T-SQL, you may prefer to use the SQL query editor to write your queries. In both cases, you can create tables, views,…
View On WordPress
0 notes
Text
What is the best way to begin learning Power BI, and how can a beginner smoothly progress to advanced skills?
Introduction to Power BI
Power BI is a revolutionary tool in the data analytics universe, famous for its capacity to transform raw data into engaging visual insights. From small startups to global multinationals, it is a vital resource for making informed decisions based on data.

Learning the Core Features of Power BI
At its essence, Power BI provides three fundamental features:
Data Visualization – Designing dynamic and interactive visuals.
Data Modelling – Organizing and structuring data for proper analysis.
DAX (Data Analysis Expressions) – Driving complex calculations and insights.
Setting Up for Success
Getting started starts with downloading and installing Power BI Desktop. Getting familiar with its interface, menus, and features is an essential step in your learning process.
Starting with the Basics
Beginners often start by importing data from Excel or SQL. Your initial focus should be on creating straightforward visuals, such as bar charts or line graphs, while learning to establish relationships between datasets.
Importance of Structured Learning Paths
A structured learning path, such as enrolling in a power BI certification course in washington, San Francisco, or New York, accelerates your progress. These courses provide a solid foundation and hands-on practice.
Working with Hands-On Projects
Hands-on projects are the optimal method to cement your knowledge. Begin with building a simple sales dashboard that monitors revenue patterns, providing you with instant real-world exposure.
Building Analytical Skills
Early on, work on describing data in tables and matrices. Seeing trends using bar charts or pie charts improves your capacity to clearly communicate data insights.
Moving on to Intermediate Skills
After becoming familiar with the fundamentals, it's time to go deeper. Understand how to work with calculated fields, measures, and Power Query Editor. Data model optimization will enhance report performance.
Learning Advanced Visualization Methods
Elevate your reports to the next level with personalize visuals. Add slicers to slice data or drill-through features for detailed analysis, making your dashboards more interactive.
Mastering Data Analysis Expressions (DAX)
DAX is the powerhouse behind Power BI’s analytics capabilities. Start with simple functions like SUM and AVERAGE, and gradually explore advanced calculations involving CALCULATE and FILTER.
Working with Power BI Service
Publishing your reports online via Power BI Service allows for easy sharing and collaboration. Learn to manage datasets, create workspaces, and collaborate effectively.
Collaborative Features in Power BI
Use shared workspaces for collaboration. Utilize version control to avoid conflicts and allow seamless collaboration.
Data Security and Governance
Data security is top-notch. Master setting roles, permissions management, and adherence to data governance policies to guarantee data integrity.
Power BI Integration with Other Tools
Maximize the power of Power BI by integrating it with Excel or linking it with cloud platforms such as Azure or Google Drive.
Preparing for Power BI Certification
Certification proves your proficiency. A power BI certification course in san francisco or any other city can assist you in excelling on exam content, ranging from data visualization to expert DAX.
Emphasizing the Top Courses for Power BI
Courses in Washington and New York city’s provide customized content to fit the demands of skilled professionals at all levels. Their complete curriculum helps students learn in-depth.
Keeping Current with Power BI Trends
Stay ahead by exploring updates, joining the Power BI community, and engaging with forums to share knowledge.
Common Challenges and How to Overcome Them
Troubleshooting is part of the process. Practice resolving common issues, such as data import errors or incorrect DAX outputs, to build resilience.
Building a Portfolio with Power BI
A well-rounded portfolio showcases your skills. Include projects that demonstrate your ability to solve real-world problems, enhancing your appeal to employers.
Conclusion and Next Steps
Your Power BI journey starts small but culminates in huge rewards. You may be learning on your own or doing a power BI certification course in new york, but whatever you choose, embrace the journey and feel the transformation as you develop into a Power BI master.
0 notes
Text
Mastering Power BI Dashboards
In today’s data-driven world, businesses rely heavily on insightful analysis to make informed decisions. Power BI, developed by Microsoft, has emerged as one of the leading business intelligence tools that help organizations convert raw data into interactive and visually compelling dashboards. Whether you are a business analyst, data professional, or a beginner exploring data visualization, mastering Power BI dashboards can significantly enhance your analytical capabilities.
Understanding Power BI Dashboards
A Power BI dashboard is a collection of visual elements, including charts, graphs, maps, and tables, designed to present a consolidated view of data. Unlike reports, which can be multiple pages long, dashboards are single-page, interactive snapshots that provide key insights at a glance. They pull data from multiple sources, ensuring that businesses can track key performance indicators (KPIs) and trends effectively.
Dashboards in Power BI are often used for:
Business Performance Monitoring: Tracking sales, revenue, and operational efficiency.
Customer Insights: Understanding purchasing behaviors and customer engagement.
Financial Analysis: Evaluating profit margins, expenses, and budget allocations.
Marketing Performance: Analyzing campaign success and return on investment.
Why Power BI Dashboards Are Essential
Power BI dashboards are widely used across industries due to their flexibility, scalability, and integration capabilities. Here are some key reasons why they have become indispensable:
1. Real-Time Data Analysis
Power BI dashboards can connect to live data sources, ensuring that users receive up-to-date insights in real-time. This capability is crucial for businesses that rely on dynamic data, such as e-commerce platforms or financial institutions.
2. User-Friendly Interface
With a drag-and-drop functionality, Power BI makes it easy to create stunning dashboards without requiring advanced coding skills. This democratizes data analysis, allowing even non-technical users to build meaningful visualizations.
3. Seamless Integration
Power BI integrates seamlessly with various Microsoft tools like Excel, Azure, and SQL Server, as well as third-party applications such as Google Analytics, Salesforce, and SAP. This ensures smooth data flow and analysis from multiple sources.
4. Customization and Interactive Features
Users can customize dashboards based on their specific requirements, apply filters, and use drill-down features to explore detailed insights. This level of interactivity makes dashboards more engaging and useful for decision-making.
5. Enhanced Collaboration
Power BI’s cloud-based service allows teams to share dashboards securely, enabling collaborative decision-making. Users can also access dashboards on mobile devices, ensuring data accessibility from anywhere.
How to Build an Effective Power BI Dashboard
Creating a well-structured Power BI dashboard requires a clear understanding of business objectives, data sources, and visualization techniques. Follow these steps to build an impactful dashboard:
Step 1: Define Your Objectives
Before designing a dashboard, determine what insights you need to extract. Are you tracking sales growth? Analyzing website traffic? Understanding customer demographics? Defining clear objectives ensures that your dashboard serves its intended purpose.
Step 2: Collect and Prepare Data
Gather data from relevant sources, such as databases, APIs, spreadsheets, or cloud services. Clean and transform the data to ensure accuracy, consistency, and usability. Power BI’s Power Query Editor helps in cleaning and shaping data efficiently.
Step 3: Choose the Right Visualizations
Select charts, graphs, and tables that best represent your data. Some commonly used visualizations in Power BI dashboards include:
Bar Charts: Best for comparing categorical data.
Line Charts: Ideal for tracking trends over time.
Pie Charts: Suitable for showing proportions.
Maps: Useful for geographical analysis.
KPI Indicators: Highlight performance metrics at a glance.
Step 4: Design an Intuitive Layout
A well-organized layout enhances readability and engagement. Place the most important insights at the top, use contrasting colors to highlight key metrics, and avoid cluttering the dashboard with unnecessary elements.
Step 5: Implement Filters and Slicers
Filters and slicers allow users to interact with the dashboard and customize the data displayed. This adds flexibility and makes the dashboard more user-centric.
Step 6: Test and Optimize
Before sharing the dashboard, test its functionality by exploring different scenarios. Optimize loading speed by minimizing unnecessary calculations and large datasets. Ensure that the dashboard is responsive across different devices.
Best Practices for Power BI Dashboards
To create high-impact Power BI dashboards, follow these best practices:
Keep It Simple: Avoid overcrowding the dashboard with too many visuals. Focus on key insights.
Use Consistent Colors and Themes: Maintain a uniform color scheme to enhance visual appeal.
Leverage Data Storytelling: Present data in a way that tells a compelling story, making it easier for users to interpret.
Ensure Data Accuracy: Regularly update data sources to maintain credibility.
Enable Performance Optimization: Optimize DAX calculations and data models to enhance dashboard efficiency.
Conclusion
Mastering Power BI dashboards is a valuable skill that can boost career opportunities in data analytics, business intelligence, and decision-making roles. With its user-friendly interface, real-time data capabilities, and seamless integration, Power BI has become the go-to tool for professionals across various industries. Whether you are a beginner or an experienced analyst, learning Power BI through the best course can enhance your ability to create powerful dashboards that drive business success. Start exploring Power BI today and unlock the potential of data visualization for informed decision-making.
0 notes
Text
How to Develop a Website Using PHP
How to Develop a Website Using PHP
In today's digital era, websites play a crucial role in business growth and online presence. One of the most widely used server-side scripting languages for web development is PHP (Hypertext Preprocessor). It is open-source, easy to learn, and widely supported by web servers and databases. This guide will walk you through the step-by-step process of developing a website using PHP.

Why Choose PHP for Web Development?
Before diving into the development process, let’s explore some key reasons why PHP is a great choice for website development:
1. Open-Source: PHP is free to use, making it cost-effective for developers.
2. Cross-Platform Compatibility: Runs on Windows, Linux, and macOS without compatibility issues.
3. Database Support: Easily integrates with MySQL, PostgreSQL, and other databases.
4. Scalability: Suitable for both small websites and large-scale web applications.
5. Large Community Support: Extensive documentation and active developer communities for troubleshooting and learning.
Prerequisites for PHP Web Development
To develop a website using PHP, you need the following tools:
1. Text Editor or IDE: VS Code, Sublime Text, or PHPStorm.
2. Local Server: XAMPP, WAMP, or MAMP for running PHP scripts.
3. Database System: MySQL or PostgreSQL for data storage.
4. Web Browser: Chrome, Firefox, or Edge for testing the website.
Step-by-Step Guide to Developing a Website Using PHP
1. Setting Up Your Development Environment
To begin developing a PHP website, follow these steps:
· Install XAMPP (or WAMP/MAMP) to create a local server.
· Using the XAMPP Control Panel, launch Apache and MySQL.
· Navigate to htdocs in the XAMPP directory to store PHP project files.
2. Creating the Project Structure
Organizing your files properly enhances maintainability. A typical PHP project structure:
project-folder/
│-- index.php
│-- config.php
│-- assets/
│ ├── css/
│ ├── js/
│ ├── images/
│-- includes/
│ ├── header.php
│ ├── footer.php
│-- pages/
│ ├── about.php
│ ├── contact.php
│-- database/
│ ├── db_connect.php
3. Writing Your First PHP Script
Create an index.php file and add the following code:
<?php
echo "Welcome to My PHP Website!";
?>
Save the file and access it in the browser by navigating to http://localhost/project-folder/.
4. Connecting PHP with MySQL Database
To manage dynamic content, connect PHP with a MySQL database.
Create a Database
1. Open phpMyAdmin from XAMPP.
2. Create a new database, e.g., my_website.
3. Add a users table with fields id, name, email, and password.
Database Connection Code (db_connect.php)
<?php
$servername = "localhost";
$username = "root";
$password = "";
dbname = "my_website";
$conn = new mysqli($servername, $username, $password, $dbname);
if ($conn->connect_error) {
die("Connection failed: " . $conn->connect_error);
}
?>
5. Creating a User Registration System
A simple user registration form using PHP and MySQL.
Registration Form (register.php)
<form method="POST" action="register.php">
<input type="text" name="name" placeholder="Full Name" required>
<input type="email" name="email" placeholder="Email" required>
<input type="password" name="password" placeholder="Password" required>
<button type="submit" name="register">Register</button>
</form>
Handling User Registration (register.php)
<?php
include 'database/db_connect.php';
if(isset($_POST['register'])) {
$name = $_POST['name'];
$email = $_POST['email'];
$password = password_hash($_POST['password'], PASSWORD_BCRYPT);
$sql = "INSERT INTO users (name, email, password) VALUES ('$name', '$email', '$password')";
if ($conn->query($sql) === TRUE) {
echo "Registration successful!";
} else {
echo "Error: " . $conn->error;
}
}
?>
6. Implementing User Login System
Login Form (login.php)
<form method="POST" action="login.php">
<input type="email" name="email" placeholder="Email" required>
<input type="password" name="password" placeholder="Password" required>
<button type="submit" name="login">Login</button>
</form>
Handling Login Authentication (login.php)
<?php
session_start();
include 'database/db_connect.php';
if(isset($_POST['login'])) {
$email = $_POST['email'];
$password = $_POST['password'];
$result = $conn->query("SELECT * FROM users WHERE email='$email'");
$user = $result->fetch_assoc();
if(password_verify($password, $user['password'])) {
$_SESSION['user'] = $user;
echo "Login successful!";
} else {
echo "Invalid credentials!";
}
}
?>

7. Adding Navigation and Styling
· Use Bootstrap or CSS frameworks to improve UI.
· Include a header.php and footer.php for better navigation.
8. Deploying the PHP Website
Once development is complete, deploy your PHP website using:
· Shared Hosting with cPanel for easy management.
· Cloud Hosting (AWS, DigitalOcean) for high performance.
· Domain & SSL Certificate for a secure and professional website.
Conclusion
Developing a website using PHP is an efficient way to create dynamic and interactive websites. By following this step-by-step guide, you can build a PHP-based website from scratch, implement database interactions, user authentication, and deploy your project successfully. Start your PHP development journey today and create powerful web applications!
#web development#seo services#web designing#social media marketing#graphic design#digital marketing#digitalmarketing#marketing#digitalindia#seo
1 note
·
View note
Text
SAP ABAP Training Overview
SAP ABAP Training Overview
Introduction to SAP ABAP
SAP ABAP Course in online Training Sophisticated, Application Programming (ABAP) is top -level programming to succeed the application in the SAP circumstance. It allows businesses to make, enhance, and increase SAP applications to meet specific requirements. SAP solutions are on high demand across industries, and mastering the skill of ABAP is very valuable for IT professionals.
Importance of SAP ABAP Training SAP ABAP is the key for professionals looking to specialize in SAP development. Some of the main reasons for doing ABAP training are:
Industry Relevance – Many organizations use SAP, so the expertise in ABAP is very desirable.
Integration Capabilities – ABAP integrates seamlessly with SAP HANA, SAP Fiori, and other modern technologies.
Career Advancement – ABAP developers have a good career prospect in SAP consulting and development roles. Customization and Performance Optimization – Organizations apply ABAP to customize SAP solutions for higher productivity. Major SAP ABAP Training Elements
A formalized SAP ABAP training course entails the following topics of the language:
SAP System Architecture
Understanding the fundamental elements of the SAP world is crucial before entering the ABAP programming arena:
SAP NetWeaver Platform
SAP GUI and Web-Based Interfaces
Database and Application Layers
SAP Modules and Business Processes
ABAP Development Environment
SAP ABAP development is done within the ABAP Workbench that includes:
ABAP Editor – Writing and editing ABAP code.
Data Dictionary (SE11) – Defining database objects such as tables and views.
Function Builder (SE37) – Creating function modules.
Class Builder (SE24) – Implementing object-oriented programming.
Debugging Tools – Identifying and fixing code errors.
Core Concepts Covered under Training
A full-fledged SAP ABAP training program is designed to initiate learners into crucial ABAP concepts:
Basic Syntax and Data Types
Data Types: Integer, Float, Character, String, Date, Time
Variables and Constants
Operators and Expressions
Control Statements (IF, CASE, LOOP, WHILE)
Modularization Techniques
Subroutines (FORM and ENDFORM)
Function Modules
Methods and Classes (Object-Oriented ABAP)
Database Interaction
Creating Database Tables
SELECT, INSERT, UPDATE, DELETE Statements
Joins and Aggregate Functions
Open SQL vs. Native SQL
Report Development
Classical Reports
Interactive Reports
ALV (ABAP List Viewer) Reports
SmartForms and SAP Script
Debugging and Performance Optimization
Debugging ABAP Programs
Runtime Analysis and SQL Tracing
Code Inspector and Performance Tuning
Selecting a Quality SAP ABAP Training Program
There are several criteria to look for in choosing an Internet-based or in-class ABAP training course:
Comprehensive Curriculum : The program should cover all types of basic and advanced ABAP topics. Practical Exercises : Prepared assignments and actual projects will enforce the learned concepts. Experienced Trainers : Learning from industry professionals will enhance knowledge retention. Certification Preparation : While some of these programs prepare learners for SAP ABAP certification. Community Support – There is a learner community and instructor support for learning.
Career Options for ABAP Developers
There are many career options that arise with ABAP expertise, including:
ABAP Developer – Develops and maintains SAP applications.
SAP Technical Consultant – Implementation and optimization of SAP solutions.
SAP Functional Consultant – Team collaboration with the technical teams for SAP customization.
SAP Basis Administrator – Administration of SAP system landscapes.
SAP HANA Developer – Work on SAP's in-memory computing platform.
Conclusion The training in SAP ABAP gives knowledge and skills in developing, customizing, and optimizing SAP applications. With the right training structure, a beginner will build his confidence and expertise in ABAP programming to result in great career prospects within the SAP ecosystem. Mastering ABAP gives professionals the potential to contribute to business success in businesses using SAP solutions and career advancement in enterprise software development.
1 note
·
View note
Text
How to Learn Power BI: A Step-by-Step Guide
Power BI is a powerful business intelligence tool that allows users to analyze data and create interactive reports. Whether you’re a beginner or looking to enhance your skills, learning Power BI can open doors to career opportunities in data analytics and business intelligence. For those looking to enhance their skills, Power BI Online Training & Placement programs offer comprehensive education and job placement assistance, making it easier to master this tool and advance your career.

Here’s a step-by-step guide to mastering Power BI.
Step 1: Understand What Power BI Is
Power BI is a Microsoft tool designed for data analysis and visualization. It consists of three main components:
Power BI Desktop – Used for building reports and dashboards.
Power BI Service – A cloud-based platform for sharing and collaborating on reports.
Power BI Mobile – Allows users to access reports on smartphones and tablets.
Familiarizing yourself with these components will give you a clear understanding of Power BI’s capabilities.
Step 2: Install Power BI Desktop
Power BI Desktop is free to download from the Microsoft website. It’s the primary tool used to create reports and dashboards. Installing it on your computer is the first step to hands-on learning.
Step 3: Learn the Power BI Interface
Once installed, explore the Power BI interface, including:
Home Ribbon – Where you access basic tools like importing data and formatting visuals.
Data Pane – Displays the data tables and fields available for reporting.
Visualizations Pane – Contains different chart types, tables, and custom visuals.
Report Canvas – The workspace where you design and organize your reports.
Getting comfortable with the interface will make learning easier.
Step 4: Import and Transform Data
Power BI allows you to connect to various data sources like Excel, SQL databases, and cloud applications. Learning how to:
Import data from multiple sources.
Use Power Query Editor to clean and shape data.
Handle missing values, remove duplicates, and structure data for analysis. It’s simpler to master this tool and progress your profession with the help of Best Online Training & Placement programs, which provide thorough instruction and job placement support to anyone seeking to improve their talents.

Data transformation is a crucial step in building accurate and meaningful reports.
Step 5: Create Visualizations
Power BI provides multiple visualization options, including:
Bar charts, pie charts, and line graphs.
Tables, matrices, and cards.
Maps and custom visuals from the Power BI marketplace.
Experimenting with different visualizations helps you present data effectively.
Step 6: Learn DAX (Data Analysis Expressions)
DAX is a formula language used in Power BI to create calculated columns, measures, and custom calculations. Some key DAX functions include:
SUM() – Adds values in a column.
AVERAGE() – Calculates the average of a set of values.
IF() – Creates conditional calculations.
Mastering DAX enables you to perform advanced data analysis.
Step 7: Build and Publish Reports
Once you’ve created a report, learn how to:
Organize multiple pages in a dashboard.
Add filters and slicers for interactive analysis.
Publish reports to Power BI Service for sharing and collaboration.
Publishing reports makes them accessible to teams and decision-makers.
Step 8: Explore Power BI Service and Cloud Features
Power BI Service allows you to:
Schedule automatic data refreshes.
Share dashboards with team members.
Implement row-level security for restricted data access.
Learning cloud-based features enhances collaboration and security in Power BI.
Step 9: Join Power BI Communities
Engaging with the Power BI community can help you stay updated with new features and best practices. You can:
Follow the Microsoft Power BI blog for updates.
Participate in Power BI forums and LinkedIn groups.
Attend webinars and join Power BI user groups.
Networking with other Power BI users can provide valuable insights and learning opportunities.
Step 10: Get Certified and Keep Practicing
If you want to showcase your expertise, consider obtaining a Microsoft Power BI Certification (PL-300: Power BI Data Analyst). Certification enhances your resume and validates your skills.
To stay ahead, keep practicing by working on real-world datasets, building dashboards, and experimenting with advanced Power BI features. Continuous learning is the key to becoming a Power BI expert.
By following these steps, you can systematically learn Power BI and develop the skills needed to analyze and visualize data effectively. Happy learning!
0 notes
Text
Microsoft Fabric data warehouse
Microsoft Fabric data warehouse
What Is Microsoft Fabric and Why You Should Care?
Unified Software as a Service (SaaS), offering End-To-End analytics platform
Gives you a bunch of tools all together, Microsoft Fabric OneLake supports seamless integration, enabling collaboration on this unified data analytics platform
Scalable Analytics
Accessibility from anywhere with an internet connection
Streamlines collaboration among data professionals
Empowering low-to-no-code approach
Components of Microsoft Fabric
Fabric provides comprehensive data analytics solutions, encompassing services for data movement and transformation, analysis and actions, and deriving insights and patterns through machine learning. Although Microsoft Fabric includes several components, this article will use three primary experiences: Data Factory, Data Warehouse, and Power BI.
Lake House vs. Warehouse: Which Data Storage Solution is Right for You?
In simple terms, the underlying storage format in both Lake Houses and Warehouses is the Delta format, an enhanced version of the Parquet format.
Usage and Format Support
A Lake House combines the capabilities of a data lake and a data warehouse, supporting unstructured, semi-structured, and structured formats. In contrast, a data Warehouse supports only structured formats.
When your organization needs to process big data characterized by high volume, velocity, and variety, and when you require data loading and transformation using Spark engines via notebooks, a Lake House is recommended. A Lakehouse can process both structured tables and unstructured/semi-structured files, offering managed and external table options. Microsoft Fabric OneLake serves as the foundational layer for storing structured and unstructured data Notebooks can be used for READ and WRITE operations in a Lakehouse. However, you cannot connect to a Lake House with an SQL client directly, without using SQL endpoints.
On the other hand, a Warehouse excels in processing and storing structured formats, utilizing stored procedures, tables, and views. Processing data in a Warehouse requires only T-SQL knowledge. It functions similarly to a typical RDBMS database but with a different internal storage architecture, as each table’s data is stored in the Delta format within OneLake. Users can access Warehouse data directly using any SQL client or the in-built graphical SQL editor, performing READ and WRITE operations with T-SQL and its elements like stored procedures and views. Notebooks can also connect to the Warehouse, but only for READ operations.
An SQL endpoint is like a special doorway that lets other computer programs talk to a database or storage system using a language called SQL. With this endpoint, you can ask questions (queries) to get information from the database, like searching for specific data or making changes to it. It’s kind of like using a search engine to find things on the internet, but for your data stored in the Fabric system. These SQL endpoints are often used for tasks like getting data, asking questions about it, and making changes to it within the Fabric system.
Choosing Between Lakehouse and Warehouse
The decision to use a Lakehouse or Warehouse depends on several factors:
Migrating from a Traditional Data Warehouse: If your organization does not have big data processing requirements, a Warehouse is suitable.
Migrating from a Mixed Big Data and Traditional RDBMS System: If your existing solution includes both a big data platform and traditional RDBMS systems with structured data, using both a Lakehouse and a Warehouse is ideal. Perform big data operations with notebooks connected to the Lakehouse and RDBMS operations with T-SQL connected to the Warehouse.
Note: In both scenarios, once the data resides in either a Lakehouse or a Warehouse, Power BI can connect to both using SQL endpoints.
A Glimpse into the Data Factory Experience in Microsoft Fabric
In the Data Factory experience, we focus primarily on two items: Data Pipeline and Data Flow.
Data Pipelines
Used to orchestrate different activities for extracting, loading, and transforming data.
Ideal for building reusable code that can be utilized across other modules.
Enables activity-level monitoring.
To what can we compare Data Pipelines ?
microsoft fabric data pipelines Data Pipelines are similar, but not the same as:
Informatica -> Workflows
ODI -> Packages
Dataflows
Utilized when a GUI tool with Power Query UI experience is required for building Extract, Transform, and Load (ETL) logic.
Employed when individual selection of source and destination components is necessary, along with the inclusion of various transformation logic for each table.
To what can we compare Data Flows ?
Dataflows are similar, but not same as :
Informatica -> Mappings
ODI -> Mappings / Interfaces
Are You Ready to Migrate Your Data Warehouse to Microsoft Fabric?
Here is our solution for implementing the Medallion Architecture with Fabric data Warehouse:
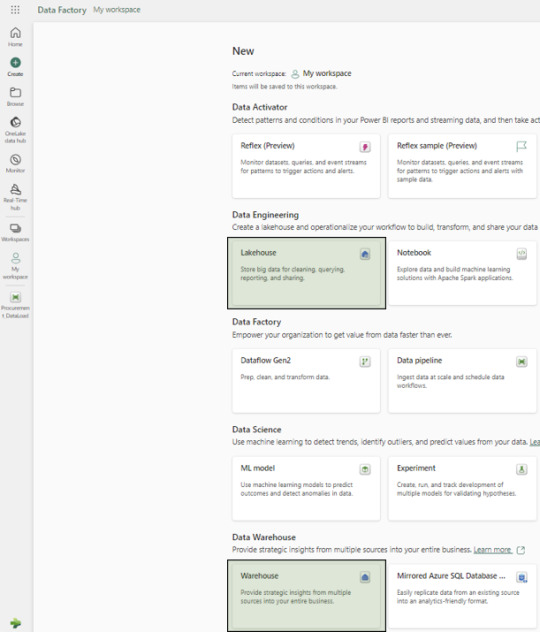
Creation of New Workspace
We recommend creating separate workspaces for Semantic Models, Reports, and Data Pipelines as a best practice.
Creation of Warehouse and Lakehouse
Follow the on-screen instructions to setup new Lakehouse and a Warehouse:
Configuration Setups
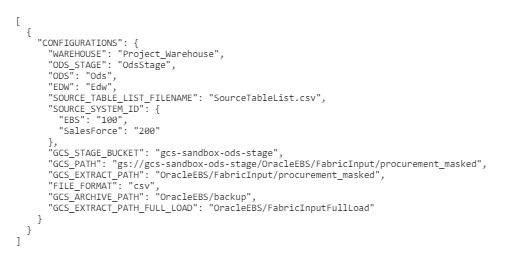
Create a configurations.json file containing parameters for data pipeline activities:
Source schema, buckets, and path
Destination warehouse name
Names of warehouse layers bronze, silver and gold – OdsStage,Ods and Edw
List of source tables/files in a specific format
Source System Id’s for different sources
Below is the screenshot of the (config_variables.json) :
File Placement
Place the configurations.json and SourceTableList.csv files in the Fabric Lakehouse.
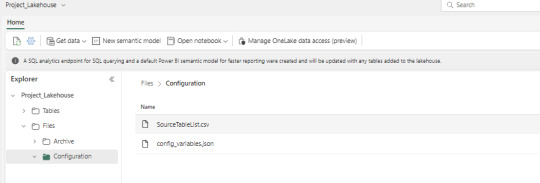
SourceTableList will have columns such as – SourceSystem, SourceDatasetId, TableName, PrimaryKey, UpdateKey, CDCColumnName, SoftDeleteColumn, ArchiveDate, ArchiveKey
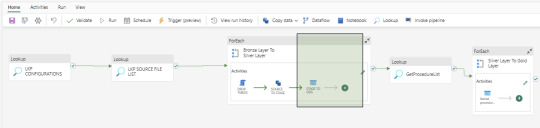
Data Pipeline Creation
Create a data pipeline to orchestrate various activities for data extraction, loading, and transformation. Below is the screenshot of the Data Pipeline and here you can see the different activities like – Lookup, ForEach, Script, Copy Data and Stored Procedure
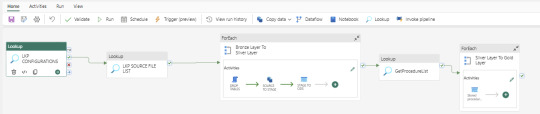
Bronze Layer Loading
Develop a dynamic activity to load data into the Bronze Layer (OdsStage schema in Warehouse). This layer truncates and reloads data each time.
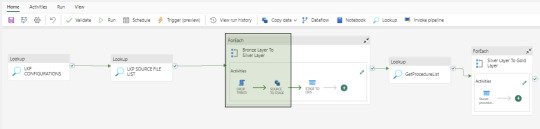
We utilize two activities in this layer: Script Activity and Copy Data Activity. Both activities receive parameterized inputs from the Configuration file and SourceTableList file. The Script activity drops the staging table, and the Copy Data activity creates and loads data into the OdsStage table. These activities are reusable across modules and feature powerful capabilities for fast data loading.
Silver Layer Loading
Establish a dynamic activity to UPSERT data into the Silver layer (Ods schema in Warehouse) using a stored procedure activity. This procedure takes parameterized inputs from the Configuration file and SourceTableList file, handling both UPDATE and INSERT operations. This stored procedure is reusable. At this time, MERGE statements are not supported by Fabric Warehouse. However, this feature may be added in the future.
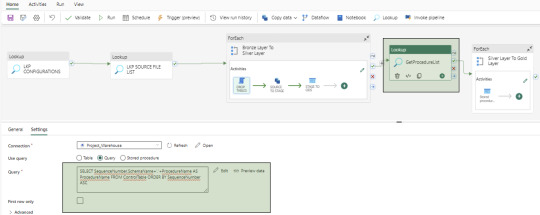
Control Table Creation
Create a control table in the Warehouse with columns containing Sequence Numbers and Procedure Names to manage dependencies between Dimensions, Facts, and Aggregate tables. And finally fetch the values using a Lookup activity.
Gold Layer Loading
To load data into the Gold Layer (Edw schema in the warehouse), we develop individual stored procedures to UPSERT (UPDATE and INSERT) data for each dimension, fact, and aggregate table. While Dataflow can also be used for this task, we prefer stored procedures to handle the nature of complex business logic.

Dashboards and Reporting
Fabric includes the Power BI application, which can connect to the SQL endpoints of both the Lakehouse and Warehouse. These SQL endpoints allow for the creation of semantic models, which are then used to develop reports and applications. In our use case, the semantic models are built from the Gold layer (Edw schema in Warehouse) tables.
Upcoming Topics Preview
In the upcoming articles, we will cover topics such as notebooks, dataflows, lakehouse, security and other related subjects.
Conclusion
microsoft Fabric data warehouse stands as a potent and user-friendly data manipulation platform, offering an extensive array of tools for data ingestion, storage, transformation, and analysis. Whether you’re a novice or a seasoned data analyst, Fabric empowers you to optimize your workflow and harness the full potential of your data.
We specialize in aiding organizations in meticulously planning and flawlessly executing data projects, ensuring utmost precision and efficiency.
Curious and would like to hear more about this article ?
Contact us at [email protected] or Book time with me to organize a 100%-free, no-obligation call
Follow us on LinkedIn for more interesting updates!!
DataPlatr Inc. specializes in data engineering & analytics with pre-built data models for Enterprise Applications like SAP, Oracle EBS, Workday, Salesforce to empower businesses to unlock the full potential of their data. Our pre-built enterprise data engineering models are designed to expedite the development of data pipelines, data transformation, and integration, saving you time and resources.
Our team of experienced data engineers, scientists and analysts utilize cutting-edge data infrastructure into valuable insights and help enterprise clients optimize their Sales, Marketing, Operations, Financials, Supply chain, Human capital and Customer experiences.
0 notes
Text
How to Connect Power BI to Data Sources

Step-by-Step Guide to Connecting Various Data Sources Like Excel, SQL Server, and Web APIs
Microsoft Power BI is among the most popular tools for data visualization and business intelligence. To utilize its complete features, one should know how to connect Power BI with the many available data sources. At GVT Academy, we would teach you how to connect and use Power BI tools effectively, making the most of their implementation in this course. This article teaches you step-by-step on how to connect Power BI to some of the most common data sources like Excel, an SQL server, and web API.
1. Connecting Power BI to Excel
Excel is one of the most frequently used data sources in business settings. Here’s how to link your Power BI dashboard to an Excel file:
Launch Power BI Desktop: Open the Power BI Desktop application.
Select the Data Source: Click on Home > Get Data > Excel Workbook.
Browse Your File: Navigate to the location of your Excel file and select it.
Load or Transform Data: After the file loads, a Navigator pane will appear. Choose the specific sheets or tables you want to use. You can click Load to directly import or Transform Data to clean and shape it using Power Query Editor.
2. Connecting Power BI to SQL Server
For larger datasets, SQL Server is often the preferred data source. Follow these steps to connect Power BI to SQL Server:
Click on Get Data: Go to Home > Get Data > SQL Server.
Enter the Server Details: Input the server name and database name. If you’re unsure, ask your database administrator.
Authentication Method: Choose the authentication type (Windows or SQL Server). Enter your credentials if required.
Select the Data: Once connected, the Navigator window will display available tables and views. Select the required ones and click Load or Transform Data.
Tip: Power BI supports Direct Query, which allows real-time data fetching from SQL Server for up-to-date dashboards.
3. Connecting Power BI to Web APIs
Web APIs are becoming an increasingly common data source for businesses relying on online services. Here’s how you can connect:
Go to Get Data: In the Home tab, select Get Data > Web.
Enter the API URL: Provide the API endpoint (URL). Make sure you have the required API key or token for authentication.
Choose the Access Level: Depending on the API, you might need to select between anonymous, basic, or organizational account access.
Load Data: Power BI will fetch the data, and you can use Power Query to clean and transform it for visualization.
Tip: Use JSON format data and tools like Postman to test API endpoints before connecting them to Power BI.
Why Learn Power BI at GVT Academy?
The Power BI program offered by GVT Academy comprises everything, such as connecting a data source to transforming, modeling, and reporting in an effective way for organization performance. Knowing these skills will help create dynamic dashboards and gain insights that can be put into action for the organization.
Conclusion
It is connecting Power BI to various data sources such as Excel, SQL Server, and web APIs. This is a key skill for anyone who wants to work with data, whether they are just starting or trying to improve their knowledge. Knowing how to connect these data sources enables you to create powerful visualization.
Enroll right now into the GVT Academy Power BI course and become a master in data visualization to achieve new career heights!
#gvt academy#power bi course#power bi training#data science#advanced excel training#data analytics#python
0 notes