#swift 5.2
Explore tagged Tumblr posts
Visit Tumblr Blog
Explore Tumblr blogs with no restrictions, modern design and the best experience.
Last Seen Tumblr Blogs


Fun Fact
In Q3 of 2020, 31% of US users access the Tumblr app daily.
Text


Match Made in Paradise Part 5.2: Swift Escape
#cookie run kingdom#black sapphire cookie#blackbell#cookie run comic studio#pavlova cookie#cookie run#silverbell cookie
33 notes
·
View notes
Text
Kinktober day 13: Multiple kinks, listed in warnings
Fic: Chris Evans
Warnings ⚠️: SMUT!! 18+, Slight Size Kink if u squint, Slight lingerie kink, NOT PROOF READ!! NOT EDITED!! Sorry if it's really bad, I wrote this at 2am cause I couldn't sleep
W.C: 834

It was a gloomy, rainy evening. The only thing I was looking forward to tonight was seeing my husband. Obviously, as an actor he gets called in at random times during the week, but we were both a bit upset when he got called in this morning. Chris had planned to take me out for dinner tonight as it was our anniversary.
Then my phone started ringing and my ringtone went off as 'Mine' by Taylor Swift. I smiled a little as I realised who had called me. I thought it was quite cute, setting my ringtone as that very song, as it was the only one I knew that described mine and Chris' relationship almost perfectly. I picked up the phone and was greeted by a deep bostonian accent. "Hey babe. How are you?"
"Hi Chrissy" I replied "I'm good, how's work?"
"I was just calling cause, my set just finished and they promised not to call me in until next wednesday. So are we still cool for dinner?" Chris questioned as I fiddled with my nails nervously.
"Yeah totally. What time will you be home?" I asked as I walked over to the calendar to check our reservation time.
"Definitely not before 6. I'll be stuck in traffic for a while." "Shit, What time is our reservation?" He asked suddenly.
"It's at 5:30 so we'll have to cancel." I declared, feeling guilty. "Could you call them up please."
"Yep, I'll do it right after this call." I answered, "Thanks baby. I'll see you soon, love you." Said Chris,
"Love you too, be safe on the road."
I replied before I hung up.
After calling up the restaurant to cancel our reservation, I figured Chris would be home soon. So I put on his favourite one of my lingerie, and set the bedding so it would be ready by the time he arrived home.
About an hour later, I heard the front door open, and in walked my husband. I frowned as I realised just how tall Chris' 6ft frame was compared to to my tiny 5.2 feet.
"Hi love!" I exclaimed as I walked up to kiss him. I heard a gasp exit his mouth as he turned around to see me in such intimate clothing. "Hi baby" "You look amazing!" He marveled as he returned my kiss. "Thanks, I was thinking. Since we couldn't go out for dinner, we could maybe celebrate at home. In bed. No clothes." I asked nervously. Earning a little laugh from Chris, and replying with "Sure, Why not. We haven't had time to 'hang out' in a while"
With that confirmation of yes, I ran upstairs to our bedroom, hearing Chris' footsteps following shortly behind. Once again the realisation hit, Chris was huge compared to me. However, I kinda liked the size difference. It was basically a turn on for me. I climbed onto the bed as he entered the bedroom, shirt already discarded. His tattoo's making me go feral, I pulled him onto the bed, having Chris towering over me.
"I love this lingerie, you look so sexy in it." Stated Chris as he started pressing soft kisses on my neck,
"I know Baby, that's why I wore it. But I'd love it better if you would take it off me" I smirked. Feeling Chris pause, I tugged at his belt, urging him to continue. With a small laugh, He continued kissing me while removing his belt and pants. "May I?" He asked as he started playing with my shoulder straps. With a nod of consent, he started undoing the straps, finally discarding the piece of clothing.
My soft, eager moans filled the room as Chris started kissing his way down to my breasts. Finally taking one of my nipples in his mouth. "Fuck" I moaned over and over again as he rolled his tongue around the sensitive areas.
"Feel good baby?" He questioned as he moved down, to align his cock to my entrance. I could only moan in response, feeling too overwhelmed to put together a sentence.
"Ready" Chris asked as he inserted his tip, through my folds. "Go for it baby" I replied, sounding way too desperate.
Chris' huge figure towered over me as he thrusted into me. I couldn't keep myself from crying out his name in pleasure. He went faster and faster, bringing his thumb to start rubbing my clit. An electric feeling ran through my body as I felt myself coming closer to my orgasmn. Chris' fingers working wonders. His thrusts became slower and lazy, "Come on baby, when you're ready, Cum for me" He whispered in my ear as he continued moving his hips. "Fuck! Chris!" I moaned as I came undone under his work. Him following seconds later, squirting hot cum inside me.
Not long after our 'hang out' time, Chris brought dinner to our bedroom. We ended up ordering take out, since we knew we would get to doing more 'hanging out' later tonight.
🔥🔥🔥🔥🔥🔥🔥🔥🔥🔥🔥🔥🔥🔥🔥🔥
This was supposed to be a Drabble but I got carried away lol
#marvel fanfiction#chris evans moodboard#chris evans imagine#chris evans fanfiction#christopher robert evans#chris evans#chris evans smut#chris evans x reader#chris evans x you#mcu#marvel fic#marvel cast#captain america#captain#americas ass#kinktober day 13#writing challenge
154 notes
·
View notes
Text


Hi everyone I made a Taylor swift Spotify wrapped using @billboard and @google
Here you go , please use credit if you wanna share to a group ;
🎉 Taylor Swift 2024 Wrapped 🎉
Hey, Swiftie! 2024 unforgettable year for Taylor Swift. Let’s take a look back at your most iconic moments, streams, and chart dominance.
📈 2024 Stats & Achievements
Global Streams: Over 40 billion streams across all platforms, solidifying Taylor as one of the most-streamed artists of the year.
Top 2 Most-Streamed Tracks:
"Cruel Summer (The 2023 Version)" – 5.2 billion streams
"Anti-Hero" – 4.8 billion streams
Album Streams:
"Midnights (Deluxe Edition)" – 18 billion streams (new deluxe versions made it the most streamed album of the year)
"1989 (Taylor's Version)" – 14 billion streams, topping charts worldwide after the re-release.
"Red (Taylor's Version)" – 12.3 billion streams (Still holding on strong!)
🏆 Chart Achievements & Awards
Billboard 200: "Midnights" was the #1 album for 11 weeks.
Billboard Hot 100:
"Cruel Summer" entered the Top 10 for the first time in 2024, landing at #5.
"Anti-Hero" held the #1 spot for 6 weeks, becoming one of the longest-running hits of the year.
Grammys 2024:
Album of the Year – "Midnights (Deluxe Edition)"
Song of the Year – "Anti-Hero"
Best Pop Vocal Album – "1989 (Taylor's Version)"
American Music Awards:
Artist of the Year
Favorite Pop Album – "1989 (Taylor's Version)"
🌍 International Dominance
Top 10 Countries where you had the most streams:
USA 🇺🇸
UK 🇬🇧
Australia 🇦🇺
Canada 🇨🇦
Japan 🇯🇵
Brazil 🇧🇷
South Korea 🇰🇷
Germany 🇩🇪
Mexico 🇲🇽
France 🇫🇷
Taylor's influence crossed continents in 2024, as she continued to top charts from Asia to Latin America, while her Eras Tour sold out stadiums in over 30 countries.
🎤 Tours & Performances
The Eras Tour 2024 was a worldwide phenomenon, selling over 10 million tickets and grossing over $1.3 billion.
Iconic performances included the "Midnight Show" at the MetLife Stadium and "1989 Revisited" at the O2 Arena in London, both becoming viral sensations on social media.
YouTube Views: Her concert film, "Taylor Swift: The Eras Tour" reached 2 billion views, with fans reminiscing about every unforgettable moment.
🔮 What’s next?
2025 is already shaping up to be even bigger, with rumors of a new album, more re-records, and continued chart domination. Taylor’s reaching new heights, and you’ll be along for every step of the journey!
Please note the tortured poets department 🏬 is not added to a lot of these statistics due to most award shows having taken place before the release :)
Enjoy
Xoxoxox fangirl news
Edit : fixed the spelling error thx guys 🤍
#taylor swift#pop culture#evermore#ttpd era#midnights#swifties#the tortured poets department#folklore#ts11#spotify
11 notes
·
View notes
Text
Adaptive Modeling of Net Monetary Sovereignty under Hybrid Threats: A Strategic Framework for Digital Resilience
Abstract
In an era marked by geopolitical fragmentation, financial sanctions, and cyberwarfare, central banks must evolve beyond traditional monetary policy instruments. This paper introduces an advanced framework for simulating Net Monetary Sovereignty (NMS) under hybrid threat conditions, integrating stochastic modeling, adaptive digital policy, reinforcement learning, and real-time geopolitical indicators. We present a dynamic system that evaluates the resilience of a national currency regime in response to coordinated cyberattacks, economic shocks, and external sanctions. Our findings suggest that policy effectiveness significantly increases when infrastructure readiness and public trust are accounted for, and that synergy between digital penetration and domestic currency dominance is critical for future monetary stability.
1. Introduction
As monetary policy becomes entangled with cybersecurity, AI, and geopolitics, classical notions of sovereignty must be redefined. The rise of central bank digital currencies (CBDCs), regional clearing alternatives (e.g., CIPS, SPFS), and decentralized tokenization of reserves signals a tectonic shift in the architecture of global finance.
This study develops and simulates a framework for Net Monetary Sovereignty (NMS) as a multidimensional, temporally evolving construct—vulnerable to shocks but stabilizable through smart, adaptive mechanisms.
2. Theoretical Foundations
2.1 Core Components of NMS
We define NMS as a function of four interdependent variables:
D(t): Domestic monetary dominance
A(t): Autonomy in international settlement
P(t): Digital currency penetration
X(t): Dependency on external assets/infrastructure
2.2 Enhanced NMS Equation
We propose:dNMS(t)=[αdDdt+βdAdt+γdPdt−δdXdt+ϵD(t)P(t)]dt+σdW(t)+∑ηkdJk(t)
ϵD(t)P(t): synergy term modeling feedback between currency legitimacy and digital reach
dJk(t): jump process representing cyberattacks or sanctions
3. Adaptive Policy Architecture
3.1 Digital Sovereign Policy Model
Post-attack recovery is modeled as:Adjustment(t)=0.01⋅I(t)⋅T(t)1+e−τ(t−i)
I(t): infrastructure readiness (5G, blockchain nodes)
T(t): public trust in digital instruments
This reflects a system in which the speed and efficacy of monetary repair depend on physical/digital infrastructure and perceived legitimacy.
4. Simulation Engine
4.1 State Variables
s(t)=[NMS,D,A,P,X,TensionIndex,I,T]
4.2 Threat Modeling
Cyberattack intensity:λk(t)=λ0⋅TensionIndex(t)Derived from real-time data (e.g., GDELT geopolitical news index)
4.3 Reinforcement Learning Agent
Algorithm: PPO (Proximal Policy Optimization)
Objective: Maximize NMS while minimizing inflation, dependence, and time-to-recovery
Adversarial module simulates intelligent attacker behavior based on past patterns (e.g., 2022 SWIFT blacklisting, infrastructure breaches)
5. Empirical Validation
5.1 Scenario: Coordinated Attack on Energy and Finance
Without policy: 12% drop in NMS within 6 months
With adaptive buffer:
Immediate stabilization through digital gold tokenization (10% reserve mobilized)
Strategic deployment of regional currency swaps (reduced X by 8%)
2× faster recovery compared to control
5.2 Simulation Visualization
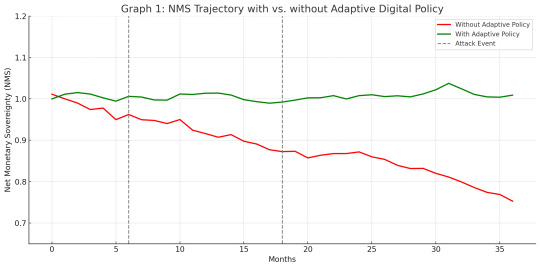
Graph 1: NMS trajectory with vs. without adaptive digital policy
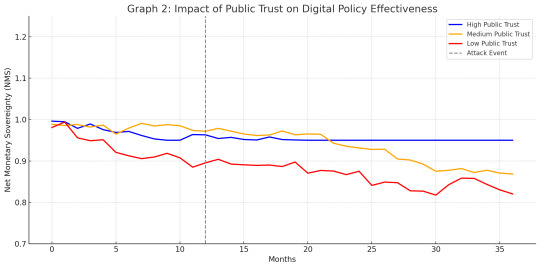
Graph 2: Impact of public trust volatility on digital buffer effectiveness
6. Strategic Implications
6.1 For Sanctioned or Isolated States
Digital buffer policies are essential for monetary survival
Regional integration (e.g., BRICS+ CIPS corridors) enhances A(t)
6.2 For Advanced Economies (e.g., U.S., EU)
NMS framework can be integrated into FedNow, ECB TIPS to assess resilience
Tokenization of reserves could improve systemic agility under coordinated attacks
6.3 For Global CBDC Architecture
NMS can serve as a resilience benchmark for cross-border CBDC interoperability
Suggests inclusion of AI-coordinated liquidity buffers in digital currency protocol design
7. Policy Recommendations
HorizonRecommendationImmediatePilot reinforcement learning framework within national monetary sandboxShort-TermDeploy sovereign trust index as part of digital monetary reportingMedium-TermCreate bilateral tokenized swap lines with friendly jurisdictionsLong-TermEmbed NMS module into central bank macro-modeling platforms (e.g., DSGE models)
8. Conclusion
This model represents a convergence of digital economics, monetary sovereignty, and intelligent defense. In a fragmented and adversarial world economy, the central bank of the future must act as a cyber-resilient, data-driven, real-time sovereign infrastructure hub. Net Monetary Sovereignty is no longer static—it is programmable, adaptive, and, if necessary, weaponized.
9. References
Brunnermeier, M. et al. (2021). The Digitalization of Money
Ghosh, I. (2023). Hybrid Warfare and Central Bank Liquidity Shields
Shiryaev, A. et al. (2008). Optimal Stopping and Control under Uncertainty
Kaspersky Lab (2022). Threat Intelligence for Financial Systems
Chainalysis (2023). Global Crypto Adoption Index
GDELT Project (2024). Global Tension Data for Risk Monitoring
0 notes
Text
more ruminating lavos math
so i pointed out that lavos' ability efficiency is weird. going by cooldown as equivalent to energy, it's like if efficiency made energy vampire give you more energy rather than reduce the energy cost.
i also brought up how, going by examples like envamp and nourish, cooldown reduction should scale with strength. i'm gonna do some math to see what that world (where efficiency reduces cooldown immediately and strength affects cooldown reduction) would have.
so transmutation probe is lavos' big cooldown reducer. it reduces his cooldowns by 1.5 seconds for every enemy hit. add 30% energy efficiency, now you have 1.95 per hit. to completely cool down bite, base probe would take 6 hits while 130% probe would take 5. minor difference, pretty fair. bite is meant to be a heal.
now, let's say we have 172% strength from bellicose and 3025 health, as well as 130% efficiency (or in other words, my actual lavos build lol) and apply consistent efficiency. in this case bite has a 6.1 second cooldown now with 130% efficiency. but more importantly, probe now cuts cooldowns by 2.5 seconds! that means bite is instantly cooled down by three hits!
but the kicker is swift bite. with swift bite, ophidian bite reduces cooldowns by 4 seconds when it hits 4 or more enemies. in its own case, it's mostly just cutting its cooldown in half, but with 130% efficiency the cooldown reduction is boosted to 5.2, and its own cooldown is cut to 2.8. it's just meant to reward you with more bites faster if you use them on groups.
now let's apply the consistent efficiency scenario. first of all, bite has a cooldown of 6.1. swift bite with 130% strength cuts its own cooldown to 0.9 seconds! that's already broken enough and i haven't even gotten to the point.
the point of course being, 0 cooldown. 172 strength gives us 6.8 cdr. first, that's enough to instantly cdr catalyze in 5 hits, assuming these hits all hit four enemies. now with 100% efficiency, the base 8 second cd, swift bite reduces it to 1.2 seconds. but, of course, we're running 130% efficiency. 6.1 cooldown. 6.8 cdr. you could rapid fire machine gun swift bite until there are no longer 4 enemies in range.
and even then, 200% strength would give you a full 8 second cdr, enough to instantly cd 100% efficiency bite.
now as for probe... 7 second cooldown. in the 172 str 130 eff scenario, you could bite during the probe's lifetime and only have a 0.2 cooldown on probe.
tldr, there's a damn good reason lavos interprets efficiency so weirdly. because it's pretty hard to get high efficiency and, more importantly, it doesn't go over 175.
#warframe#mathematics#de preemptively placed swift bite back into mortal boundaries when they programmed lavos#no promises if they give us augment slots though
1 note
·
View note
Text
🧹 Household Vacuum Cleaners Market Set to Hit $24.3B by 2034! (5.2% CAGR Growth 🚀)

Household Vacuum Cleaners Market is on a steady upward climb, projected to grow from $14.6 billion in 2024 to $24.3 billion by 2034, at a healthy CAGR of 5.2%. As households prioritize convenience, hygiene, and smart technology, the demand for efficient vacuum cleaners continues to rise.
From traditional upright models to sleek robotic vacuums, today’s market is packed with options catering to every lifestyle. Smart features like automatic dirt disposal, HEPA filtration, and mobile app controls have become the norm rather than the exception. Urbanization, higher disposable incomes, and increasing awareness around indoor air quality are further fueling this market’s impressive expansion.
Click to Request a Sample of this Report for Additional Market Insights : https://www.globalinsightservices.com/request-sample/?id=GIS32346
Market Dynamics
Several factors are driving the household vacuum cleaners market’s momentum. First and foremost is the surge in smart home integration — consumers want appliances that can seamlessly communicate with their home systems. Robotic vacuum cleaners, in particular, have seen a boom, capturing 45% of the market share thanks to features like automated scheduling and AI-driven navigation. Additionally, cordless models are reshaping consumer expectations around flexibility and convenience. Environmental consciousness is another major trend, pushing manufacturers to innovate with energy-efficient designs and recyclable materials. However, challenges such as supply chain disruptions, rising raw material costs, and market saturation in developed regions present hurdles that brands must strategically navigate.
Key Players Analysis
The competitive landscape of the household vacuum cleaners market is vibrant and fierce. Leading the pack are giants like Dyson, iRobot, and SharkNinja, who continuously set new benchmarks for innovation and performance. Other major players include Miele, Bissell, Electrolux, and Samsung Electronics, each bringing their own strengths to the table. Emerging companies like Eco Sweep Innovations and Swift Vac Technologies are also gaining traction, thanks to their focus on sustainability and smart technologies. With a sharp eye on R&D investments, these players are racing to develop quieter, more powerful, and smarter cleaning devices that cater to the changing tastes of modern consumers.
Regional Analysis
Regionally, North America dominates the household vacuum cleaners market, buoyed by a tech-savvy population and strong disposable incomes. The U.S. leads the way, with Canada closely following, both favoring smart and robotic cleaning solutions. Europe stands firm as the second-largest market, with Germany and the UK prioritizing eco-friendly, energy-efficient models. The EU’s strict environmental regulations also push innovation in this space. The Asia-Pacific region is the fastest-growing, thanks to urbanization and a burgeoning middle class in countries like China and India. Latin America and the Middle East & Africa show moderate growth, mainly driven by urbanization and an emerging affluent class in major cities.
Recent News & Developments
The household vacuum cleaners market is witnessing exciting developments. Innovations like smart mapping, UV sterilization, and AI-enhanced navigation are revolutionizing robotic vacuum cleaners. Post-pandemic, there’s heightened awareness around indoor hygiene, leading to a spike in demand for HEPA filter-enabled devices. Pricing strategies now range from ultra-affordable $50 models to high-end machines priced at $500 and above. Meanwhile, companies are doubling down on e-commerce, leveraging online platforms to reach a wider consumer base. Sustainability efforts are also front and center, with brands introducing models made from recycled plastics and designed for lower energy consumption, in line with the growing global eco-consciousness.
Browse Full Report : https://www.globalinsightservices.com/reports/household-vacuum-cleaners-market/
Scope of the Report
This comprehensive study covers every crucial aspect of the household vacuum cleaners market, including detailed forecasts, competitive landscape evaluations, market drivers, restraints, opportunities, and segmentation analysis by type, product, technology, component, application, and installation mode. It provides both a global and localized view, analyzing consumer behavior, regulatory impacts, and regional performance metrics. By examining cross-segmental synergies and supply-demand dynamics, the report helps businesses strategize for growth, optimize operations, and capture emerging opportunities. With a sharp focus on trends like smart home integration, sustainability, and e-commerce expansion, the report positions stakeholders to navigate the market’s evolving landscape successfully.
Discover Additional Market Insights from Global Insight Services :
Mobile Mass Spectrometers Market : https://www.globalinsightservices.com/reports/mobile-mass-spectrometers-market/
Distributed Antenna System (DAS) Market : https://www.globalinsightservices.com/reports/distributed-antenna-system-das-market/
Immersion Cooling Fluids Market : https://www.globalinsightservices.com/reports/immersion-cooling-fluids-market/
Weather Monitoring System Market : https://www.globalinsightservices.com/reports/weather-monitoring-system-market/
Corrosion Under Insulation Monitoring Market : https://www.globalinsightservices.com/reports/corrosion-under-insulation-monitoring-market/
#householdvacuumcleaners #vacuumcleaners #homeappliances #smarthome #roboticvacuum #cordlessvacuum #homecleaning #cleantech #cleaninggadgets #vacuumtechnology #vacuumtrends #robotvacuum #smarthomedevices #techinnovation #householdtech #dysonvacuum #irobot #sharkninja #ecofriendlyproducts #sustainability #energyinnovation #householdappliances #vacuumindustry #markettrends #techtrends #homeautomation #vacuumshopping #cleanhome #urbanliving #consumertech #cleaningsolutions #ecoappliances #indoorairquality #vacuumreviews #healthyliving #smartvacuum #vacuumbrands #newgadgets #hometech #futureofcleaning
About Us:
Global Insight Services (GIS) is a leading multi-industry market research firm headquartered in Delaware, US. We are committed to providing our clients with highest quality data, analysis, and tools to meet all their market research needs. With GIS, you can be assured of the quality of the deliverables, robust & transparent research methodology, and superior service.
Contact Us:
Global Insight Services LLC 16192, Coastal Highway, Lewes DE 19958 E-mail: [email protected] Phone: +1–833–761–1700 Website: https://www.globalinsightservices.com/
0 notes
Text
Soda Ash Prices: Market Analysis, Trend, News, Graph and Demand
North America
The U.S. Soda Ash market continued to face downward pricing pressure, driven by ample supply and muted demand across major end-use sectors. Although hurricanes briefly disrupted operations, swift repairs and steady import volumes ensured that production levels remained largely unaffected. Oversupply, combined with weak demand from construction and glass manufacturing, led to a 4.5% decline in prices.
The construction sector showed persistent weakness, evidenced by sluggish housing starts and stalled infrastructure initiatives, which in turn dampened demand for glass��and by extension, Soda Ash. Potential logistical issues, including the threat of port strikes and shifting tariff policies, introduced uncertainty into the market. However, West Coast ports experienced minimal disruption.
While the glass sector—particularly for automotive applications—offered some resilience, it was insufficient to counterbalance broader economic headwinds. A modest uptick in the U.S. Manufacturing PMI pointed to limited industrial recovery but had little impact on reversing the pricing trend. Overall, Soda Ash prices in North America remained under pressure throughout the quarter, weighed down by oversupply, soft demand, and a cautious market outlook.
Get Real time Prices for Soda Ash: https://www.chemanalyst.com/Pricing-data/soda-ash-76
Asia
Asia's Soda Ash market experienced a price decline, primarily due to persistent oversupply and sluggish demand. High production levels ensured consistent availability, but consumption lagged, especially from key sectors like float glass and photovoltaics. Activity in the float glass segment remained subdued, with reduced melting volumes and limited trading, further dampening Soda Ash uptake. Although glass prices edged higher, they failed to spur significant demand.
By December, prices showed signs of stabilization, aided by proactive inventory management and sustained export shipments. However, seasonal slowdowns in construction and a sluggish real estate recovery, particularly in architectural glass, continued to restrain demand. The detergent and chemical sectors maintained moderate purchasing activity, though overall buyer sentiment remained cautious. As the quarter ended, high stock levels and tempered demand created a balanced yet fragile market dynamic. Soda Ash prices trended lower overall during Q4, with a tentative outlook moving into early 2025.
Europe
Soda Ash prices in Europe—particularly in Germany—trended upward, supported by constrained supply, rising production costs, and selective demand recovery. By November, prices had climbed 5.2%, driven by logistical bottlenecks at ports such as Hamburg and broader disruptions in global shipping. Soaring energy prices across Germany, France, and Spain further increased production costs, adding to pricing momentum.
Demand trends were mixed. While construction activity remained sluggish amid economic uncertainty and weak investment, restocking for seasonal needs—especially in the glass packaging sector—boosted Soda Ash consumption. Additionally, a modest recovery in automotive manufacturing and steady demand from industrial users lent further support.
Despite weak export markets and ongoing challenges in construction, Soda Ash prices maintained an upward trajectory, buoyed by tight supply and high input costs. By the end of the quarter, restrained production and cautious purchasing helped balance supply, keeping prices elevated. Overall, the European market closed Q4 2024 with a firm pricing trend, driven by cost pressures and selective demand resilience.
Get Real time Prices for Soda Ash: https://www.chemanalyst.com/Pricing-data/soda-ash-76
Our Blog:
Paints and Coatings Solvents Prices: https://www.chemanalyst.com/Industry-data/paints-and-coatings-solvents-3
Synthetic Rubber Prices: https://www.chemanalyst.com/Industry-data/synthetic-rubber-4
Contact Us:
ChemAnalyst
GmbH - S-01, 2.floor, Subbelrather Straße,
15a Cologne, 50823, Germany
Call: +49-221-6505-8833
Email: [email protected]
Website: https://www.chemanalyst.com
#Soda Ash Database#Soda Ash Price Chart#Soda Ash Trend#Soda Ash Market Price#India#united kingdom#united states#Germany#business#research#chemicals#Technology#Market Research#Canada#Japan#China
0 notes
Text
AI-ing my way into current events:
President Trump recently announced sweeping tariffs under the International Emergency Economic Powers Act (IEEPA). Starting April 5, 2025, a 10% universal tariff will apply to imports from all countries2. Additionally, beginning April 9, reciprocal tariffs ranging from 11% to 50% will target over 50 countries based on trade deficits3. For example, China faces a 34% tariff, while the European Union is subject to 20%3. Goods from Canada and Mexico that comply with USMCA agreements remain duty-free.
The projected effects of President Trump's recent tariff laws: Economists predict a reduction in U.S. GDP by 8% and wages by 7%, with middle-income households potentially facing a $58,000 lifetime loss. The tariffs are expected to generate substantial revenue—over $5.2 trillion over 10 years—but at the cost of economic activity and international trade. Global markets have already reacted negatively, with stock indices experiencing sharp declines. Additionally, the tariffs could disrupt supply chains and increase costs for businesses and consumers.
As for why these laws are easily implemented, they are enacted under the International Emergency Economic Powers Act (IEEPA), which grants the President broad authority to regulate commerce during national emergencies. This legal framework allows for swift action without requiring congressional approval, making it a powerful tool for imposing trade restrictions.
Implications for Philippines:
Economic Growth at Risk: The Philippines faces a 17% tariff on its exports to the U.S., which could reduce its GDP growth by 1.1 percentage points this year2. This poses a challenge to the government's growth target of 6-8% for 2025.
Fiscal Challenges: The Marcos administration may need to increase public spending to cushion the economic impact, potentially widening the fiscal deficit to 5.9% of GDP2. This could strain the country's fiscal position, which is still recovering from the pandemic.
0 notes
Text
RICHMOND
True hope is swift, and flies with swallow’s wings. Kings it makes gods, and meaner creatures kings.
—Shakespeare, Richard III [5.2]
0 notes
Text
Enhancing Road Safety with Nek Insan’s QR Stickers: A Game-Changer in Emergency Response

Road accidents are an unfortunate reality, leading to severe injuries, fatalities, and financial losses. In such critical moments, every second counts, making swift access to essential information a necessity. Nek Insan’s innovative QR stickers provide an efficient solution by ensuring immediate access to emergency contacts, medical details, and legal documentation. These stickers play a pivotal role in reducing delays and improving emergency response, thereby saving lives and streamlining accident management.
Understanding Nek Insan’s QR Stickers
Nek Insan’s QR stickers are uniquely designed digital labels that can be affixed to vehicles, providing a quick and efficient way to access important information. Scanning the QR code with a smartphone directs users to a secure platform that displays vital details such as the vehicle owner’s emergency contacts, medical records, insurance information, and more. This system simplifies communication and accelerates response times during road accidents.
Key Features of Nek Insan’s QR Stickers
These QR stickers come equipped with several features that make them indispensable for road safety:
Easy Scanning: Compatible with all smartphones and QR scanner apps.
Data Privacy: Ensures that personal information is secure and accessible only to authorized individuals.
Photo/Video Documentation: Allows users to capture and upload media evidence of incidents.
Masked Calls: Enables unlimited anonymous calls to emergency contacts, maintaining caller privacy.
Activity Log: Records all scans and interactions for future reference.
How QR Stickers Help in Road Accident Scenarios
4.1. Immediate Access to Emergency Contacts
In an accident, bystanders or emergency responders can instantly access emergency contacts by scanning the QR code. This immediate connection helps notify family members or medical personnel without delay, ensuring timely intervention.
4.2. Quick Reporting of Road Accidents
With a simple QR scan, witnesses can report accidents to the authorities or emergency services, reducing response time and aiding in faster rescue operations.
4.3. Enhanced Privacy and Security
Nek Insan prioritizes user privacy by ensuring personal contact details remain protected. Masked calls and restricted access to sensitive information prevent misuse and maintain confidentiality.
Real-World Examples: Case Studies of Road Accidents
5.1. Case Study 1: The Hit-and-Run Incident
Scenario: A parked vehicle is hit by another car, and the offending driver flees. Solution: A witness scans the QR code, reports the incident, and provides evidence via photo/video uploads. The vehicle owner receives instant notifications, aiding in police and insurance claims.
5.2. Case Study 2: The Medical Emergency
Scenario: A driver experiences a sudden medical issue and loses control. Solution: A passerby scans the QR sticker, accesses emergency contacts, and notifies medical responders. The stored medical history helps doctors provide immediate, informed care.
5.3. Case Study 3: Wrong Parking Alert
Scenario: A vehicle is improperly parked, causing inconvenience. Solution: Another driver scans the QR sticker and sends an anonymous alert to the vehicle owner, prompting immediate resolution and avoiding potential conflicts or fines.
Personal Experience: How Nek Insan’s QR Sticker Helped in a Road Accident
During a family trip, our car was involved in a minor accident. A passerby used the QR sticker to alert my emergency contacts and send real-time location updates. The prompt response enabled timely medical assistance and roadside support, making a stressful situation manageable.
FAQs About Nek Insan’s QR Stickers in Road Accidents
Q: How easy is it to install these QR stickers? A: They can be affixed to any vehicle surface and require no technical knowledge.
Q: How do QR stickers protect privacy? A: Personal data is securely stored and only accessible to authorized individuals.
Q: Can anyone scan the QR code in an emergency? A: Yes, but sensitive data is encrypted and only shared with designated contacts.
Conclusion: The Future of Road Safety with Nek Insan
Nek Insan’s QR stickers are a revolutionary step towards enhancing road safety. By providing quick access to crucial data, they enable faster emergency response, ensuring better accident management and potentially saving lives. As technology continues to evolve, such innovations will play an even greater role in creating safer roads for everyone. Investing in these smart stickers today can be a game-changer for a more secure and efficient road safety system
0 notes
Text
Brazil, Indonesia, and South Africa: The New Frontiers for Davit System Market Players

Brazil, Indonesia, and South Africa are the fastest growing demand hubs within the $628.7 million Davit System market and expected to grow with a CAGR range of 3.4% and 5% for the period of 2025 to 2030. Marine and offshore loading operations and emergency and rescue are major application areas for Davit System and market competition is fierce in these applications. The davit systems adaptability and usefulness shine in emergency and rescue scenarios where a swift release davit system is often utilized for deployment and retrieval of lifeboats and rescue crafts during critical situations. Harding Safety and Effer are leading companies in this field known for their efficient davit systems that have set a benchmark, for quality and performance.
Leading players in such as Crosby Group Inc., Thern Inc., Vestil Manufacturing Co., Euroload Limited, OZ Lifting, Tractel, Fordia, Pelloby Ltd., GHS HydroSwing, Proserv Offshore, DSM Offshore and Shaw Development LLC. are pushing the boundaries of innovation and forging strategic partnerships to capture larger market share.
Check detailed insights here - https://datastringconsulting.com/industry-analysis/davit-system-market-research-report
The Davit System sector is also impacted by the shift towards automation and digitalization seen across industries worldwide. The integration of automated and remotely operated davit systems is bringing about changes, in the field. An example of this can be observed in theindustry'sgrowing use of automated davit systems to enhance safety and productivity. This shift has led to emergency responses, reduced operational expenses and improved overall effectiveness. By incorporating an automated Davit System into the setup individuals can efficiently manage a range of tasks including initiating launches raising objects and lifting loads using a central control panel. As a result the integration of automation is greatly improving the performance capabilities of the Davit System sector.
Global & Regional Analysis
As per research study, Davit System is expected to rise to $1098.1 million by 2035 from $628.7 million of 2024 with a CAGR of 5.2%. In North America. A market for Davit Systems. The maritime and offshore sectors play a crucial role in driving demand for these systems The need for quality Davit Systems is fueled by growing investments in offshore energy production and strict safety regulations within the industry Companies are increasingly opting for advanced Davit Systems to comply with maritime safety standards and this trend is driving notable growth in the market Specifically industrialized nations such as the United States and Canada are displaying a consistent high demand, for these systems The leading competitors in the region consist of known companies such as Vestavit and Caley Ocean Systems that have solidified their reputation with cutting edge technology and a wide range of products on offer. Despite the competition, in the market space there are still opportunities available especially for Davit Systems integrating smart technologies, which indicates promising growth prospects ahead.
About DataString Consulting
DataString Consulting assist companies in strategy formulations & roadmap creation including TAM expansion, revenue diversification strategies and venturing into new markets; by offering in depth insights into developing trends and competitor landscapes as well as customer demographics. Our customized & direct strategies, filters industry noises into new opportunities; and reduces the effective connect time between products and its market niche.
DataString Consulting is a professional market research company which aims at providing all the market & business research solutions under one roof. Get the right insights for your goals with our unique approach to market research and precisely tailored solutions. We offer services in strategy consulting, comprehensive opportunity assessment across various sectors, and solution-oriented approaches to solve business problems.
0 notes
Text
The Future of Pumps Industry: Trends, Innovations, and Market Growth in 2024 and Beyond
The global pumps industry is experiencing significant growth, driven by rapid industrialization, urbanization, and infrastructure development. According to a report by MarketsandMarkets, the market is projected to expand from USD 61.32 billion in 2024 to USD 79.01 billion by 2029, reflecting a compound annual growth rate (CAGR) of 5.2%.
Key Market Drivers
Industrialization and Urbanization: Emerging economies, particularly in the Asia-Pacific region, are witnessing swift industrial growth and urban expansion. This surge necessitates efficient fluid handling systems across sectors such as water and wastewater treatment, oil and gas, chemicals, and power generation. The development of urban centers and large-scale infrastructure projects further amplifies the demand for advanced pump systems to ensure access to clean water and effective wastewater management.
Technological Advancements: The integration of Internet of Things (IoT) technology into pump systems has led to the emergence of smart pumps. These devices offer enhanced efficiency, predictive maintenance, and real-time monitoring, aligning with the industry’s move towards automation and energy conservation. Such innovations are particularly appealing to industries aiming to optimize operations and reduce energy consumption.
Environmental Regulations and Sustainability: Stringent environmental regulations and a global emphasis on sustainability are compelling industries to adopt energy-efficient and eco-friendly pumping solutions. This trend is driving the development and adoption of pumps that not only meet regulatory standards but also support organizations’ environmental goals.
Download PDF Brochure: https://www.marketsandmarkets.com/pdfdownloadNew.asp?id=29873540
Regional Insights
The Asia-Pacific region holds the largest market share in the global pumps market. This dominance is attributed to rapid industrialization, urbanization, and substantial infrastructure investments in countries like China and India. The region’s focus on sectors such as water treatment, oil and gas, and chemicals further fuels the demand for advanced pumping solutions.
Top Companies in the Pumps Industry
Several key players are shaping the landscape of the pumps industry:
Grundfos Holding A/S
Xylem, KSB Limited
Flowserve Corporation
Sulzer Ltd
Grundfos Holding A/S
Grundfos Holding A/S is a global pump market leader that strongly adheres to the principles of energy efficiency, digitalization, and sustainability in its endeavours. The firm focuses on flexible solutions of innovative water and wastewater solutions, which cater to varied industries including water management, HVAC, industry, and energy. With a strong focus on advance technologies, Grundfos integrates IoT-enabled smart pumping solutions, which enhance the efficiency of the systems while building predictive maintenance capabilities into them, aligning with the increasing demand for energy-efficient solutions in both commercial and industrial sectors. For instance, its focus on strategic reduction of water and energy consumption with long-term investment in R&D and regional market expansion enhances its position as a core pumps company in the competitive modern global market.
Xylem Inc.
Xylem Inc. is one of the worldwide big players in the pumps market, recognized for its innovative water solutions that solve critical water and energy challenges. With a wide ranging product portfolio, Xylem is built on its expertise in providing advanced, energy-efficient pumping systems for industries that involve water utilities, industrial, residential, and commercial sectors. Offering the environment, digital transformation, and smart water management through IoT-enabled pumps and data-driven solutions, the company is capable of leading towards the reduction of water waste and the optimization of energy use. Xylem’s strategic acquisitions, R&D focus, and partnerships increase its competitive advantage by allowing it to expand its market presence globally while growing demand for efficient water management and environmental responsibility.
KSB Limited
KSB Limited is one of the world’s leading producers for high-performance pumps and valves, serving international markets in water, energy, mining, construction, and industrial applications. Being a part of the KSB group, the company sets up lines with the most modern technology and vast experience in engineering to supply energy efficient, reliable pumps specifically according to customer needs. KSB focuses on innovation in fluid handling and sustainable development, which means that IoT and smart pump technology will be implemented to optimize its client’s performance while keeping the operational costs at their lowest. With strategic expansion, strong positioning in customer focus, and a robust and efficient approach, the company can face the increased demands due to increasing competition in the global market.
Ask Sample Pages: https://www.marketsandmarkets.com/requestsampleNew.asp?id=29873540
Future Outlook
The pumps industry is poised for continued growth, driven by the increasing adoption of smart, IoT-enabled, and energy-efficient pumps. As industries advance towards automation and predictive maintenance, the demand for such innovative solutions is expected to rise. Additionally, government initiatives to enhance infrastructure in emerging economies present significant opportunities for market expansion. Industries such as oil and gas, chemicals, and construction are likely to contribute to the growing demand for advanced pumping solutions in the coming years.
0 notes
Text
With compliments from, The Directorate General Public Relations,
Government of the Punjab, Lahore. 99201390.
No.219/QU/Mujahid
HANDOUT (A)
Lahore, Jan 22: The Office of the Ombudsman Punjab has intervened to reclaim 20 kanals and 6 marlas of government land worth over Rs.40 million from illegal occupiers, following swift action on public complaints. Additionally, Rs.5.2 million in pending dues has been disbursed to 41 applicants.
According to details, citizens across Punjab had lodged complaints highlighting illegal encroachments on public land and pathways. Responding to their applications, the Office of the Ombudsman Punjab directed the concerned administration to take legal action and recover the occupied land.
As a result, the encroached land—valued at Rs.40.37 million was recovered. Moreover, 41 other applicants received financial relief, including Rs.930,000 as death and marriage grants, Rs.1.98 million in educational scholarships for 33 individuals and Rs.2.2 million as monthly financial aid for four others.
The applicants have thanked the Office of the Ombudsman Punjab for its proactive role in the resolution of their problems.
0 notes
Text
0 notes
Text
0 notes
Text
Global Wear Parts Market Analysis 2024: Size Forecast and Growth Prospects
The wear parts global market report 2024 from The Business Research Company provides comprehensive market statistics, including global market size, regional shares, competitor market share, detailed segments, trends, and opportunities. This report offers an in-depth analysis of current and future industry scenarios, delivering a complete perspective for thriving in the industrial automation software market.
Wear Parts Market, 2024 report by The Business Research Company offers comprehensive insights into the current state of the market and highlights future growth opportunities.
Market Size - The wear parts market size has grown strongly in recent years. It will grow from $608.92 billion in 2023 to $648.87 billion in 2024 at a compound annual growth rate (CAGR) of 6.5%. The growth in the historic period can be attributed to industrial growth, increased mining and exploration activities, maintenance and replacement cycles, globalization and trade, rising demand for energy.
The wear parts market size is expected to see strong growth in the next few years. It will grow to $796.11 billion in 2028 at a compound annual growth rate (CAGR) of 5.2%. The growth in the forecast period can be attributed to renewable energy expansion, focus on infrastructure renewal, digitalization of supply chains, automation and robotics in manufacturing, rising agricultural mechanization. Major trends in the forecast period include advanced materials and coatings, predictive maintenance solutions, digitalization and industry 4.0 integration, innovations in 3D printing, remote monitoring and iot integration, customization for specific applications.
Order your report now for swift delivery @ https://www.thebusinessresearchcompany.com/report/wear-parts-global-market-report
Scope Of Wear Parts Market The Business Research Company's reports encompass a wide range of information, including:
1. Market Size (Historic and Forecast): Analysis of the market's historical performance and projections for future growth.
2. Drivers: Examination of the key factors propelling market growth.
3. Trends: Identification of emerging trends and patterns shaping the market landscape.
4. Key Segments: Breakdown of the market into its primary segments and their respective performance.
5. Focus Regions and Geographies: Insight into the most critical regions and geographical areas influencing the market.
6. Macro Economic Factors: Assessment of broader economic elements impacting the market.
Wear Parts Market Overview
Market Drivers - A rise in the construction industry is expected to propel the growth of the wear parts market going forward. Construction refers to the process of building, assembling, or putting together structures, facilities, or infrastructure. Wear parts are used in the construction industry to enhance equipment durability, performance, and safety while minimizing downtime and costs and contributing to the overall efficiency and success of construction projects. For instance, in September 2023, according to the United States Census Bureau, a US-based government agency, the value of residential and non-residential construction in the US increased by over 8% between 2020 and 2021. Furthermore, in September 2021, according to reports published by Oxford Economics, a UK-based economic information services company, global construction output in 2020 stood at US$10.7 trillion, and it is projected to experience substantial growth of 42%, adding US$4.5 trillion and reach a total of US$15.2 trillion by the year 2030. Therefore, the rising construction industry is driving the growth of the wear parts market.
Market Trends - Major companies operating in the wear parts market are expanding their wear parts production development, such as by establishing wear parts divisions to manufacture and sell replacement wear parts and provide fast deliveries. The wear parts division is an established business unit dedicated to manufacturing and selling replacement wear parts, such as screws and barrels, for all brands of twin-screw extruders. For instance, in February 2023, ENTEK, a US-based global manufacturing company, launched the Wear Parts Division. This division is dedicated to manufacturing and selling replacement wear parts, such as screws and barrels, for all brands of twin-screw extruders. It was housed in their new 98,000-square-foot manufacturing plant in Henderson, Nevada. ENTEK has invested $15 million in this initiative and has also expanded its manufacturing facility to support increased production of wear parts, twin-screw extruders, and material handling equipment. The new division aims to provide industry-best lead times for the supply of replacement wear parts and is focused on supporting the growth of existing customers while expanding its parts business.
The wear parts market covered in this report is segmented –
1) By Product: Ceramic Wear Parts, Metal Wear Parts, Other Products 2) By Material: Steel, Tungsten Carbide, Ceramics, Polymers 3) By Wearing Mechanism: Abrasive Wear, Fatigue Wear, Adhesive Wear, Corrosion Wear 4) By Application: Mining, Machining & Manufacturing, Construction, Automotive, Aerospace, Chemical & Petrochemical, Other Applications
Get an inside scoop of the wear parts market, Request now for Sample Report @ https://www.thebusinessresearchcompany.com/sample.aspx?id=13954&type=smp
Regional Insights - North America was the largest region in the wear parts market in 2023. Asia-Pacific is expected to be the fastest-growing region in the forecast period. The regions covered in the wear parts market report are Asia-Pacific, Western Europe, Eastern Europe, North America, South America, Middle East, Africa.
Key Companies - Metso Outotec Corporation, Castolin Eutectic, Miller Industries Inc., Berco Mining Products Inc., Magotteaux International S.A., Varel International Energy Services, Hensley Industries Inc., Black Cat Wear Parts Ltd., Columbia Steel Casting Co. Inc., Spokane Industries Inc., Boundary Equipment Co. Ltd., Brunner & Lay Inc., Steel Unlimited Inc., Redexim B.V., Bailey-Parks Urethane Inc., Wabi Iron & Steel Corp., Frictec Ltd., Wear Parts & Equipment Company Inc., QMS Quarry Manufacturing & Supplies Ltd., Whites Wearparts Ltd., Palbit S.A., Wear Parts Services Inc., LSW Wear Parts Ltd., Ballantine Inc., Nanchang Mineral Systems Co. Ltd.
Table of Contents 1. Executive Summary 2. Wear Parts Market Report Structure 3. Wear Parts Market Trends And Strategies 4. Wear Parts Market – Macro Economic Scenario 5. Wear Parts Market Size And Growth ….. 27. Wear Parts Market Competitor Landscape And Company Profiles 28. Key Mergers And Acquisitions 29. Future Outlook and Potential Analysis 30. Appendix
Contact Us: The Business Research Company Europe: +44 207 1930 708 Asia: +91 88972 63534 Americas: +1 315 623 0293 Email: [email protected]
Follow Us On: LinkedIn: https://in.linkedin.com/company/the-business-research-company Twitter: https://twitter.com/tbrc_info Facebook: https://www.facebook.com/TheBusinessResearchCompany YouTube: https://www.youtube.com/channel/UC24_fI0rV8cR5DxlCpgmyFQ Blog: https://blog.tbrc.info/ Healthcare Blog: https://healthcareresearchreports.com/ Global Market Model: https://www.thebusinessresearchcompany.com/global-market-model
0 notes