#Azure SQL Data warehouse
Explore tagged Tumblr posts
Visit Tumblr Blog
Explore Tumblr blogs with no restrictions, modern design and the best experience.
Last Seen Tumblr Blogs


Fun Fact
China blocked Tumblr because of pornography and censorship problems in 2013.
Text
Connection to Azure SQL Database from C#
Prerequisites Before we begin, ensure that you have the following: An Azure Subscription: If you don’t have one, you can create a free account. An Azure SQL Database: Set up a database in Azure and note down your server name (like yourserver.database.windows.net), database name, and the credentials (username and password) used for accessing the database. SQL Server Management Studio (SSMS):…
View On WordPress
0 notes
Text
Power of Data Visualization: A Deep Dive into Microsoft Power BI Services
In today’s data-driven world, the ability to transform raw data into actionable insights is a crucial asset for businesses. As organizations accumulate vast amounts of data from various sources, the challenge lies not just in storing and managing this data but in making sense of it. This is where Microsoft Power BI Services comes into play—a powerful tool designed to bring data to life through intuitive and dynamic visualizations.
What is Microsoft Power BI?
Microsoft Power BI is a suite of business analytics tools that enables organizations to analyze data and share insights. It provides interactive visualizations and business intelligence capabilities with a simple interface, making it accessible to both technical and non-technical users. Whether you are analyzing sales performance, tracking customer behavior, or monitoring operational efficiency, Power BI empowers you to create dashboards and reports that highlight the key metrics driving your business.
Key Features of Microsoft Power BI Services
User-Friendly Interface: One of the standout features of Power BI is its user-friendly interface. Even those with minimal technical expertise can quickly learn to create reports and dashboards. The drag-and-drop functionality allows users to effortlessly build visualizations, while pre-built templates and AI-powered insights help accelerate the decision-making process.
Data Connectivity: Power BI supports a wide range of data sources, including Excel, SQL Server, cloud-based data warehouses, and even social media platforms. This extensive connectivity ensures that users can pull in data from various systems and consolidate it into a single, coherent view. The ability to connect to both on-premises and cloud-based data sources provides flexibility and scalability as your data needs evolve.
Real-Time Analytics: In today’s fast-paced business environment, real-time data is critical. Power BI’s real-time analytics capabilities allow users to monitor data as it’s collected, providing up-to-the-minute insights. Whether tracking website traffic, monitoring social media engagement, or analyzing sales figures, Power BI ensures that you are always equipped with the latest information.
Custom Visualizations: While Power BI comes with a robust library of standard visualizations, it also supports custom visuals. Organizations can create unique visualizations that cater to specific business needs, ensuring that the data is presented in the most effective way possible. These custom visuals can be developed in-house or sourced from the Power BI community, offering endless possibilities for data representation.
Collaboration and Sharing: Collaboration is key to making data-driven decisions. Power BI makes it easy to share insights with colleagues, whether through interactive reports or shared dashboards. Reports can be published to the Power BI service, embedded in websites, or shared via email, ensuring that stakeholders have access to the information they need, when they need it.
Integration with Microsoft Ecosystem: As part of the Microsoft ecosystem, Power BI seamlessly integrates with other Microsoft products like Excel, Azure, and SharePoint. This integration enhances productivity by allowing users to leverage familiar tools and workflows. For example, users can import Excel data directly into Power BI, or embed Power BI reports in SharePoint for easy access.
The Benefits of Microsoft Power BI Services for Businesses
The adoption of Microsoft Power BI Services offers numerous benefits for businesses looking to harness the power of their data:
Enhanced Decision-Making: By providing real-time, data-driven insights, Power BI enables businesses to make informed decisions faster. The ability to visualize data through dashboards and reports ensures that critical information is easily accessible, allowing decision-makers to respond to trends and challenges with agility.
Cost-Effective Solution: Power BI offers a cost-effective solution for businesses of all sizes. With a range of pricing options, including a free version, Power BI is accessible to small businesses and large enterprises alike. The cloud-based service model also reduces the need for expensive hardware and IT infrastructure, making it a scalable option as your business grows.
Improved Data Governance: Data governance is a growing concern for many organizations. Power BI helps address this by providing centralized control over data access and usage. Administrators can set permissions and define data access policies, ensuring that sensitive information is protected and that users only have access to the data they need.
Scalability and Flexibility: As businesses grow and their data needs evolve, Power BI scales effortlessly to accommodate new data sources, users, and reporting requirements. Whether expanding to new markets, launching new products, or adapting to regulatory changes, Power BI provides the flexibility to adapt and thrive in a dynamic business environment.
Streamlined Reporting: Traditional reporting processes can be time-consuming and prone to errors. Power BI automates many of these processes, reducing the time spent on report creation and ensuring accuracy. With Power BI, reports are not only generated faster but are also more insightful, helping businesses to stay ahead of the competition.
Empowering Non-Technical Users: One of Power BI’s greatest strengths is its accessibility. Non-technical users can easily create and share reports without relying on IT departments. This democratization of data empowers teams across the organization to take ownership of their data and contribute to data-driven decision-making.
Use Cases of Microsoft Power BI Services
Power BI’s versatility makes it suitable for a wide range of industries and use cases:
Retail: Retailers use Power BI to analyze sales data, track inventory levels, and understand customer behavior. Real-time dashboards help retail managers make quick decisions on pricing, promotions, and stock replenishment.
Finance: Financial institutions rely on Power BI to monitor key performance indicators (KPIs), analyze risk, and ensure compliance with regulatory requirements. Power BI’s robust data security features make it an ideal choice for handling sensitive financial data.
Healthcare: In healthcare, Power BI is used to track patient outcomes, monitor resource utilization, and analyze population health trends. The ability to visualize complex data sets helps healthcare providers deliver better care and improve operational efficiency.
Manufacturing: Manufacturers leverage Power BI to monitor production processes, optimize supply chains, and manage quality control. Real-time analytics enable manufacturers to identify bottlenecks and make data-driven adjustments on the fly.
Conclusion
In an era where data is a key driver of business success, Microsoft Power BI Services offers a powerful, flexible, and cost-effective solution for transforming raw data into actionable insights. Its user-friendly interface, extensive data connectivity, and real-time analytics capabilities make it an invaluable tool for organizations across industries. By adopting Power BI, businesses can unlock the full potential of their data, making informed decisions that drive growth, efficiency, and innovation.
5 notes
·
View notes
Text
Azure Data Warehouse Migration for AI-Based Healthcare Company
IFI Techsolutions integrated Azure SQL Database migration for a healthcare company in the USA enhancing their scalability, flexibility and operational efficiency.
0 notes
Text
Big Data Analytics: Tools & Career Paths

In this digital era, data is being generated at an unimaginable speed. Social media interactions, online transactions, sensor readings, scientific inquiries-all contribute to an extremely high volume, velocity, and variety of information, synonymously referred to as Big Data. Impossible is a term that does not exist; then, how can we say that we have immense data that remains useless? It is where Big Data Analytics transforms huge volumes of unstructured and semi-structured data into actionable insights that spur decision-making processes, innovation, and growth.
It is roughly implied that Big Data Analytics should remain within the triangle of skills as a widely considered niche; in contrast, nowadays, it amounts to a must-have capability for any working professional across tech and business landscapes, leading to numerous career opportunities.
What Exactly Is Big Data Analytics?
This is the process of examining huge, varied data sets to uncover hidden patterns, customer preferences, market trends, and other useful information. The aim is to enable organizations to make better business decisions. It is different from regular data processing because it uses special tools and techniques that Big Data requires to confront the three Vs:
Volume: Masses of data.
Velocity: Data at high speed of generation and processing.
Variety: From diverse sources and in varying formats (!structured, semi-structured, unstructured).
Key Tools in Big Data Analytics
Having the skills to work with the right tools becomes imperative in mastering Big Data. Here are some of the most famous ones:
Hadoop Ecosystem: The core layer is an open-source framework for storing and processing large datasets across clusters of computers. Key components include:
HDFS (Hadoop Distributed File System): For storing data.
MapReduce: For processing data.
YARN: For resource-management purposes.
Hive, Pig, Sqoop: Higher-level data warehousing and transfer.
Apache Spark: Quite powerful and flexible open-source analytics engine for big data processing. It is much faster than MapReduce, especially for iterative algorithms, hence its popularity in real-time analytics, machine learning, and stream processing. Languages: Scala, Python (PySpark), Java, R.
NoSQL Databases: In contrast to traditional relational databases, NoSQL (Not only SQL) databases are structured to maintain unstructured and semic-structured data at scale. Examples include:
MongoDB: Document-oriented (e.g., for JSON-like data).
Cassandra: Column-oriented (e.g., for high-volume writes).
Neo4j: Graph DB (e.g., for data heavy with relationships).
Data Warehousing & ETL Tools: Tools for extracting, transforming, and loading (ETL) data from various sources into a data warehouse for analysis. Examples: Talend, Informatica. Cloud-based solutions such as AWS Redshift, Google BigQuery, and Azure Synapse Analytics are also greatly used.
Data Visualization Tools: Essential for presenting complex Big Data insights in an understandable and actionable format. Tools like Tableau, Power BI, and Qlik Sense are widely used for creating dashboards and reports.
Programming Languages: Python and R are the dominant languages for data manipulation, statistical analysis, and integrating with Big Data tools. Python's extensive libraries (Pandas, NumPy, Scikit-learn) make it particularly versatile.
Promising Career Paths in Big Data Analytics
As Big Data professionals in India was fast evolving, there were diverse professional roles that were offered with handsome perks:
Big Data Engineer: Designs, builds, and maintains the large-scale data processing systems and infrastructure.
Big Data Analyst: Work on big datasets, finding trends, patterns, and insights that big decisions can be made on.
Data Scientist: Utilize statistics, programming, and domain expertise to create predictive models and glean deep insights from data.
Machine Learning Engineer: Concentrates on the deployment and development of machine learning models on Big Data platforms.
Data Architect: Designs the entire data environment and strategy of an organization.
Launch Your Big Data Analytics Career
Some more Specialized Big Data Analytics course should be taken if you feel very much attracted to data and what it can do. Hence, many computer training institutes in Ahmedabad offer comprehensive courses covering these tools and concepts of Big Data Analytics, usually as a part of Data Science with Python or special training in AI and Machine Learning. Try to find those courses that offer real-time experience and projects along with industry mentoring, so as to help you compete for these much-demanded jobs.
When you are thoroughly trained in the Big Data Analytics tools and concepts, you can manipulate information for innovation and can be highly paid in the working future.
At TCCI, we don't just teach computers — we build careers. Join us and take the first step toward a brighter future.
Location: Bopal & Iskcon-Ambli in Ahmedabad, Gujarat
Call now on +91 9825618292
Visit Our Website: http://tccicomputercoaching.com/
0 notes
Text
Your Data Science Career Roadmap: Navigating the Jobs and Levels

The field of data science is booming, offering a myriad of exciting career opportunities. However, for many, the landscape of job titles and progression paths can seem like a dense forest. Are you a Data Analyst, a Data Scientist, or an ML Engineer? What's the difference, and how do you climb the ladder?
Fear not! This guide will provide a clear roadmap of common data science jobs and their typical progression levels, helping you chart your course in this dynamic domain.
The Core Pillars of a Data Science Career
Before diving into specific roles, it's helpful to understand the three main pillars that define much of the data science ecosystem:
Analytics: Focusing on understanding past and present data to extract insights and inform business decisions.
Science: Focusing on building predictive models, often using machine learning, to forecast future outcomes or automate decisions.
Engineering: Focusing on building and maintaining the infrastructure and pipelines that enable data collection, storage, and processing for analytics and science.
While there's often overlap, many roles lean heavily into one of these areas.
Common Data Science Job Roles and Their Progression
Let's explore the typical roles and their advancement levels:
I. Data Analyst
What they do: The entry point for many into the data world. Data Analysts collect, clean, analyze, and visualize data to answer specific business questions. They often create dashboards and reports to present insights to stakeholders.
Key Skills: SQL, Excel, data visualization tools (Tableau, Power BI), basic statistics, Python/R for data manipulation (Pandas, dplyr).
Levels:
Junior Data Analyst: Focus on data cleaning, basic reporting, and assisting senior analysts.
Data Analyst: Independent analysis, creating comprehensive reports and dashboards, communicating findings.
Senior Data Analyst: Leading analytical projects, mentoring junior analysts, working on more complex business problems.
Progression: Can move into Data Scientist roles (by gaining more ML/statistical modeling skills), Business Intelligence Developer, or Analytics Manager.
II. Data Engineer
What they do: The architects and builders of the data infrastructure. Data Engineers design, construct, and maintain scalable data pipelines, data warehouses, and data lakes. They ensure data is accessible, reliable, and efficient for analysts and scientists.
Key Skills: Strong programming (Python, Java, Scala), SQL, NoSQL databases, ETL tools, cloud platforms (AWS, Azure, GCP), big data technologies (Hadoop, Spark, Kafka).
Levels:
Junior Data Engineer: Assisting in pipeline development, debugging, data ingestion tasks.
Data Engineer: Designing and implementing data pipelines, optimizing data flows, managing data warehousing.
Senior Data Engineer: Leading complex data infrastructure projects, setting best practices, mentoring, architectural design.
Principal Data Engineer / Data Architect: High-level strategic design of data systems, ensuring scalability, security, and performance across the organization.
Progression: Can specialize in Big Data Engineering, Cloud Data Engineering, or move into Data Architect roles.
III. Data Scientist
What they do: The problem-solvers who use advanced statistical methods, machine learning, and programming to build predictive models and derive actionable insights from complex, often unstructured data. They design experiments, evaluate models, and communicate technical findings to non-technical audiences.
Key Skills: Python/R (with advanced libraries like Scikit-learn, TensorFlow, PyTorch), advanced statistics, machine learning algorithms, deep learning (for specialized roles), A/B testing, data modeling, strong communication.
Levels:
Junior Data Scientist: Works on specific model components, assists with data preparation, learns from senior scientists.
Data Scientist: Owns end-to-end model development for defined problems, performs complex analysis, interprets results.
Senior Data Scientist: Leads significant data science initiatives, mentors juniors, contributes to strategic direction, handles ambiguous problems.
Principal Data Scientist / Lead Data Scientist: Drives innovation, sets technical standards, leads cross-functional projects, influences product/business strategy with data insights.
Progression: Can move into Machine Learning Engineer, Research Scientist, Data Science Manager, or even Product Manager (for data products).
IV. Machine Learning Engineer (MLE)
What they do: Bridge the gap between data science models and production systems. MLEs focus on deploying, optimizing, and maintaining machine learning models in real-world applications. They ensure models are scalable, reliable, and perform efficiently in production environments (MLOps).
Key Skills: Strong software engineering principles, MLOps tools (Kubeflow, MLflow), cloud computing, deployment frameworks, understanding of ML algorithms, continuous integration/delivery (CI/CD).
Levels:
Junior ML Engineer: Assists in model deployment, monitoring, and basic optimization.
ML Engineer: Responsible for deploying and maintaining ML models, building robust ML pipelines.
Senior ML Engineer: Leads the productionization of complex ML systems, optimizes for performance and scalability, designs ML infrastructure.
Principal ML Engineer / ML Architect: Defines the ML architecture across the organization, researches cutting-edge deployment strategies, sets MLOps best practices.
Progression: Can specialize in areas like Deep Learning Engineering, NLP Engineering, or move into AI/ML leadership roles.
V. Other Specialized & Leadership Roles
As you gain experience and specialize, other roles emerge:
Research Scientist (AI/ML): Often found in R&D departments or academia, these roles focus on developing novel algorithms and pushing the boundaries of AI/ML. Requires strong theoretical understanding and research skills.
Business Intelligence Developer/Analyst: More focused on reporting, dashboards, and operational insights, often using specific BI tools.
Quantitative Analyst (Quant): Primarily in finance, applying complex mathematical and statistical models for trading, risk management, and financial forecasting.
Data Product Manager: Defines, develops, and launches data-driven products, working at the intersection of business, technology, and data science.
Data Science Manager / Director / VP of Data Science / Chief Data Officer (CDO): Leadership roles that involve managing teams, setting strategy, overseeing data initiatives, and driving the overall data culture of an organization. These roles require strong technical acumen combined with excellent leadership and business communication skills.
Charting Your Own Path
Your data science career roadmap isn't linear, and transitions between roles are common. To advance, consistently focus on:
Continuous Learning: The field evolves rapidly. Stay updated with new tools, techniques, and research.
Building a Portfolio: Showcase your skills through personal projects, Kaggle competitions, and open-source contributions.
Domain Expertise: Understanding the business context where you apply data science makes your work more impactful.
Communication Skills: Being able to clearly explain complex technical concepts to non-technical stakeholders is paramount for leadership.
Networking: Connect with other professionals in the field, learn from their experiences, and explore new opportunities.
Whether you aspire to be a deep-dive researcher, a production-focused engineer, or a strategic leader, the data science landscape offers a fulfilling journey for those willing to learn and adapt. Where do you see yourself on this exciting map?
#data scientist#online course#ai#artificial intelligence#technology#data science#data science course#data science career
0 notes
Text
Integrating Power BI with Existing BI Infrastructure Post-Migration
Successfully completing a Tableau to Power BI migration is a significant milestone—but it’s only the beginning of fully unlocking Power BI’s potential. For many organizations, Power BI must coexist with existing BI infrastructure such as data warehouses, legacy tools, and embedded analytics solutions. A seamless integration strategy ensures business continuity, maximizes return on investment, and accelerates the adoption of Power BI across teams.
Understand Your Existing BI Ecosystem
Before you dive into integrating Power BI, it’s critical to assess the components of your existing BI ecosystem. Many enterprises still rely on traditional SQL-based reporting systems, SAP BusinessObjects, or custom dashboards. Power BI can complement these systems rather than replace them immediately. This hybrid model is particularly important during transition periods, where some departments continue to use Tableau or legacy tools while others move forward with Power BI.
Optimize Data Connectivity
Power BI offers broad data connectivity options—from on-premise databases and Azure services to third-party APIs. Leveraging Power BI Gateway allows secure, real-time access to on-premise data without complex reengineering. Ensure your existing ETL pipelines are compatible or gradually reconfigure them using Power Query for better integration with Power BI’s semantic models.
Using tools like Pulse Convert by OfficeSolution during migration ensures that datasets, relationships, and measures from Tableau are translated accurately to the Power BI environment. This foundation makes it easier to plug Power BI into your existing data flows.
Maintain Governance and Security
Integrating Power BI within an enterprise BI framework requires a robust governance model. Many organizations already have security protocols and access policies tied to legacy tools. With Power BI, use Microsoft Purview, Azure Active Directory, and Row-Level Security (RLS) to enforce similar compliance. Integrate these with your existing governance tools to avoid policy gaps and ensure consistent access control across platforms.
Coexistence Strategy: When Tableau and Power BI Run Together
It’s common for organizations to maintain Tableau for specific use cases while adopting Power BI for broader business intelligence. In such cases, set clear usage guidelines—use Power BI for enterprise-wide dashboards and reporting, while Tableau continues to serve more specialized or departmental analytics.
Encourage interoperability by exporting data models to formats that both platforms can understand. Standardizing data definitions and adopting a centralized metadata repository helps avoid duplication and confusion.
Train Users and Enable Change Management
A successful integration isn’t just technical—it’s cultural. Offer hands-on training sessions, documentation, and support to help users transition and understand how Power BI fits into the broader BI landscape. Power BI’s integration with Microsoft 365 tools such as Excel and Teams can also help increase adoption among non-technical users.
Conclusion
Integrating Power BI with your existing BI infrastructure post-migration is crucial for long-term success. With the right data connectivity, governance, and training strategies, organizations can build a modern, flexible BI ecosystem. OfficeSolution, through tools like Pulse Convert, helps ensure that Power BI becomes a seamless part of your analytics journey. For more insights and resources, visit https://tableautopowerbimigration.com.
0 notes
Text
ERP Software Company in Kochi

Introduction
Kochi, the commercial capital of Kerala, is witnessing a surge in digital transformation across industries such as shipping, IT, tourism, manufacturing, and retail. One of the primary technologies accelerating this change is Enterprise Resource Planning (ERP). This blog explores the growing demand and offerings of ERP software companies in Kochi, the advantages they bring to various sectors, and how businesses can leverage SEO-optimized ERP development services for visibility and growth.
What is ERP Software?
ERP is a centralized business management solution that integrates various core functions—such as finance, human resources, inventory, production, and customer relationship management—into one seamless platform.
Core ERP Modules:
Financial Accounting
Inventory and Warehouse Management
Human Resource Management
Customer Relationship Management (CRM)
Manufacturing and Production Planning
Procurement and Supply Chain Management
Project Management
Business Intelligence & Reporting
Importance of ERP Software in Kochi's Business Landscape
1. Shipping and Logistics
ERP helps in managing fleet operations, cargo tracking, freight billing, and port logistics with real-time data accuracy.
2. Tourism and Hospitality
Enhances booking systems, inventory, guest experiences, HR, and payroll management in resorts and hotels.
3. Manufacturing Units
Supports production scheduling, raw material procurement, quality control, and equipment maintenance.
4. Retail and E-commerce
Provides centralized stock management, real-time sales analytics, and POS system integrations.
5. Healthcare Institutions
Streamlines patient record systems, billing, compliance, and hospital inventory management.
Benefits of ERP Software for Kochi-Based Enterprises
Enhanced Productivity
Centralized Information Access
Improved Financial Control
Efficient Resource Allocation
Regulatory Compliance and Reporting
Custom Dashboard and KPIs Monitoring
Remote and Mobile Access with Cloud ERP
Multi-language and Multi-currency Support
Top ERP Software Companies in Kochi
1. Infopark Solutions Pvt. Ltd.
Specialized in scalable ERP systems for manufacturing and export businesses.
2. KochiSoft ERP Developers
Offers modular and cloud-based ERP with CRM and HR integration.
3. Zerone Technologies
Known for robust and secure ERP software for financial institutions and logistics firms.
4. NavAlt Technologies
Focuses on maritime, marine, and industrial ERP customization.
5. Techno Globe ERP Solutions
Delivers enterprise-grade ERP with IoT, AI, and automation features for large organizations.
Custom ERP Development vs. Ready-Made Software
Feature Custom ERP Ready-Made ERP Personalization Fully customizable Limited customization Cost Higher initial investment Lower upfront cost Integration Seamless with existing tools May require APIs Scalability Highly scalable Depends on vendor Time to Deploy Longer Quicker setup
Technologies Used in ERP Development in Kochi
Languages: Python, Java, PHP, C#
Frameworks: Odoo, SAP, Oracle NetSuite, ASP.NET
Databases: PostgreSQL, MySQL, Oracle, MS SQL
Platforms: AWS, Azure, On-premise Servers
UI/UX: ReactJS, Angular, Bootstrap
Mobile: Flutter, Kotlin, Swift for mobile ERP apps
Industries That Benefit Most from ERP in Kochi
Maritime and Logistics Companies
Coir and Agro-Based Exporters
Rubber and Chemical Manufacturers
Multi-chain Retailers and Wholesalers
Educational Institutes and Universities
Ayurveda and Wellness Centers
Hospitals and Diagnostic Labs
Tourism and Hotel Groups
Future Trends in ERP Development in Kochi
AI-Driven Forecasting and Predictive Analytics
Blockchain in ERP for Transparent Supply Chains
IoT-Integrated Smart Manufacturing ERP
Chatbot Integration and Voice Commands
Augmented Reality (AR) for Real-time Data Visualization
Conclusion
ERP software companies in Kochi are playing a vital role in modernizing business operations, enhancing productivity, and delivering data-driven insights. From SMEs to large-scale industries, ERP adoption is no longer optional but essential. Custom ERP development tailored to local business needs is empowering Kochi-based enterprises to thrive in an increasingly competitive marketplace.
0 notes
Text
Build Your Career with the Best Data Engineering Community Online
In today’s digital-first economy, data engineering is one of the most in-demand and rewarding tech careers. However, mastering this complex and evolving field isn’t just about self-study or online courses. Real growth often happens when you're part of a strong, supportive, and expert-driven community.
That’s exactly what the Big Data Bootcamp Data Engineering Community offers: a thriving ecosystem of professionals, mentors, and learners united by a common goal—to build and elevate careers in data engineering. Whether you’re just starting out or already working in tech, this online community offers the tools, guidance, and connections to help you succeed faster and more confidently.
Let’s explore why joining the right Data Engineering Community is a game-changer, and how Big Data Bootcamp’s platform stands out as the ultimate launchpad for your career in this exciting field.
Why Community Matters in Data Engineering
Learning to become a data engineer is more than following tutorials or earning certifications. The technology stack is wide and deep, involving concepts like distributed systems, data pipelines, cloud platforms, and real-time processing. Keeping up with these tools and practices is easier—and more effective—when you have a network of peers and experts to support you.
A professional community helps by providing:
1. Mentorship and Guidance
Tap into the knowledge of experienced professionals who have walked the path you’re on. Whether you're facing technical challenges or career decisions, mentors can provide direction that accelerates your progress.
2. Collaborative Learning
Communities foster an environment where learning is not just individual but shared. Group projects, open-source contributions, and peer reviews are common in active communities, offering real-world skills you can't gain in isolation.
3. Industry Insights
Staying current in data engineering requires awareness of trends, best practices, and innovations. A connected community can be your real-time feed for what’s happening in the world of big data.
4. Career Opportunities
Networking is one of the fastest ways to land a job in tech. Many community members share job leads, referrals, and insider info that isn't publicly posted.
5. Accountability and Motivation
When you're surrounded by motivated people with similar goals, it keeps you inspired and on track. Sharing progress and celebrating milestones fuels ongoing commitment.
Introducing the Big Data Bootcamp Community
The Big Data Bootcamp Data Engineering Community is more than just a chat group or online forum. It’s an organized, high-impact environment designed to provide real value at every stage of your career journey.
Hosted at BigDataBootcamp.com, the platform combines the best of structured learning, peer support, and professional development. It’s tailored specifically for:
Aspiring data engineers
Bootcamp and college graduates
Career switchers from software development, analytics, or IT
Experienced data professionals looking to level up
Here’s what makes this online community stand out.
What You Get as a Member
1. Access to Expert Mentors
Learn from top-tier professionals who have worked with companies like Google, Amazon, Meta, and cutting-edge startups. These mentors actively guide members through code reviews, project feedback, and one-on-one career advice.
2. Structured Learning Paths
Community members can access exclusive workshops, tutorials, and study groups aligned with in-demand skills like:
Data pipeline design
Apache Spark, Kafka, and Airflow
Cloud data platforms (AWS, GCP, Azure)
Data warehouse tools like Snowflake and BigQuery
Advanced SQL and Python scripting
3. Real-World Projects
Apply your skills in collaborative projects that simulate actual industry challenges. This builds not just your knowledge, but also your portfolio—essential for standing out to employers.
4. Career Acceleration Services
Take advantage of:
Resume and LinkedIn profile reviews
Job interview prep sessions
Access to a private job board
Referrals from alumni and hiring partners
5. Regular Events and Networking
Participate in:
Webinars with industry leaders
AMAs with senior data engineers
Virtual meetups and hackathons
Fireside chats and alumni Q&As
These events keep the community lively and ensure you stay connected with the pulse of the industry.
6. Supportive Peer Network
Exchange ideas, ask questions, and get feedback in a welcoming environment. Whether you’re debugging a pipeline or seeking advice on cloud certification, the community is always there to help.
Proven Success Stories
Here are just a few examples of how the community has changed lives:
Manoj, a mechanical engineer by training, transitioned into a data engineering role at a healthcare company within six months of joining the community.
Ayesha, a computer science graduate, used the community's project-based learning approach to build a portfolio that landed her a job at a fintech startup.
Carlos, an IT administrator, leaned on mentorship and mock interviews to land a role as a data engineer with an international consulting firm.
These success stories aren't exceptions—they're examples of what's possible when you're part of the right support system.
Why Choose Big Data Bootcamp Over Other Communities?
While other online tech communities exist, few offer the blend of quality, focus, and career alignment found at Big Data Bootcamp. Here’s why it stands out:
Focused on Data Engineering – It’s not a generic tech group. It’s built specifically for those in data engineering.
Built by Practitioners – Content and mentorship come from people doing the work, not just teaching it.
Job-Oriented – Everything is aligned with real job requirements and employer expectations.
Inclusive and Supportive – Whether you're just beginning or well into your career, there's a place for you.
Live Interaction – From live workshops to mentor check-ins, it's a dynamic experience, not a passive one.
How to Join
Becoming part of the Big Data Bootcamp Community is simple:
Visit BigDataBootcamp.com
Explore bootcamp offerings and apply for membership
Choose your learning path and start attending community events
Introduce yourself and start engaging
Membership includes lifetime access to the community, learning content, events, and ongoing support.
Final Thoughts
If you're serious about becoming a high-performing data engineer, you need more than just courses or textbooks. You need real connections, honest guidance, and a community that pushes you to grow.
At Big Data Bootcamp, the online data engineering community is built to do just that. It’s where careers are born, skills are refined, and goals are achieved.
Join us today and start building your future with the best data engineering community on the internet.
The tech world moves fast. Move faster with the right people by your side.
0 notes
Text
Unlocking the Power of Delta Live Tables in Data bricks with Kadel Labs
Introduction
In the rapidly evolving landscape of big data and analytics, businesses are constantly seeking ways to streamline data processing, ensure data reliability, and improve real-time analytics. One of the most powerful solutions available today is Delta Live Tables (DLT) in Databricks. This cutting-edge feature simplifies data engineering and ensures efficiency in data pipelines.
Kadel Labs, a leader in digital transformation and data engineering solutions, leverages Delta Live Tables to optimize data workflows, ensuring businesses can harness the full potential of their data. In this article, we will explore what Delta Live Tables are, how they function in Databricks, and how Kadel Labs integrates this technology to drive innovation.
Understanding Delta Live Tables
What Are Delta Live Tables?
Delta Live Tables (DLT) is an advanced framework within Databricks that simplifies the process of building and maintaining reliable ETL (Extract, Transform, Load) pipelines. With DLT, data engineers can define incremental data processing pipelines using SQL or Python, ensuring efficient data ingestion, transformation, and management.
Key Features of Delta Live Tables
Automated Pipeline Management
DLT automatically tracks changes in source data, eliminating the need for manual intervention.
Data Reliability and Quality
Built-in data quality enforcement ensures data consistency and correctness.
Incremental Processing
Instead of processing entire datasets, DLT processes only new data, improving efficiency.
Integration with Delta Lake
DLT is built on Delta Lake, ensuring ACID transactions and versioned data storage.
Monitoring and Observability
With automatic lineage tracking, businesses gain better insights into data transformations.
How Delta Live Tables Work in Databricks
Databricks, a unified data analytics platform, integrates Delta Live Tables to streamline data lake house architectures. Using DLT, businesses can create declarative ETL pipelines that are easy to maintain and highly scalable.
The DLT Workflow
Define a Table and Pipeline
Data engineers specify data sources, transformation logic, and the target Delta table.
Data Ingestion and Transformation
DLT automatically ingests raw data and applies transformation logic in real-time.
Validation and Quality Checks
DLT enforces data quality rules, ensuring only clean and accurate data is processed.
Automatic Processing and Scaling
Databricks dynamically scales resources to handle varying data loads efficiently.
Continuous or Triggered Execution
DLT pipelines can run continuously or be triggered on-demand based on business needs.
Kadel Labs: Enhancing Data Pipelines with Delta Live Tables
As a digital transformation company, Kadel Labs specializes in deploying cutting-edge data engineering solutions that drive business intelligence and operational efficiency. The integration of Delta Live Tables in Databricks is a game-changer for organizations looking to automate, optimize, and scale their data operations.
How Kadel Labs Uses Delta Live Tables
Real-Time Data Streaming
Kadel Labs implements DLT-powered streaming pipelines for real-time analytics and decision-making.
Data Governance and Compliance
By leveraging DLT’s built-in monitoring and validation, Kadel Labs ensures regulatory compliance.
Optimized Data Warehousing
DLT enables businesses to build cost-effective data warehouses with improved data integrity.
Seamless Cloud Integration
Kadel Labs integrates DLT with cloud environments (AWS, Azure, GCP) to enhance scalability.
Business Intelligence and AI Readiness
DLT transforms raw data into structured datasets, fueling AI and ML models for predictive analytics.
Benefits of Using Delta Live Tables in Databricks
1. Simplified ETL Development
With DLT, data engineers spend less time managing complex ETL processes and more time focusing on insights.
2. Improved Data Accuracy and Consistency
DLT automatically enforces quality checks, reducing errors and ensuring data accuracy.
3. Increased Operational Efficiency
DLT pipelines self-optimize, reducing manual workload and infrastructure costs.
4. Scalability for Big Data
DLT seamlessly scales based on workload demands, making it ideal for high-volume data processing.
5. Better Insights with Lineage Tracking
Data lineage tracking in DLT provides full visibility into data transformations and dependencies.
Real-World Use Cases of Delta Live Tables with Kadel Labs
1. Retail Analytics and Customer Insights
Kadel Labs helps retailers use Delta Live Tables to analyze customer behavior, sales trends, and inventory forecasting.
2. Financial Fraud Detection
By implementing DLT-powered machine learning models, Kadel Labs helps financial institutions detect fraudulent transactions.
3. Healthcare Data Management
Kadel Labs leverages DLT in Databricks to improve patient data analysis, claims processing, and medical research.
4. IoT Data Processing
For smart devices and IoT applications, DLT enables real-time sensor data processing and predictive maintenance.
Conclusion
Delta Live Tables in Databricks is transforming the way businesses handle data ingestion, transformation, and analytics. By partnering with Kadel Labs, companies can leverage DLT to automate pipelines, improve data quality, and gain actionable insights.
With its expertise in data engineering, Kadel Labs empowers businesses to unlock the full potential of Databricks and Delta Live Tables, ensuring scalable, efficient, and reliable data solutions for the future.
For businesses looking to modernize their data architecture, now is the time to explore Delta Live Tables with Kadel Labs!
0 notes
Text
Data Engineer vs Data Analyst vs Data Scientist vs ML Engineer: Choose Your Perfect Data Career!
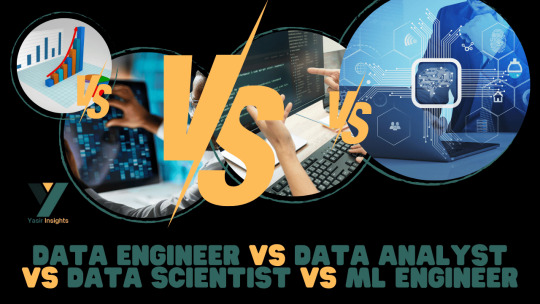
In today’s rapidly evolving tech world, career opportunities in data-related fields are expanding like never before. However, with multiple roles like Data Engineer vs Data Analyst vs Data Scientist vs ML Engineer, newcomers — and even seasoned professionals — often find it confusing to understand how these roles differ.
At Yasir Insights, we think that having clarity makes professional selections more intelligent. We’ll go over the particular duties, necessary abilities, and important differences between these well-liked Data Engineer vs Data Analyst vs Data Scientist vs ML Engineer data positions in this blog.
Also Read: Data Engineer vs Data Analyst vs Data Scientist vs ML Engineer
Introduction to Data Engineer vs Data Analyst vs Data Scientist vs ML Engineer
The Data Science and Machine Learning Development Lifecycle (MLDLC) includes stages like planning, data gathering, preprocessing, exploratory analysis, modelling, deployment, and optimisation. In order to effectively manage these intricate phases, the burden is distributed among specialised positions, each of which plays a vital part in the project’s success.
Data Engineer
Who is a Data Engineer?
The basis of the data ecosystem is built by data engineers. They concentrate on collecting, sanitising, and getting data ready for modelling or further analysis. Think of them as mining precious raw materials — in this case, data — from complex and diverse sources.
Key Responsibilities:
Collect and extract data from different sources (APIS, databases, web scraping).
Design and maintain scalable data pipelines.
Clean, transform, and store data in warehouses or lakes.
Optimise database performance and security.
Required Skills:
Strong knowledge of Data Structures and Algorithms.
Expertise in Database Management Systems (DBMS).
Familiarity with Big Data tools (like Hadoop, Spark).
Hands-on experience with cloud platforms (AWS, Azure, GCP).
Proficiency in building and managing ETL (Extract, Transform, Load) pipelines.
Data Analyst
Who is a Data Analyst?
Data analysts take over once the data has been cleansed and arranged. Their primary responsibility is to evaluate data in order to get valuable business insights. They provide answers to important concerns regarding the past and its causes.
Key Responsibilities:
Perform Exploratory Data Analysis (EDA).
Create visualisations and dashboards to represent insights.
Identify patterns, trends, and correlations in datasets.
Provide reports to support data-driven decision-making.
Required Skills:
Strong Statistical knowledge.
Proficiency in programming languages like Python or R.
Expertise in Data Visualisation tools (Tableau, Power BI, matplotlib).
Excellent communication skills to present findings clearly.
Experience working with SQL databases.
Data Scientist
Who is a Data Scientist?
Data Scientists build upon the work of Data Analysts by developing predictive models and machine learning algorithms. While analysts focus on the “what” and “why,” Data Scientists focus on the “what’s next.”
Key Responsibilities:
Design and implement Machine Learning models.
Perform hypothesis testing, A/B testing, and predictive analytics.
Derive strategic insights for product improvements and new innovations.
Communicate technical findings to stakeholders.
Required Skills:
Mastery of Statistics and Probability.
Strong programming skills (Python, R, SQL).
Deep understanding of Machine Learning algorithms.
Ability to handle large datasets using Big Data technologies.
Critical thinking and problem-solving abilities.
Machine Learning Engineer
Who is a Machine Learning Engineer?
Machine Learning Engineers (MLES) take the models developed by Data Scientists and make them production-ready. They ensure models are deployed, scalable, monitored, and maintained effectively in real-world systems.
Key Responsibilities:
Deploy machine learning models into production environments.
Optimise and scale ML models for performance and efficiency.
Continuously monitor and retrain models based on real-time data.
Collaborate with software engineers and data scientists for integration.
Required Skills:
Strong foundations in Linear Algebra, Calculus, and Probability.
Mastery of Machine Learning frameworks (TensorFlow, PyTorch, Scikit-learn).
Proficiency in programming languages (Python, Java, Scala).
Knowledge of Distributed Systems and Software Engineering principles.
Familiarity with MLOps tools for automation and monitoring.
Summary: Data Engineer vs Data Analyst vs Data Scientist vs ML Engineer
Data Engineer
Focus Area: Data Collection & Processing
Key Skills: DBMS, Big Data, Cloud Computing
Objective: Build and maintain data infrastructure
Data Analyst
Focus Area: Data Interpretation & Reporting
Key Skills: Statistics, Python/R, Visualisation Tools
Objective: Analyse data and extract insights
Data Scientist
Focus Area: Predictive Modelling
Key Skills: Machine Learning, Statistics, Data Analysis
Objective: Build predictive models and strategies
Machine Learning Engineer
Focus Area: Model Deployment & Optimisation
Key Skills: ML Frameworks, Software Engineering
Objective: Deploy and optimise ML models in production
Frequently Asked Questions (FAQS)
Q1: Can a Data Engineer become a Data Scientist?
Yes! With additional skills in machine learning, statistics, and model building, a Data Engineer can transition into a Data Scientist role.
Q2: Is coding necessary for Data Analysts?
While deep coding isn’t mandatory, familiarity with SQL, Python, or R greatly enhances a Data Analyst’s effectiveness.
Q3: What is the difference between a Data Scientist and an ML Engineer?
Data Scientists focus more on model development and experimentation, while ML Engineers focus on deploying and scaling those models.
Q4: Which role is the best for beginners?
If you love problem-solving and analysis, start as a Data Analyst. If you enjoy coding and systems, a Data Engineer might be your path.
Published By:
Mirza Yasir Abdullah Baig
Repost This Article and built Your Connection With Others
0 notes
Text
Snowflake vs Redshift vs BigQuery vs Databricks: A Detailed Comparison
In the world of cloud-based data warehousing and analytics, organizations are increasingly relying on advanced platforms to manage their massive datasets. Four of the most popular options available today are Snowflake, Amazon Redshift, Google BigQuery, and Databricks. Each offers unique features, benefits, and challenges for different types of organizations, depending on their size, industry, and data needs. In this article, we will explore these platforms in detail, comparing their performance, scalability, ease of use, and specific use cases to help you make an informed decision.
What Are Snowflake, Redshift, BigQuery, and Databricks?
Snowflake: A cloud-based data warehousing platform known for its unique architecture that separates storage from compute. It’s designed for high performance and ease of use, offering scalability without complex infrastructure management.
Amazon Redshift: Amazon’s managed data warehouse service that allows users to run complex queries on massive datasets. Redshift integrates tightly with AWS services and is optimized for speed and efficiency in the AWS ecosystem.
Google BigQuery: A fully managed and serverless data warehouse provided by Google Cloud. BigQuery is known for its scalable performance and cost-effectiveness, especially for large, analytic workloads that require SQL-based queries.
Databricks: More than just a data warehouse, Databricks is a unified data analytics platform built on Apache Spark. It focuses on big data processing and machine learning workflows, providing an environment for collaborative data science and engineering teams.
Snowflake Overview
Snowflake is built for cloud environments and uses a hybrid architecture that separates compute, storage, and services. This unique architecture allows for efficient scaling and the ability to run independent workloads simultaneously, making it an excellent choice for enterprises that need flexibility and high performance without managing infrastructure.
Key Features:
Data Sharing: Snowflake’s data sharing capabilities allow users to share data across different organizations without the need for data movement or transformation.
Zero Management: Snowflake handles most administrative tasks, such as scaling, optimization, and tuning, so teams can focus on analyzing data.
Multi-Cloud Support: Snowflake runs on AWS, Google Cloud, and Azure, giving users flexibility in choosing their cloud provider.
Real-World Use Case:
A global retail company uses Snowflake to aggregate sales data from various regions, optimizing its supply chain and inventory management processes. By leveraging Snowflake’s data sharing capabilities, the company shares real-time sales data with external partners, improving forecasting accuracy.
Amazon Redshift Overview
Amazon Redshift is a fully managed, petabyte-scale data warehouse solution in the cloud. It is optimized for high-performance querying and is closely integrated with other AWS services, such as S3, making it a top choice for organizations that already use the AWS ecosystem.
Key Features:
Columnar Storage: Redshift stores data in a columnar format, which makes querying large datasets more efficient by minimizing disk I/O.
Integration with AWS: Redshift works seamlessly with other AWS services, such as Amazon S3, Amazon EMR, and AWS Glue, to provide a comprehensive solution for data management.
Concurrency Scaling: Redshift automatically adds additional resources when needed to handle large numbers of concurrent queries.
Real-World Use Case:
A financial services company leverages Redshift for data analysis and reporting, analyzing millions of transactions daily. By integrating Redshift with AWS Glue, the company has built an automated ETL pipeline that loads new transaction data from Amazon S3 for analysis in near-real-time.
Google BigQuery Overview
BigQuery is a fully managed, serverless data warehouse that excels in handling large-scale, complex data analysis workloads. It allows users to run SQL queries on massive datasets without worrying about the underlying infrastructure. BigQuery is particularly known for its cost efficiency, as it charges based on the amount of data processed rather than the resources used.
Key Features:
Serverless Architecture: BigQuery automatically handles all infrastructure management, allowing users to focus purely on querying and analyzing data.
Real-Time Analytics: It supports real-time analytics, enabling businesses to make data-driven decisions quickly.
Cost Efficiency: With its pay-per-query model, BigQuery is highly cost-effective, especially for organizations with varying data processing needs.
Real-World Use Case:
A digital marketing agency uses BigQuery to analyze massive amounts of user behavior data from its advertising campaigns. By integrating BigQuery with Google Analytics and Google Ads, the agency is able to optimize its ad spend and refine targeting strategies.
Databricks Overview
Databricks is a unified analytics platform built on Apache Spark, making it ideal for data engineering, data science, and machine learning workflows. Unlike traditional data warehouses, Databricks combines data lakes, warehouses, and machine learning into a single platform, making it suitable for advanced analytics.
Key Features:
Unified Analytics Platform: Databricks combines data engineering, data science, and machine learning workflows into a single platform.
Built on Apache Spark: Databricks provides a fast, scalable environment for big data processing using Spark’s distributed computing capabilities.
Collaboration: Databricks provides collaborative notebooks that allow data scientists, analysts, and engineers to work together on the same project.
Real-World Use Case:
A healthcare provider uses Databricks to process patient data in real-time and apply machine learning models to predict patient outcomes. The platform enables collaboration between data scientists and engineers, allowing the team to deploy predictive models that improve patient care.

People Also Ask
1. Which is better for data warehousing: Snowflake or Redshift?
Both Snowflake and Redshift are excellent for data warehousing, but the best option depends on your existing ecosystem. Snowflake’s multi-cloud support and unique architecture make it a better choice for enterprises that need flexibility and easy scaling. Redshift, however, is ideal for organizations already using AWS, as it integrates seamlessly with AWS services.
2. Can BigQuery handle real-time data?
Yes, BigQuery is capable of handling real-time data through its streaming API. This makes it an excellent choice for organizations that need to analyze data as it’s generated, such as in IoT or e-commerce environments where real-time decision-making is critical.
3. What is the primary difference between Databricks and Snowflake?
Databricks is a unified platform for data engineering, data science, and machine learning, focusing on big data processing using Apache Spark. Snowflake, on the other hand, is a cloud data warehouse optimized for SQL-based analytics. If your organization requires machine learning workflows and big data processing, Databricks may be the better option.
Conclusion
When choosing between Snowflake, Redshift, BigQuery, and Databricks, it's essential to consider the specific needs of your organization. Snowflake is a flexible, high-performance cloud data warehouse, making it ideal for enterprises that need a multi-cloud solution. Redshift, best suited for those already invested in the AWS ecosystem, offers strong performance for large datasets. BigQuery excels in cost-effective, serverless analytics, particularly in the Google Cloud environment. Databricks shines for companies focused on big data processing, machine learning, and collaborative data science workflows.
The future of data analytics and warehousing will likely see further integration of AI and machine learning capabilities, with platforms like Databricks leading the way in this area. However, the best choice for your organization depends on your existing infrastructure, budget, and long-term data strategy.
1 note
·
View note
Text
The top Data Engineering trends to look for in 2025
Data engineering is the unsung hero of our data-driven world. It's the critical discipline that builds and maintains the robust infrastructure enabling organizations to collect, store, process, and analyze vast amounts of data. As we navigate mid-2025, this foundational field is evolving at an unprecedented pace, driven by the exponential growth of data, the insatiable demand for real-time insights, and the transformative power of AI.
Staying ahead of these shifts is no longer optional; it's essential for data engineers and the organizations they support. Let's dive into the key data engineering trends that are defining the landscape in 2025.
1. The Dominance of the Data Lakehouse
What it is: The data lakehouse architecture continues its strong upward trajectory, aiming to unify the best features of data lakes (flexible, low-cost storage for raw, diverse data types) and data warehouses (structured data management, ACID transactions, and robust governance). Why it's significant: It offers a single platform for various analytics workloads, from BI and reporting to AI and machine learning, reducing data silos, complexity, and redundancy. Open table formats like Apache Iceberg, Delta Lake, and Hudi are pivotal in enabling lakehouse capabilities. Impact: Greater data accessibility, improved data quality and reliability for analytics, simplified data architecture, and cost efficiencies. Key Technologies: Databricks, Snowflake, Amazon S3, Azure Data Lake Storage, Apache Spark, and open table formats.
2. AI-Powered Data Engineering (Including Generative AI)
What it is: Artificial intelligence, and increasingly Generative AI, are becoming integral to data engineering itself. This involves using AI/ML to automate and optimize various data engineering tasks. Why it's significant: AI can significantly boost efficiency, reduce manual effort, improve data quality, and even help generate code for data pipelines or transformations. Impact: * Automated Data Integration & Transformation: AI tools can now automate aspects of data mapping, cleansing, and pipeline optimization. * Intelligent Data Quality & Anomaly Detection: ML algorithms can proactively identify and flag data quality issues or anomalies in pipelines. * Optimized Pipeline Performance: AI can help in tuning and optimizing the performance of data workflows. * Generative AI for Code & Documentation: LLMs are being used to assist in writing SQL queries, Python scripts for ETL, and auto-generating documentation. Key Technologies: AI-driven ETL/ELT tools, MLOps frameworks integrated with DataOps, platforms with built-in AI capabilities (e.g., Databricks AI Functions, AWS DMS with GenAI).
3. Real-Time Data Processing & Streaming Analytics as the Norm
What it is: The demand for immediate insights and actions based on live data streams continues to grow. Batch processing is no longer sufficient for many use cases. Why it's significant: Businesses across industries like e-commerce, finance, IoT, and logistics require real-time capabilities for fraud detection, personalized recommendations, operational monitoring, and instant decision-making. Impact: A shift towards streaming architectures, event-driven data pipelines, and tools that can handle high-throughput, low-latency data. Key Technologies: Apache Kafka, Apache Flink, Apache Spark Streaming, Apache Pulsar, cloud-native streaming services (e.g., Amazon Kinesis, Google Cloud Dataflow, Azure Stream Analytics), and real-time analytical databases.
4. The Rise of Data Mesh & Data Fabric Architectures
What it is: * Data Mesh: A decentralized sociotechnical approach that emphasizes domain-oriented data ownership, treating data as a product, self-serve data infrastructure, and federated computational governance. * Data Fabric: An architectural approach that automates data integration and delivery across disparate data sources, often using metadata and AI to provide a unified view and access to data regardless of where it resides. Why it's significant: Traditional centralized data architectures struggle with the scale and complexity of modern data. These approaches offer greater agility, scalability, and empower domain teams. Impact: Improved data accessibility and discoverability, faster time-to-insight for domain teams, reduced bottlenecks for central data teams, and better alignment of data with business domains. Key Technologies: Data catalogs, data virtualization tools, API-based data access, and platforms supporting decentralized data management.
5. Enhanced Focus on Data Observability & Governance
What it is: * Data Observability: Going beyond traditional monitoring to provide deep visibility into the health and state of data and data pipelines. It involves tracking data lineage, quality, freshness, schema changes, and distribution. * Data Governance by Design: Integrating robust data governance, security, and compliance practices directly into the data lifecycle and infrastructure from the outset, rather than as an afterthought. Why it's significant: As data volumes and complexity grow, ensuring data quality, reliability, and compliance (e.g., GDPR, CCPA) becomes paramount for building trust and making sound decisions. Regulatory landscapes, like the EU AI Act, are also making strong governance non-negotiable. Impact: Improved data trust and reliability, faster incident resolution, better compliance, and more secure data handling. Key Technologies: AI-powered data observability platforms, data cataloging tools with governance features, automated data quality frameworks, and tools supporting data lineage.
6. Maturation of DataOps and MLOps Practices
What it is: * DataOps: Applying Agile and DevOps principles (automation, collaboration, continuous integration/continuous delivery - CI/CD) to the entire data analytics lifecycle, from data ingestion to insight delivery. * MLOps: Extending DevOps principles specifically to the machine learning lifecycle, focusing on streamlining model development, deployment, monitoring, and retraining. Why it's significant: These practices are crucial for improving the speed, quality, reliability, and efficiency of data and machine learning pipelines. Impact: Faster delivery of data products and ML models, improved data quality, enhanced collaboration between data engineers, data scientists, and IT operations, and more reliable production systems. Key Technologies: Workflow orchestration tools (e.g., Apache Airflow, Kestra), CI/CD tools (e.g., Jenkins, GitLab CI), version control systems (Git), containerization (Docker, Kubernetes), and MLOps platforms (e.g., MLflow, Kubeflow, SageMaker, Azure ML).
The Cross-Cutting Theme: Cloud-Native and Cost Optimization
Underpinning many of these trends is the continued dominance of cloud-native data engineering. Cloud platforms (AWS, Azure, GCP) provide the scalable, flexible, and managed services that are essential for modern data infrastructure. Coupled with this is an increasing focus on cloud cost optimization (FinOps for data), as organizations strive to manage and reduce the expenses associated with large-scale data processing and storage in the cloud.
The Evolving Role of the Data Engineer
These trends are reshaping the role of the data engineer. Beyond building pipelines, data engineers in 2025 are increasingly becoming architects of more intelligent, automated, and governed data systems. Skills in AI/ML, cloud platforms, real-time processing, and distributed architectures are becoming even more crucial.
Global Relevance, Local Impact
These global data engineering trends are particularly critical for rapidly developing digital economies. In countries like India, where the data explosion is immense and the drive for digital transformation is strong, adopting these advanced data engineering practices is key to harnessing data for innovation, improving operational efficiency, and building competitive advantages on a global scale.
Conclusion: Building the Future, One Pipeline at a Time
The field of data engineering is more dynamic and critical than ever. The trends of 2025 point towards more automated, real-time, governed, and AI-augmented data infrastructures. For data engineering professionals and the organizations they serve, embracing these changes means not just keeping pace, but actively shaping the future of how data powers our world.
1 note
·
View note
Text
Exploring the Role of Azure Data Factory in Hybrid Cloud Data Integration

Introduction
In today’s digital landscape, organizations increasingly rely on hybrid cloud environments to manage their data. A hybrid cloud setup combines on-premises data sources, private clouds, and public cloud platforms like Azure, AWS, or Google Cloud. Managing and integrating data across these diverse environments can be complex.
This is where Azure Data Factory (ADF) plays a crucial role. ADF is a cloud-based data integration service that enables seamless movement, transformation, and orchestration of data across hybrid cloud environments.
In this blog, we’ll explore how Azure Data Factory simplifies hybrid cloud data integration, key use cases, and best practices for implementation.
1. What is Hybrid Cloud Data Integration?
Hybrid cloud data integration is the process of connecting, transforming, and synchronizing data between: ✅ On-premises data sources (e.g., SQL Server, Oracle, SAP) ✅ Cloud storage (e.g., Azure Blob Storage, Amazon S3) ✅ Databases and data warehouses (e.g., Azure SQL Database, Snowflake, BigQuery) ✅ Software-as-a-Service (SaaS) applications (e.g., Salesforce, Dynamics 365)
The goal is to create a unified data pipeline that enables real-time analytics, reporting, and AI-driven insights while ensuring data security and compliance.
2. Why Use Azure Data Factory for Hybrid Cloud Integration?
Azure Data Factory (ADF) provides a scalable, serverless solution for integrating data across hybrid environments. Some key benefits include:
✅ 1. Seamless Hybrid Connectivity
ADF supports over 90+ data connectors, including on-prem, cloud, and SaaS sources.
It enables secure data movement using Self-Hosted Integration Runtime to access on-premises data sources.
✅ 2. ETL & ELT Capabilities
ADF allows you to design Extract, Transform, and Load (ETL) or Extract, Load, and Transform (ELT) pipelines.
Supports Azure Data Lake, Synapse Analytics, and Power BI for analytics.
✅ 3. Scalability & Performance
Being serverless, ADF automatically scales resources based on data workload.
It supports parallel data processing for better performance.
✅ 4. Low-Code & Code-Based Options
ADF provides a visual pipeline designer for easy drag-and-drop development.
It also supports custom transformations using Azure Functions, Databricks, and SQL scripts.
✅ 5. Security & Compliance
Uses Azure Key Vault for secure credential management.
Supports private endpoints, network security, and role-based access control (RBAC).
Complies with GDPR, HIPAA, and ISO security standards.
3. Key Components of Azure Data Factory for Hybrid Cloud Integration
1️⃣ Linked Services
Acts as a connection between ADF and data sources (e.g., SQL Server, Blob Storage, SFTP).
2️⃣ Integration Runtimes (IR)
Azure-Hosted IR: For cloud data movement.
Self-Hosted IR: For on-premises to cloud integration.
SSIS-IR: To run SQL Server Integration Services (SSIS) packages in ADF.
3️⃣ Data Flows
Mapping Data Flow: No-code transformation engine.
Wrangling Data Flow: Excel-like Power Query transformation.
4️⃣ Pipelines
Orchestrate complex workflows using different activities like copy, transformation, and execution.
5️⃣ Triggers
Automate pipeline execution using schedule-based, event-based, or tumbling window triggers.
4. Common Use Cases of Azure Data Factory in Hybrid Cloud
🔹 1. Migrating On-Premises Data to Azure
Extracts data from SQL Server, Oracle, SAP, and moves it to Azure SQL, Synapse Analytics.
🔹 2. Real-Time Data Synchronization
Syncs on-prem ERP, CRM, or legacy databases with cloud applications.
🔹 3. ETL for Cloud Data Warehousing
Moves structured and unstructured data to Azure Synapse, Snowflake for analytics.
🔹 4. IoT and Big Data Integration
Collects IoT sensor data, processes it in Azure Data Lake, and visualizes it in Power BI.
🔹 5. Multi-Cloud Data Movement
Transfers data between AWS S3, Google BigQuery, and Azure Blob Storage.
5. Best Practices for Hybrid Cloud Integration Using ADF
✅ Use Self-Hosted IR for Secure On-Premises Data Access ✅ Optimize Pipeline Performance using partitioning and parallel execution ✅ Monitor Pipelines using Azure Monitor and Log Analytics ✅ Secure Data Transfers with Private Endpoints & Key Vault ✅ Automate Data Workflows with Triggers & Parameterized Pipelines
6. Conclusion
Azure Data Factory plays a critical role in hybrid cloud data integration by providing secure, scalable, and automated data pipelines. Whether you are migrating on-premises data, synchronizing real-time data, or integrating multi-cloud environments, ADF simplifies complex ETL processes with low-code and serverless capabilities.
By leveraging ADF’s integration runtimes, automation, and security features, organizations can build a resilient, high-performance hybrid cloud data ecosystem.
WEBSITE: https://www.ficusoft.in/azure-data-factory-training-in-chennai/
0 notes
Text
How to Ace a Data Engineering Interview: Tips & Common Questions
The demand for data engineers is growing rapidly, and landing a job in this field requires thorough preparation. If you're aspiring to become a data engineer, knowing what to expect in an interview can help you stand out. Whether you're preparing for your first data engineering role or aiming for a more advanced position, this guide will provide essential tips and common interview questions to help you succeed. If you're in Bangalore, enrolling in a Data Engineering Course in Hebbal, Data Engineering Course in Indira Nagar, or Data Engineering Course in Jayanagar can significantly boost your chances of success by providing structured learning and hands-on experience.
Understanding the Data Engineering Interview Process
Data engineering interviews typically consist of multiple rounds, including:
Screening Round – A recruiter assesses your background and experience.
Technical Round – Tests your knowledge of SQL, databases, data pipelines, and cloud computing.
Coding Challenge – A take-home or live coding test to evaluate your problem-solving abilities.
System Design Interview – Focuses on designing scalable data architectures.
Behavioral Round – Assesses your teamwork, problem-solving approach, and communication skills.
Essential Tips to Ace Your Data Engineering Interview
1. Master SQL and Database Concepts
SQL is the backbone of data engineering. Be prepared to write complex queries and optimize database performance. Some important topics include:
Joins, CTEs, and Window Functions
Indexing and Query Optimization
Data Partitioning and Sharding
Normalization and Denormalization
Practice using platforms like LeetCode, HackerRank, and Mode Analytics to refine your SQL skills. If you need structured training, consider a Data Engineering Course in Indira Nagar for in-depth SQL and database learning.
2. Strengthen Your Python and Coding Skills
Most data engineering roles require Python expertise. Be comfortable with:
Pandas and NumPy for data manipulation
Writing efficient ETL scripts
Automating workflows with Python
Additionally, learning Scala and Java can be beneficial, especially for working with Apache Spark.
3. Gain Proficiency in Big Data Technologies
Many companies deal with large-scale data processing. Be prepared to discuss and work with:
Hadoop and Spark for distributed computing
Apache Airflow for workflow orchestration
Kafka for real-time data streaming
Enrolling in a Data Engineering Course in Jayanagar can provide hands-on experience with these technologies.
4. Understand Data Pipeline Architecture and ETL Processes
Expect questions on designing scalable and efficient ETL pipelines. Key topics include:
Extracting data from multiple sources
Transforming and cleaning data efficiently
Loading data into warehouses like Redshift, Snowflake, or BigQuery
5. Familiarize Yourself with Cloud Platforms
Most data engineering roles require cloud computing expertise. Gain hands-on experience with:
AWS (S3, Glue, Redshift, Lambda)
Google Cloud Platform (BigQuery, Dataflow)
Azure (Data Factory, Synapse Analytics)
A Data Engineering Course in Hebbal can help you get hands-on experience with cloud-based tools.
6. Practice System Design and Scalability
Data engineering interviews often include system design questions. Be prepared to:
Design a scalable data warehouse architecture
Optimize data processing pipelines
Choose between batch and real-time data processing
7. Prepare for Behavioral Questions
Companies assess your ability to work in a team, handle challenges, and solve problems. Practice answering:
Describe a challenging data engineering project you worked on.
How do you handle conflicts in a team?
How do you ensure data quality in a large dataset?
Common Data Engineering Interview Questions
Here are some frequently asked questions:
SQL Questions:
Write a SQL query to find duplicate records in a table.
How would you optimize a slow-running query?
Explain the difference between partitioning and indexing.
Coding Questions: 4. Write a Python script to process a large CSV file efficiently. 5. How would you implement a data deduplication algorithm? 6. Explain how you would design an ETL pipeline for a streaming dataset.
Big Data & Cloud Questions: 7. How does Apache Kafka handle message durability? 8. Compare Hadoop and Spark for large-scale data processing. 9. How would you choose between AWS Redshift and Google BigQuery?
System Design Questions: 10. Design a data pipeline for an e-commerce company that processes user activity logs. 11. How would you architect a real-time recommendation system? 12. What are the best practices for data governance in a data lake?
Final Thoughts
Acing a data engineering interview requires a mix of technical expertise, problem-solving skills, and practical experience. By focusing on SQL, coding, big data tools, and cloud computing, you can confidently approach your interview. If you’re looking for structured learning and practical exposure, enrolling in a Data Engineering Course in Hebbal, Data Engineering Course in Indira Nagar, or Data Engineering Course in Jayanagar can provide the necessary training to excel in your interviews and secure a high-paying data engineering job.
0 notes
Text
The demand for SAP FICO vs. SAP HANA in India depends on industry trends, company requirements, and evolving SAP technologies. Here’s a breakdown:
1. SAP FICO Demand in India
SAP FICO (Finance & Controlling) has been a core SAP module for years, used in almost every company that runs SAP ERP. It includes:
Financial Accounting (FI) – General Ledger, Accounts Payable, Accounts Receivable, Asset Accounting, etc.
Controlling (CO) – Cost Center Accounting, Internal Orders, Profitability Analysis, etc.
Why is SAP FICO in demand? ✅ Essential for businesses – Every company needs finance & accounting. ✅ High job availability – Many Indian companies still run SAP ECC, where FICO is critical. ✅ Migration to S/4HANA – Companies moving from SAP ECC to SAP S/4HANA still require finance professionals. ✅ Stable career growth – Finance roles are evergreen.
Challenges:
As companies move to S/4HANA, traditional FICO skills alone are not enough.
Need to upskill in SAP S/4HANA Finance (Simple Finance) and integration with SAP HANA.
2. SAP HANA Demand in India
SAP HANA is an in-memory database and computing platform that powers SAP S/4HANA. Key areas include:
SAP HANA Database (DBA roles)
SAP HANA Modeling (for reporting & analytics)
SAP S/4HANA Functional & Technical roles
SAP BW/4HANA (Business Warehouse on HANA)
Why is SAP HANA in demand? ✅ Future of SAP – SAP S/4HANA is replacing SAP ECC, and all new implementations are on HANA. ✅ High-paying jobs – Technical consultants with SAP HANA expertise earn more. ✅ Cloud adoption – Companies prefer SAP on AWS, Azure, and GCP, requiring HANA skills. ✅ Data & Analytics – Business intelligence and real-time analytics run on HANA.
Challenges:
More technical compared to SAP FICO.
Requires skills in SQL, HANA Modeling, CDS Views, and ABAP on HANA.
Companies still transitioning from ECC, meaning FICO is not obsolete yet.
Mail us on [email protected]
Website: Anubhav Online Trainings | UI5, Fiori, S/4HANA Trainings

0 notes
Text
Azure Data Engineer Course In Bangalore | Azure Data
PolyBase in Azure SQL Data Warehouse: A Comprehensive Guide
Introduction to PolyBase
PolyBase is a technology in Microsoft SQL Server and Azure Synapse Analytics (formerly Azure SQL Data Warehouse) that enables querying data stored in external sources using T-SQL. It eliminates the need for complex ETL processes by allowing seamless data integration between relational databases and big data sources such as Hadoop, Azure Blob Storage, and external databases.
PolyBase is particularly useful in Azure SQL Data Warehouse as it enables high-performance data virtualization, allowing users to query and import large datasets efficiently without moving data manually. This makes it an essential tool for organizations dealing with vast amounts of structured and unstructured data. Microsoft Azure Data Engineer
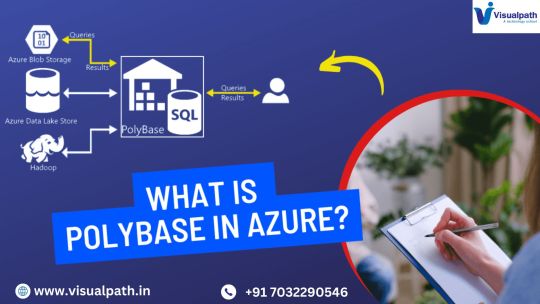
How PolyBase Works
PolyBase operates by creating external tables that act as a bridge between Azure SQL Data Warehouse and external storage. When a query is executed on an external table, PolyBase translates it into the necessary format and fetches the required data in real-time, significantly reducing data movement and enhancing query performance.
The key components of PolyBase include:
External Data Sources – Define the external system, such as Azure Blob Storage or another database.
File Format Objects – Specify the format of external data, such as CSV, Parquet, or ORC.
External Tables – Act as an interface between Azure SQL Data Warehouse and external data sources.
Data Movement Service (DMS) – Responsible for efficient data transfer during query execution. Azure Data Engineer Course
Benefits of PolyBase in Azure SQL Data Warehouse
Seamless Integration with Big Data – PolyBase enables querying data stored in Hadoop, Azure Data Lake, and Blob Storage without additional transformation.
High-Performance Data Loading – It supports parallel data ingestion, making it faster than traditional ETL pipelines.
Cost Efficiency – By reducing data movement, PolyBase minimizes the need for additional storage and processing costs.
Simplified Data Architecture – Users can analyze external data alongside structured warehouse data using a single SQL query.
Enhanced Analytics – Supports machine learning and AI-driven analytics by integrating with external data sources for a holistic view.
Using PolyBase in Azure SQL Data Warehouse
To use PolyBase effectively, follow these key steps:
Enable PolyBase – Ensure that PolyBase is activated in Azure SQL Data Warehouse, which is typically enabled by default in Azure Synapse Analytics.
Define an External Data Source – Specify the connection details for the external system, such as Azure Blob Storage or another database.
Specify the File Format – Define the format of the external data, such as CSV or Parquet, to ensure compatibility.
Create an External Table – Establish a connection between Azure SQL Data Warehouse and the external data source by defining an external table.
Query the External Table – Data can be queried seamlessly without requiring complex ETL processes once the external table is set up. Azure Data Engineer Training
Common Use Cases of PolyBase
Data Lake Integration: Enables organizations to query raw data stored in Azure Data Lake without additional data transformation.
Hybrid Data Solutions: Facilitates seamless data integration between on-premises and cloud-based storage systems.
ETL Offloading: Reduces reliance on traditional ETL tools by allowing direct data loading into Azure SQL Data Warehouse.
IoT Data Processing: Helps analyze large volumes of sensor-generated data stored in cloud storage.
Limitations of PolyBase
Despite its advantages, PolyBase has some limitations:
It does not support direct updates or deletions on external tables.
Certain data formats, such as JSON, require additional handling.
Performance may depend on network speed and the capabilities of the external data source. Azure Data Engineering Certification
Conclusion
PolyBase is a powerful Azure SQL Data Warehouse feature that simplifies data integration, reduces data movement, and enhances query performance. By enabling direct querying of external data sources, PolyBase helps organizations optimize their big data analytics workflows without costly and complex ETL processes. For businesses leveraging Azure Synapse Analytics, mastering PolyBase can lead to better data-driven decision-making and operational efficiency.
Implementing PolyBase effectively requires understanding its components, best practices, and limitations, making it a valuable tool for modern cloud-based data engineering and analytics solutions.
For More Information about Azure Data Engineer Online Training
Contact Call/WhatsApp: +91 7032290546
Visit: https://www.visualpath.in/online-azure-data-engineer-course.html
#Azure Data Engineer Course#Azure Data Engineering Certification#Azure Data Engineer Training In Hyderabad#Azure Data Engineer Training#Azure Data Engineer Training Online#Azure Data Engineer Course Online#Azure Data Engineer Online Training#Microsoft Azure Data Engineer#Azure Data Engineer Course In Bangalore#Azure Data Engineer Course In Chennai#Azure Data Engineer Training In Bangalore#Azure Data Engineer Course In Ameerpet
0 notes