#Calculation of Standard Deviation in Discrete Series
Explore tagged Tumblr posts
Visit Tumblr Blog
Explore Tumblr blogs with no restrictions, modern design and the best experience.
Last Seen Tumblr Blogs


Fun Fact
Hackers stole 65M passwords from Tumblr in 2013.
Text
Calculation of Standard Deviation in Individual, Discrete & Continuous Series | Statistics
In this article, we will discuss about Calculation of Standard Deviation in Individual, Discrete & Continuous Series and measures of dispersion in Statistics. How to calculate Standard deviation Standard Deviation Standard deviation Measures of Dispersion in Statistics is the measure of the dispersion of statistical data. The standard deviation formula is used to find the deviation of the data…

View On WordPress
#Calculation of Standard Deviation#Calculation of Standard Deviation in Continuous Series#Calculation of Standard Deviation in Discrete Series#Calculation of Standard Deviation in Grouped Data#Calculation of Standard Deviation in Individual Series#Calculation of Standard Deviation in Ungrouped Data#How to Calculate Standard Deviation#How to Calculate Standard Deviation in Continuous Series#How to Calculate Standard Deviation in Discrete Series#How to Calculate Standard Deviation in Individual Series#Measures of Dispersion Statistics#Standard Deviation
0 notes
Text
Capstone project Draft 2
Methods.
The database selected for their support information and size was the Physionet Motor-Imagery dataset. The complete database consisting of 1500 recordings of 1- 2 minutes was obtained from 109 volunteers on 64 EEG channels using the BCI2000 system. Each subject performed 14 experimental runs, with the following characteristics: two one-minute baseline runs (one with eyes open, one with eyes closed) and three experimental runs of two minutes of each of the following four tasks: 1) Open and close the left or right fist 2) Imagine opening or closing the left or right fist 3) Open and close both fists or both feet 4) Imagine opening and closing both fists or both feet.
For the present work, not the full database was employed, only a sub-set of 10 experimental subjects because an A 10% subject size can represent the information. The selection of the size was made taking into consideration previous studies that demonstrate feature correlation with a small sample and to lower the computational cost. Also, the sub-set is composed of 10 experimental subjects that contain 12 trials each. 3 trials correspond to the performance of the movement, 3 trials to the imagination of the movement, and six trials to a baseline (3 for eyes open and 3 for eyes closed), giving a total of 120 trials.
In this work, features were extracted and selected based on their association with the cerebral motor region to facilitate the distinction of movement (real or imaginary) and inactivity. The features were extracted for the Fc3 channel, this channel was considered due to its location in the 20-10 electrode positioning system and also its in a region associated with motor activity. It was extracted 6 power bands Delta, Theta, Alpha, Beta, Gama, and Mu (an alphoid associated with motor events).
And time-domain features that reflected the randomness of the signals and could be helpful to distinguish between movement and inactivity, that was the following: Spectral Power Density (PSD) that it’s a rate witch motor unities are triggered, Shannon Entropy a measure of uncertainty, and a representation of certain signal information, Spectral Entropy a measure of power distribution and Discrete Wavelet Transform (DWT) that is the decomposition of the signal in basic functions by contraction or expansions of their equations.
A K-means cluster analysis was conducted to identify underlying subgroups of variables based on their similarity of responses on 10 variables that represent characteristics that could have an impact on movement in EEG signals.
All clustering variables were standardized to have a mean of 0 and a standard deviation of 1.
Data were randomly split into a training set that included 70% of the observations (N=84) and a test set that included 30% of the observations (N=36). A series of k-means cluster analyses were conducted on the training data specifying k=1-9 clusters, using Euclidean distance.
Also, a Random Forest analysis was performed to evaluate the importance of a series of explanatory variables in predicting a binary, categorical response variable, that in the present is called represented by the inactivity or the movement. The 10 EEG explanatory variables were included as a possible contributors to random forest evaluation of the movement condition These features, including power bands and time-domain features, and a binary, categorical response variable, to classify between inactivity or movement. PSD, 2 types of Entropy, a Discrete Wavelet and 6 Power Bands calculations. The data was split into train 60% and test in 40%.
0 notes
Link

1. Introduction
Introduction: Why Economics?, Meaning and Definitions of Economics, Economic and Non-economic Activities, Economic Groups, Introduction: Statistics, Meaning and Definition of Statistics, Importance of Statistics in Economics, Limitation of Statistics, Key Points, Question Bank, Very Short Answer Type Questions, Short Answer Type Questions, Long Answer Type Questions, Higher Order Thinking Skills [HOTS], Value Based Questions, Multiple Choice Questions (MCQs).
2. Collection of Data
Introduction, Meaning of Collection of Data, Types of Data (Sources of Data), Methods of Collecting Primary Data, Questionnaire and Schedule, Census and Sample Investigation Techniques, Sampling and Non-Sampling Errors, Sources of Secondary Data, Census of India And NSSO, Key Points, Question Bank, Very Short Answer Type Questions, Short Answer Type Questions, Long Answer Type Questions, Higher Order Thinking Skills (HOTS), Value Based Questions, Multiple Choice Questions (MCQs).
3. Organisation of Data
Introduction, Meaning and Definition of Classification, Objectives of Classification, Methods of Classification, Variable, Statistical Series, Individual Series, Discrete Series (Ungrouped Frequency Distribution or Frequency Array), Continuous Series or Grouped Frequency Distribution, Types of Continuous Series, Bivariate Frequency distribution, General Rules for Constructing a Frequency Distribution, or How to prepare a frequency distribution?, Key Points, Question Bank, Very Short Answer Type Questions, Short Answer Type Questions, Long Answer Type Questions, Numerical Questions, Higher Order Thinking Skills (HOTs), Value Base Questions, Multiple Choice Questions (MCQs).
4. Presentation of Data : Tabular Presentation
Introduction, Textual Presentation of Data (Descriptive Presentation), Tabular Presentation of Data, Objectives of Tabulation, Essential Parts of Table, Type of Table, Solved Examples, Key Points, Question Bank, Very Short Answer Type Questions, Short Answer Type Questions, Long Answer Type Questions, Numerical Questions, Higher Order Thinking Skills (HOTS), Value Based Questions, Multiple Choice Questions (MCQs).
5. Presentation of Data : Diagrammatic Presentation
Introduction, Utility or Advantages of Diagrammatic Presentation, Limitations of Diagrams, General Principles/Rules for Diagrammatic Presentation, Types of Diagrams, Bar Diagram, Pie Diagram, Key Points, Question Bank, Very Short Answer Type Questions, Short Answer Type Question, Long Answer Type Question, Numerical Questions, Higher Order Thinking Skills (HOTS), Multiple Choice Questions (MCQs).
6. Presentation of Data: Graphic Presentation
Introduction, Advantages of Graphic Presentation, Construction of a Graph, False Base Line (Kinked Line), Types of Graphs, Limitation of Graphic Presentations, Key Points, Question Bank, Very Short Answer Type Questions, Short Answer Type Questions, Long Answer Type Questions, Numerical Questions, Higher Order Thinking Skills (HOTS), Multiple Choice Question (MCQs).
7. Measures of Central Tendency Arithmetic Mean
Introduction, Meaning and Definition, Objectives and Significance or uses of Average, Requisites or Essentials of an Ideal Average, Types or Kinds of Statistical Averages, Arithmetic Mean (X), Calculation of Arithmetic Mean in Different Frequency Distribution (Additional Cases), Calculation of Missing Value, Corrected Mean, Combined Arithmetic Mean, Mathematical Properties of Arithmetic Mean, Merits and Demerits of Arithmetic Mean, Weighted Arithmetic Mean, List of Formulae, Key Points, Question Bank, Very Short Answer Type Questions, Short Answer Type Questions, Long Answer Type Questions, Numerical Questions, Miscellaneous Questions, Multiples Choice Questions (MCQs).
8. Measures of Central Tendency Median and Mode
Median, Determination of Median, Calculation of Median in Different Frequency Distribution (Additional Cases), Partition Values (Measures of Position or Positional Values based on The principle of Median), Mode (Z), Computation of Mode, Calculation of Mode in Different Frequency Distribution (Additional Cases), Relationship between Mean, Median and Mode, Comparison between Mean, Median and Mode, Choice of a Suitable Average, Typical Illustration, List of Formulae, Key Points, Question Bank, Very Short Answer Type Questions, Short Answer Type Questions, Long Answer Type Questions, Numerical Questions, Miscellaneous Questions, Higher Order Thinking Skills (HOTS), Value Based Questions, Multiple Choice Questions (MCQs).
9. Measure of Dispersion
Introduction, Meaning and Definition, Objectives and Significance, Characteristics of Good Measure of Dispersion, Methods of Measurement of Dispersion, Types of Dispersion, Range, Inter-Quartile Range and Quaritle Deviation, Mean Deviation (Average Deviation), Standard Deviation (s), Relationship between Different Measures of Dispersion, Lorenz Curve, Choice of A Suitable Measure of Dispersion, Typical Illustrations, List of Formulae, Key Points, Question Bank, Very Short Answer Type Questions, Short Answer Type Questions, Long Answer Type Questions, Numerical Questions, Higher Order Thinking Skills (HOTS), Multiple Choice Questions (MCQs).
10. Correlation
Introduction, Meaning and Definitions, Types of Correlation, Coefficient of Correlation (r), Degree of Correlation, Techniques or Methods for Measuring Correlation, Scatter Diagram (Dotogram Method), Karl Pearson’s Coefficient of Correlation, Spearman’s Rank Correlation, Typical Illustrations, List of Formulae, Key Points, Question Bank, Very Short Answer Type Questions, Short Answer Type Questions, Long Answer Type Questions, Numerical Questions, Miscellaneous Questions, Higher Order Thinking Skills (HOTS), Value Based Questions, Multiple Choice Questions.
11. Index Numbers
Introduction, Characteristics or Features, Precautions in Constructions of Index Numbers (Problems), Types or Kinds of Index Numbers, Methods of Constructing Price Index Numbers, Simple Index Number (Unweighted), Weighted Index Numbers, Some Important Index Numbers, Significance or Uses of Index Numbers, Limitations of Index Numbers, List of Formulae, Key Points, Question Bank, Very Short Answer Type Questions, Short Answer Type Questions, Long Answer Type Questions, Numerical Questions, Higher Order Thinking Skills (HOTS), Value Based Questions, Multiple Choice Questions (MCQs).
12. Mathematical Tools Used in Economics
Slope of a Line, Slope of a Curve, Equation of a line.
13. Developing Projects in Economics
Introduction, Steps Towards Making A Project, Suggested List of Projects.
0 notes
Text
Beginner's Guide to Statistics and Probability Distribution
Beginner's Guide to Statistics and Probability Distribution http://bit.ly/39yJ24M
By Anupriya Gupta and Ishan Shah
We have all realised that a working knowledge of statistics is essential for modelling different strategies when it comes to algorithmic trading. In fact, data science, one of the most sought after skills in this decade, employs statistics to model data and arrive at meaningful conclusions. With that aim in mind we will go through some basic terminologies as well as the types of probability distributions which are employed in the domain of algorithmic trading.
We will go through the following topics:
Historical Data Analysis
Probability distribution
Correlation
Historical Data Analysis
In this section, we will try to answer the fundamental question, “How do you analyse a stock’s historical data and use it for strategy building?” Of course, for the analysis, we first need a data set!
Dataset
In order to keep it universal, we have taken the daily stock price data of Apple, Inc. from Dec 26, 2018, to Dec 26, 2019. You can download historical data from Yahoo Finance. If you are interested in downloading the data using python, you can visit the following link.
For the time being, we will use the following python code to download it from yahoo finance;
import yfinance as yf aapl = yf.download('AAPL','2018-12-26', '2019-12-26')
This is a time-series data set with daily closing prices and volumes for Apple. We’ll base our analysis on the closing prices for this stock. We’ll just touch upon the basic statistical properties for the daily stock prices in this post, which would be followed by a breif on correlation.
Mean? Mode? Median? What’s the difference!!!
We will just take 5 numbers as an example: 12, 13, 6, 7, 19, 21, and understand the three terms.
Mean
To put it simply, mean is the one we are most used to, i.e. the average. Thus, in the above example, the mean = (12 + 13 + 6 + 7 + 19 + 21)/6 = 13.
In the AAPL dataset, the mean of closing prices is 204.84. The rolling mean is a widely used measure in technical trading strategies. The traders place great importance to cross over of 50 days and 200 days rolling mean. And initiate trade based on it.
For the AAPL dataset, we will use the following python code:
mean = np.mean(aapl['Adj Close']) mean
The output is: 204.84638595581055
Mode
In a given dataset, the mode will be the number which is occurring the most. In the above example, since there is no value which is repeated, there is no mode. You can argue that every element is a mode. But that doesn't help in summarizing the dataset.
In the AAPL dataset, the mode of closing prices does not exist as there is no repeating value.
When we try to run the following code to find the mode in python, it throws the following error
import statistics mode = statistics.mode(aapl['Adj Close']) mode

Also, if your dataset is as below, which value of mode you will go with?
It is difficult to answer that question, and some other measure should be used. Also, the mode doesn’t really make much sense for closing prices or other continuous data. A mode is especially useful when you want to plot histograms and visualize the frequency distribution.
Median
Sometimes, the data set values can have a few values which are at the extreme ends, and this might cause the mean of the data set to portray an incorrect picture. Thus, we use the median, which gives the middle value of the sorted data set.
To find the median, you have to arrange the numbers in ascending order and then find the middle value. If the dataset contains an even number of values, you take the mean of the middle two values. In our example, the median is (12 + 13)/2 = 12.5
In our data set, the median of the closing price is 201.05
The python code for finding the median is the following:
median = np.median(aapl['Adj Close'])
Great! We now move on to a term which is very important when we start learning about statistics, i.e. Probability distribution.
Probability distribution
We have all gone through the example of finding the probabilities of a dice roll. Now, we know that there are only six outcomes on a dice roll, i.e. {1, 2, 3, 4, 5, 6}. The probability of rolling a 1 is 1/6. This kind of probability is called discrete, where there are a fixed number of outcomes.
Now, as the name suggests, the probability distribution is simply a list of all outcomes of a given event. Thus, the probability of the dice roll event is the following:
Dice roll number
Probability Distribution
1
1/6
2
1/6
3
1/6
4
1/6
5
1/6
6
1/6
Listing all the values here works because we have a limited set of outcomes, but if the outcomes are large, we use functions.
If the probability is discrete, we call the function a probability mass function. In the case of dice roll, it will be P(x) = 1/6 where x = {1,2,3,4,5,6}.
For discrete probabilities, there are certain cases which are so extensively studied, that their probability distribution has become standardised. Let’s take, for example, Bernoulli's distribution, which takes into account the probability of getting heads or tails when we toss a coin. We write its probability function as px (1 – p)(1 – x). Here x is the outcome, which could be written as heads = 0 and tails = 1.
Now, there are cases where the outcomes are not clearly defined. For example, the heights of all high school students in one grade. While the actual reason is different, we can say that it will be too cumbersome to list down all the height data and the probability. It is in this situation that the functions are essential.
Earlier, we said that for discrete values, the probability function is the probability mass function. In comparison, for continuous values, the probability function is known as a probability density function.
Let us take a step back and understand some terms related to the probability distribution.
Range
Range simply gives the difference between the min and max values of the data set.
In the data set taken, the minimum value of the closing price is 140.08 while the maximum value is 284.26. Thus, the range = 284.26 - 140.08 = 144.18. Now, we will move towards standard deviation.
In python, we can find the values by a simple line of code:
aapl['Adj Close'].describe()
The output is as follows:
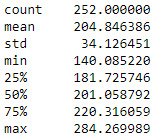
Standard Deviation
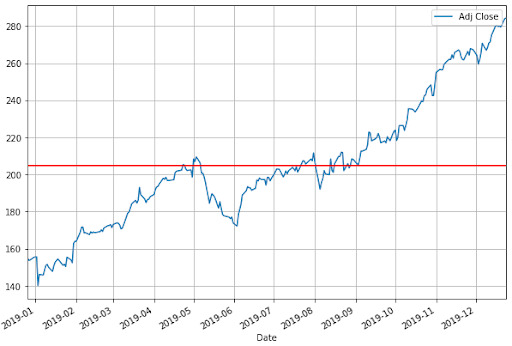
In simple words, the standard deviation tells us how far the value deviates from the mean. Let us use the full dataset and try to understand how the standard deviation helps us in the arena of trading.
We are taking into account the closing price for our calculations. As specified previously, the mean of our dataset is 204.84. The python code for Plotting the graph with the closing price and the mean should give us the following figure.
import matplotlib.pyplot as plt aapl['Adj Close'].plot(figsize=(10,7)) plt.axhline(y=mean, color='r', linestyle='-') plt.legend() plt.grid() plt.show()
The standard deviation is calculated as:
Calculate the simple average of the numbers (mean)
Subtract the mean from each number
Square the result
Calculate the average of the results
Take square root of the answer in step 4
For the data set given, the code is as follows:
std = np.std(aapl['Adj Close'])
The standard deviation of the closing price would be 34.05.
Now we will plot the above graph with one standard deviation on both sides of the mean. We will write it as (+S.D.) = 204.84 + 34.05 = 238.89, and (-S.D.) = 204.84 - 34.05 = 170.79.
The code is as follows:
aapl['Adj Close'].plot(figsize=(10,7)) plt.axhline(y=mean, color='r', linestyle='-') plt.axhline(y=mean+std, color='r', linestyle='-') plt.axhline(y=mean-std, color='r', linestyle='-') plt.legend() plt.grid() plt.show()

In the graph, the mean is shown as the middle red line while the +S.D. and -S.D. are the other red lines.
So tell us, what can you observe by looking at the above graph?
Well, a quick look tells us that most of the closing price values are in between the two standard deviations. Thus, this gives us a rough idea about the majority of the price action.
But you might still be wondering, what is the use of knowing a certain range of price values? Well, for one thing, standard deviation plays an important role in Bollinger Bands, which is a quite popular indicator. You can use the upper standard deviation as a sign of a breakout. And initiate a buy trade when the price moves above the upper band.
The volatility of the stock can be calculated using the standard deviation. The stock volatility is an important feature used in many machine learning algorithms. It is also used in Normal probability distribution, which we will cover in a while.
Wait! Normal distribution?
Normal distribution is a very simple and yet, quite profound piece in the world of statistics, actually in general life too. The basic premise is that given a range of observations, it is found that most of the values centre around the mean and within one standard deviation away from the mean. Actually, it is said that 68% of the values are within this range. If we move ahead, then we see 95% of the values within two standard deviations from the mean.
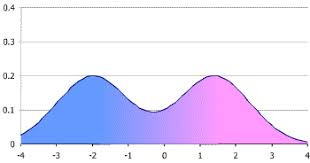
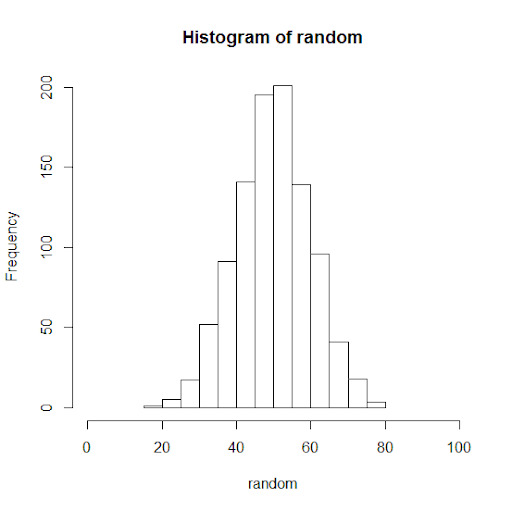
Wait, we are going ahead of ourselves now. Let us first take the help of something called the histogram to understand this.
Histogram
Let’s take an example of the heights of students in a batch. Now there might be students who have heights of 60.1 inch, 60.2 inches and so on till 60.9. Sometimes we are not looking for that level of detail and would like just to find out how many students have a height of 60 - 61 inches. Wouldn’t that make our job easier and simpler? That is exactly what a histogram does. It gives us the frequency distribution of the observed values.
When it comes to trading, we usually use the daily percentage change instead of the closing prices.
For our dataset, we will use the following code:
aapl['daily_percent_change'] = aapl['Adj Close'].pct_change() aapl.daily_percent_change.hist(figsize=(10,7)) plt.ylabel('Frequency') plt.xlabel('Daily Percentage Change') plt.show()
The output is as follows:

Recall how we said that the majority of the values are situated close to the mean. You can see it clearly in the histogram plotted above.
In fact, if we draw a line curve around the values, it would look like a bell.
We call this a bell curve, which is another name for the normal probability distribution, or normal distribution for short. You can see the majority of the values lying between the standard deviations, i.e. (+S.D.) = 239.6, and (-S.D.) = 172.64.
You might want to keep in mind that in a normal distribution, 68% of the values lie between one standard deviation and 95% of the values lie between two standard deviations. Moving further, we will say that 99.7% of the values lie between 3 standard deviations of the mean.
Normal distribution
When the distribution of your data meets certain requirements, such as symmetry around the mean and bell-shaped curve, we say your data is normally distributed.
Statistically speaking, if X is Normally distributed with mean µ and standard deviation σ, we write X∼N(µ, σ^2), where µ and σ are the parameters of the distribution.
Why is it useful to know the distribution function of your dataset?
If you know that your data sample is, say, normally distributed, you can make ‘predictions’ about your population with certain ‘confidence’.
For example, say, your data sample X represents marks obtained out of 100 in an entrance test for a sample of students. The data is normally distributed, such as X∼N(50, 102). When plotted, this data would look as follows:

If you increase the number of observations in your sample data set from 100 to 1000, this is what happens:
It looks more bell-shaped!
Now that we know, X has normally distributed data with mean at 50 and standard deviation of 10, we can predict the marks of the entire student population or future students (from the same population) with a certain confidence. With almost 99.7% confidence, we can say that students would not get less than 20 or greater than 80 marks. With 95% confidence, we can say that students would get marks between 30 and 70 points.

Statistically speaking, distribution functions give us the probability of expecting the value of a given observation between two points. Hence, using distribution functions, also called probability density functions, we can ‘predict’ with certain ‘confidence’.
Are closing prices normally distributed?
Before we try to answer the question, let us take another dataset and see how its histogram looks like.
We have plotted the histogram of Tesla, Inc. for the same period and see the following:
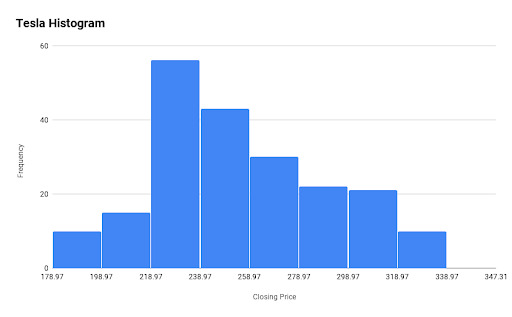
Here, the mean(Closing price) is 270.9 and the +S.D. and -S.D. is 319.14 and 222.66 respectively. So what conclusion can you draw from the above histogram?
To sum it up, probability distribution functions are used in every step of technical analysis, and it is the core of the quantitative analysis. These analyses constitute the core part of any strategy building process.
So far, we have gone through some basic concepts in the world of statistics. Now, we shall try to go a bit further in this fascinating world and see its application in trading. We will first start with correlation.
Correlation
Am I related to you or not?
Well, in a way, correlation tells us about the relationship between two sets of values. Until now, we have taken the data set of Apple from Dec 26, 2018 to Dec 26, 2019. Now, we should point that Apple is part of the S&P 500 index. Thus, any change in Apple stocks could in some way reflect on the S&P index.
Let us take the dataset of the S&P500 for the same time period and find the correlation.
The code is as follows:
import yfinance as yf spx = yf.download('^GSPC','2018-12-26', '2019-12-26') spx['daily_percent_change'] = spx['Adj Close'].pct_change() plt.figure(figsize=(10,7)) plt.scatter(aapl.daily_percent_change,spx.daily_percent_change) plt.xlabel('AAPL Daily Returns') plt.ylabel('SPY Daily Returns') plt.grid() plt.show()
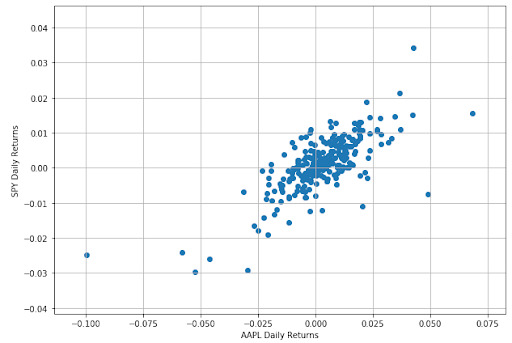
from scipy.stats import spearmanr correlation, _ = spearmanr(aapl.daily_percent_change.dropna(),spx.daily_percent_change.dropna()) print('Spearmans correlation is %.2f' % correlation)

Understanding correlation
Correlation is a unit free number lying between -1 and 1 which gives us the measurement of the relationship between variables. A highly positive correlation value lying between 0.7 and 1.0 means that the change in one variable is positively related to the change in the other variable. That means, if one variable increases, there is a high probability that other one will increase as well. The behavior will be consistent in other cases of decrease or no change in value as well.
On the other hand, a highly negative correlation value lying between -0.7 to -1.0 tells us that the change in one variable is negatively related to the change in the other variable. That means, if one variable increase, there is a high probability that the other one will decrease.
The low correlation value around -0.2 and 0.2 tells us that there is no strong relationship between the two variables.
A point to note is that correlation doesn’t tell us anything about causality. We have all heard of the statement, “Correlation doesn’t imply causation”. For instance, it is possible that instances of lung cancers are correlated with the number of cigarettes smoked in a lifetime among a population, that does not establish causality of smoking to lung cancer. One would be required to do a controlled group study keeping constant all other influential factors to establish such a causality relation. Machine learning based trading models are very good at extracting such causality between different indicators.
Correlation is the measure of the linear relationship. For instance, the correlation between x and x2 might be as close as 0. Even though there is a strong relationship between the two variables, it would not be captured in the correlation value.
Great! We have gone through a lot of concepts related to Statistics. You can move further to regression; in fact, the blog on Linear regression is a perfect next step in your quest to master the art of algorithmic trading.
Conclusion
We have gone through basic concepts of mean, median and mode and then understood the probability distribution of discrete as well as continuous variables. We looked into normal distribution in detail and touched upon the topic of correlation to figure out if two datasets are related or not.
If you want to learn various aspects of Algorithmic trading and automated trading systems, then check out the Executive Programme in Algorithmic Trading (EPAT®). The course covers training modules like Statistics & Econometrics, Financial Computing & Technology, and Algorithmic & Quantitative Trading. EPAT® equips you with the required skill sets to build a promising career in algorithmic trading. Enroll now!
Disclaimer: All data and information provided in this article are for informational purposes only. QuantInsti® makes no representations as to accuracy, completeness, currentness, suitability, or validity of any information in this article and will not be liable for any errors, omissions, or delays in this information or any losses, injuries, or damages arising from its display or use. All information is provided on an as-is basis.
Trading via QuantInsti http://bit.ly/2Zi7kP2 January 3, 2020 at 08:48AM
0 notes
Text
PPC Divination: Forecasting Uncertainty in Excel
You’ve heard it before. Whether it’s a new idea you’re gearing up to pitch, or a request handed down to you from upper management. “Show me numbers!”
Thus, you have carefully examined and prepared data that show exactly what has happened in your accounts to-date, what’s worked and what hasn’t, and you are equipped to recommend next steps for future success. You know your account inside and out, but it’s not enough.
C-level executives spend 70% of their time thinking about and focused on the future. When they say, “show me numbers,” they aren’t talking about the numbers you already have. They want to know what the numbers are going to look like, based on the plan you’re presenting.
In an ideal world, historical data would perfectly predict future performance. Unfortunately, you work in the dynamic world of PPC, where that is rarely the case. New platform features, shifting competitive landscapes, changes in user behavior, and ever-rising prices bring a dose of unpredictability that cannot go unaddressed nor be reliably pinpointed.
Today, I’d like to share two methods of incorporating uncertainty into your PPC forecasts. You can use uncertainty variables to account for anticipated fluctuations in impression availability, CPCs, conversion rates, aggressiveness of competitors, and more.
Build Your Model
At the beginning of any uncertainty forecasting, you should first prepare your model using static numbers to test its functionality. Let’s assume, for this demonstration, that we’d like to forecast CPA for the coming quarter, anticipating a spike in our CPCs after the first of the year.
We’ll begin by identifying all the relevant metrics that will factor into our calculation. CPA is obviously the quotient of cost and conversion volume. Cost is dependent upon click volume and CPC, while conversion volume depends on clicks and conversion rate.
There are many more factors that can be included this model for added complexity (and additional layers of uncertainty accounted for), but because we are examining the impact of rising CPCs on our CPA, we will focus on only these metrics:
Clicks
CPC
Cost
Conversion Rate
CPA
Building upon the relationship between these metrics, we establish the following model to calculate CPA based on given values for all other fields and verify the logic with placeholder values.
Next, we will determine the correct values for the “constants” in our model (Clicks and Conversion Rate) by examining historical data. We find by looking at QoQ data from recent years past that Q1 tends to generate 21% more clicks than Q4 of the preceding year and conversion rates tend to be 14% higher (all else constant). Combining this information with actual data from Q4 present-year, we get forecasted values for Clicks and CVR to insert into our model.
We now have two static cells, one supporting formula cell, one output cell, and one uncertainty cell. It’s time to see how changes to the uncertainty cell impact the output cell.
Uncertainty with Discrete Probability
Let’s say that, looking at historical data, we determine there is a 15% likelihood of CPCs remaining steady QoQ at $12.35, a 45% likelihood of CPCs increasing by 7% QoQ, a 30% chance of a 12% increase QoQ, and 10% chance of an increase in CPCs equal to 17%.
We take this information to create a discrete probability table and a list of “lower threshold” values that show the cumulative sum of probabilities.
We can now update the placeholder value in our uncertainty cell (CPC) to find the Expected CPC associated with any random number between 0 and 1 according to the “lower threshold” column in our probability table.
This formula will perpetually refresh with each keystroke or press of F9 (depending on Calculation Options you have set). With each iteration of the random variable, your CPC forecast will fluctuate between the values in your discrete probability table.
Uncertainty with Normal Distribution
Now, assume that we are not able to establish a discrete probability table, but rather want to assume that possible CPC values are normally distributed with a defined mean and standard deviation (Mean and standard deviation can be found by looking at CPCs on a daily, weekly, or monthly basis for some amount of time and using the =AVERAGE() and =STDEV() functions in Excel).
In this instance, we find a mean of $13.46 and standard deviation of $.90. To find out expected CPC, we need merely use the =NORMINV function in excel, replacing the desired probability value with a random variable.
This formula will generate a random number between 0 and 1, and identify what value corresponds to that probability on a normal curve with the designated mean and standard deviation.
Iterate and Evaluate
Now that we have our uncertainty variable in place (whichever method you opted to use), it’s time to track multiple iterations of the possible outcome and evaluate with statistics. The quickest and easiest way to do this is with a data table.
First, we will create a numbered row for each desired iteration (e.g. 1000 rows for 1000 iterations—Fill Series is a great feature to help with this). In the cell directly above and to the right of “1”, we will reference our output cell (in this case, CPA).
We then use the What-If Analysis feature to create a single-variable data table, leaving the row input cell blank and selecting ANY EMPTY CELL for the column input cell.
This will iterate the random variable the specified number of times, providing a pool of possible output values according to the probability criteria you established. Taking the mean, standard deviation, min and max values of the output values in this table will give you an approximation (and understanding of likely fluctuation) of actual CPAs for the upcoming quarter given anticipated but uncertain increases in CPC.
Closing Thoughts
The method outlined above, though a simplistic example in many ways, provides a foundation for incorporating uncertainty into your forecasting models. While the world of PPC is enthusiastically data-driven, we also know that it is oftentimes unpredictable. Learning how to account for unexpected shifts will strengthen our forecasts and make it easier to move forward with confidence in our digital strategies.
It is true, there may never be a true “crystal ball” for anticipating future account performance, but a well-constructed model and a handful of uncertainty variables can certainly help us get close.
from RSSMix.com Mix ID 8217493 https://www.ppchero.com/ppc-divination-forecasting-uncertainty-in-excel/
0 notes
Text
Business Mathematics Amity 1st Sem

Business Mathematics 1st Amity Solution
You can buy amity solved assignments from atozhomework.com. We are honest, genuine and managed organization by a team. Post Math Homework and Get Solution Step-by-Step Join Membership and study complete document Q1: Define a subgroup. Q2: Define complete Graph with the help of examples. Q3: Explain De Morgan’s Law with examples. Q4: Explain Tautology with examples. Q5: Consider the following sample of data. 7, -5, -8, 7, 9, 12, 0, 3, 11, 8, 6, -2, 4, 10 Answer the following questions. a. What are the mean and median for this dataset? b. What are the standard deviation and variance? c. What is the range? Amity Case Study Solution "In a survey of 200 students of a College it was found that 120 had laptop, 90 had calculator and 70 had mobile phone, 40 had laptop and calculator, 30 had calculator and mobile phone, 50 had mobile phone and laptop and 20 had none of these gadgets. On the basis of above information answer the following questions. Q1. Find the number of students of calculator and mobile phone but not laptop. Q2: Find the number of students of laptop and mobile phone but not calculator. Q3: How many students have no laptop? Amity Assignment – C QUESTION 1: The complement of the union of two sets is the intersection of their complements and the complement of the intersection of two sets is the union of their complements.These are called. a. Union laws b. De Morgan s laws c. Associative laws d. Commutative laws QUESTION 2: Less than Ogive and more than Ogive intersect at a. Mode b. Mean c. Median d. Lower Quartile QUESTION 3: A terminal node in a binary tree is called........... a. Root b. Leaf c. Child d. Branch QUESTION 4: "The intersection of the sets {1, 2, 5} and {1, 2, 6} is the set ___________." a. "{1,2}" b. "{1,2,5}" c. "{1,2,6}" d. "{1,2,5,6}" QUESTION 5: Mode of a distribution can be obtained from a. Frequency polygon b. Histogram c. Less than type Ogives d. More than type Ogives QUESTION 6: Harmonic Mean is useful to find a. Average speed b. Average increment c. Average height d. None of these QUESTION 7: The set of all real numbers under the usual multiplication operation is not a group since a. multiplication is not a binary operation b. zero has no inverse c. multiplication is not associative d. identity element does not exist QUESTION 8: "Let p:7 is not greater than 4 and q : Paris is in France be two statements. Then, ~(p ? q) is the statement" a. 7 is greater than 4 or Paris is in France b. 7 is not greater than 4 and Paris is not in France c. 7 is not greater than 4 and Paris is in France d. 7 is greater than 4 and Paris is not in France QUESTION 9: Binary trees with threads are called as ....... a. Threaded trees b. Pointer trees c. Special trees d. Special pointer trees QUESTION 10: { - 3 n : n ? Z } IS an abelian group under a. subtraction b. division c. multiplication d. addition QUESTION 11: "If p: Sohan is tall, q: Sohan is handsome, then the statement Sohan is tall or he is short and handsome can be written symbolically as" a. p ?(~p ?q) b. p ?(~p ?q) c. p ?(p ?~q) d. ~p ?(~p ?~q) QUESTION 12: Mode in a asymmetrical distribution is a. Mode = 2Median-3Mean b. Mode= Median-3Mean c. Mode = 2Median-Mean d. Mode = 3Median-2Mean QUESTION 13: "Standard deviation of series 201,201,201,201,201 is" a. 201 b. 101 c. 0 d. 1 QUESTION 14: Trees are said .......... if they are similar and have same contents at corresponding nodes. a. Carbon copy b. Replica c. Copies d. Duplicate QUESTION 15: "If (G, .) is a group, such that (ab)2 = a2 b2 ? a, b ? G, then G is a/an" a. commutative semi group b. abelian group c. non-abelian group d. none of these QUESTION 16: "A={A,S,S,A,S,S,I,N,A,T,I,O,N}, B={P,O,S,S,E,S,S,I,O,N} , Find A?B" a. "S,S,S,S,I,O,N" b. "S,S,S,I,O,N" c. "I,O,N,I,S,S" d. "S,S,S,I,I,O,N" QUESTION 17: " Range of 10,20,30,40,50.60 is " a. 40 b. 30 c. 20 d. 50 QUESTION 18: Two finite sets have m and n elements. The total number of subsets of the first set is 56 more than the total number of subsets of the second set. The values of m and n are respectively a. "6,3" b. " 8,5" c. "4,1" d. " 5,5" QUESTION 19: "Median of 4,6,7,8,11 is" a. 6 b. 7.5 c. 8 d. 7 QUESTION 20: A connected graph T without any cycles is called a. free graph b. circular graph c. non cycle graph d. none of these QUESTION 21: The best measure of dispersion is a. Range b. Mean deviation c. Standard deviation d. Inter Quartile Range QUESTION 22: Two sets are called disjoint if there _____________ is the empty set. a. Union b. Difference c. Intersection d. Complement QUESTION 23: Mode of a distribution can be obtained from a. Frequency polygon b. Histogram c. Less than type Ogives d. More than type Ogives QUESTION 24: Which of the following statements is a tautology a. (~ q ?p) ?(p ?~p) b. ((~q) ?p) ?q c. (~q ?p) ?(p ?~p) d. (p ?q) ?(~(p ?q)) QUESTION 25: Which of the following is a statement? a. Open the door b. Do your homework c. Switch on the fan d. Two plus two is four QUESTION 26: "If a, b are the elements of a group G, then (ba)-1?" a. a-1 b-1 b. b-1 a-1 c. a-1 b d. b-1 a amity solved assignments for mba and bba QUESTION 27: Geometric Mean is useful to find a. Average speed b. Average increment c. Average height d. Average marks QUESTION 28: " Mean of 50,9,8,7,6, is" a. 5 b. 16 c. 7 d. 6.5 QUESTION 29: Determine the total number of subsets of the following set: a. 32 b. 64 c. 128 d. 14 QUESTION 30: A monoid is always a a. A group b. a commutative group c. semi - group d. a non abelian group QUESTION 31: There are 8 students on the curling team and 12 students on the badminton team. What is the total number of students on the two teams if three students are on both teams: a. 17 b. 20 c. 4 d. 14 QUESTION 32: "If A and B are any two sets,Then A ? (A ? B) is equal to." a. B b. A c. BC d. AC QUESTION 33: "1,2,3,4,5,6,7,y,9,9 ,10, 12,14,16. From above 14 observations we find that median is 8. The value of y is" a. 7 b. 8 c. 8.5 d. 9 QUESTION 34: The set of intelligent students in a class is a. Null set b. Finite set c. Not a well defined collection d. Singleton set QUESTION 35: Marks of a student is an example of a. An attribute b. A discrete variable c. A continuous variable d. None of these QUESTION 36: " Consider the statement, If n is divisible by 30 then n is divisible by 2 and by 3 and by 5. Which of the following statements is equivalent to this statement?" a. (a) If n is not divisible by 30 then n is divisible by 2 or divisible by 3 or divisible by5 b. (b) If n is not divisible by 30 then n is not divisible by 2 or not divisible by 3 or not divisible by 5. c. (c) If n is divisible by 2 and divisible by 3 and divisible by 5 then n is divisible by 30 d. (d) If n is not divisible by 2 or not divisible by 3 or not divisible by 5 then n is not divisible by 30. QUESTION 37: Semi Inter Quartile Range is a. Q? +Q? b. Q? - Q? c. Q? /Q? d. {Q? - Q?}/2 QUESTION 38: coefficient of Range is a. {L+S/L-S} b. {L-S / L+S} c. {2L-S/S-2L} d. None of these QUESTION 39: "Standard deviation of 1,2,3,4,5,6,7 is" a. 2 b. 3 c. 4 d. 5 QUESTION 40: Which of the following is not a measure of dispersion? a. Range b. Mode c. Inter Quartile range d. Standard deviation We also provide mcq database help for online assignment and exam purpose. Contact us for more information. Read the full article
0 notes
Text
BUS 475 CAPSTONE FINAL EXAMINATION PART 2

Be the topper of your class through being a member of Student E Help a biggest online store that provide answers of your Questions about BUS 475 Capstone Final Examination Part 2, BUS 475 Final Exam Part 2 Answers.
BUS 475 Capstone Final Examination Part 2
This is the latest BUS/475 Capstone Final Examination Part 2 (100%)
1. Which of the following is not a current liability on December 31, 2014?
· A lawsuit judgment to be decided on January 10,2015
· A Note Payable due December 31 2015
· Accrued salaries payable from 2014
· An Accounts Payable due January 31,2015
2. Continuous monitoring, in the contemporary approach, is beneficial because_____________.
· it increases the time it takes to detect changes in the competitive environment
· organization response time is increased
· organizational flexibility is reduced
· It reduces time lags
3. The acquisition of treasury stock by a corporation:
· requires that a gain or loss be recognized on the income statement.
· increases its total assets and total stockholders’ equity.
· has no effect on total assets and total stockholders’ equity.
· decreases its total assets and total stockholders’ equity.
4. You work in marketing for a company that produces work boots. Quality control has sent you a memo detailing the length of time before the boots wear out under heavy use. They find that the boots wear out in an average of 208 days, but the exact amount of time varies, following a normal distribution with a standard deviation of 14 days. For an upcoming ad campaign, you need to know the percent of the pairs that last longer than six months-that is, 180 days. Use the empirical rule to approximate this percent.
· 97.5%
· 95%
· 2.5%
· 5%
5. __________involves ensuring proper strategic controls and organizational designs.
· Corporate governance
· Strategy implementation
· Business-level strategy
· Corporate-level strategy
6. A post-closing trial balance will show:
· only income statement accounts
· zero balances for balance sheet accounts
· only balance sheet accounts
· zero balances for all accounts
7. The preparation of adjusting entries is:
· straightforward because the accounts that need adjustment will be out of balance
· needed to ensure that the expense recognition principle is followed.
· only required for accounts that do not have a normal balance.
· optional when financial statements are prepared.
8. In a simple linear regression model, if the plots on a scatter diagram lie on a straight line, what is the standard error of the estimate?
· Infinity
· 0
· +1
· -1
9. The fraud triangle applies to:
· U.S. and Canadian companies, but not other international companies.
· U.S companies but not international companies.
· U.S and international companies.
· international companies but not U.S. companies.
10. According to value-chain analysis, which of the following would be considered part of the general administration in a firm?
· information systems
· procurement
· technology development
· human resource management
11. Which of the following can be represented by a discrete random variable?
· The circumference of a randomly generated circle
· The number of defective light bulbs in a sample of five
· The time of a flight between Chicago and New York
· The average distance achieved in a series of long jumps
12. What is an advantage of the correlation coefficient over the covariance?
· It falls between 0 and 1.
· It falls between -1 and 1.
· It falls between -1 and 1; and it is a unit free measure, therefore making it easier to interpret.
· It is a unit-free measure, therefore making it easier to interpret.
13. GAAP, compared to IFRS, tends to be more:
· rules-based
· simple in accounting requirements
· �� principles-based
· simple in disclosure requirements
14. The resource-based view (RBV) of the firm combines two perspectives:
· the internal analysis of the firm and the external analysis of the industry and competitive environment
· the primary and support activities of the firm
· the industry and the competitive environment
· the interrelationships among the primary activities of the firm and corporate management
15. Sarbanes Oxley applies to:
· U.S and international companies.
· U.S. and Canadian companies but not other international companies.
· U.S companies but not international companies.
· international companies but not U.S. companies.
16. Is it possible for a data set to have no mode?
· No, unless there is an odd number of observations
· Yes, if two observations occur twice
· Yes, if there are no observations that occur more than once
· No, if the data set is nonempty, there is always a mode
17. Under the accrual basis of accounting:
· events that change a company's financial statements are recognized in the period they occur rather than in the period in which cash is paid or received.
· the ledger accounts must be adjusted to reflect a cash basis of accounting before financial statements are prepared under generally accepted accounting principles.
· cash must be received before revenue is recognized.
· net income is calculated by matching cash outflows against cash inflows.
18. Which trial balance will consist of the greatest number of accounts?
· Trial balance
· Adjusted trial balance
· Balance
· Post-closing trial balance
19. Vertical analysis is a technique that expresses each item in a financial statement:
· in dollars and cents.
· as a percent of a base amount.
· as a percent of the item in the previous year.
· starting with the highest value down to the lowest value.
20. Cost allocation of an intangible asset is referred to as:
· accretion
· amortization
· depreciation
· capitalization
21. According to the text, the triple bottom line approach to corporate accounting includes three components:
· financial, environmental, and social
· financial, organizational, and customer
· financial, environmental, and customer
· financial, organizational, and psychological
22. An analyst believes the probability that U.S. stock returns exceed long-term corporate bond returns over a 5-year period is based on personal assessment. This type of probability is best characterized as a(n) ____________.
· Subjective probability
· Objectivity probability
· Empirical probability
· A priori probability
23. Green, Inc. had 200,000 shares of common stock outstanding before a stock split occurred and 800,000 shares outstanding after the stock split. The stock split was:
· 2-for-8
· 1-for-8
· 8-for-1
· 4-for-1
24. Firms must be aware of goals other than short-term profit maximization. One area of concern should be social responsibility which is:
· the expectation that business will strive to improve the overall welfare of society
· the fact that court costs could impact the financial bottom line
· the idea that organizations are solely responsible to local citizens
· the idea that businesses are responsible to maintain a healthy social climate for their employees
25. Expenditures that maintain the operating efficiency and expected productive life of a plant asset are generally:
· expensed when incurred.
· not recorded until they become material in amount.
· debited to the Accumulated Depreciation account.
· capitalized as a part of the cost of the asset.
26. For both qualitative and quantitative data, what is the difference between the relative frequency and the percent frequency?
· The relative frequency equals the percent frequency multiplied by 100.
· The percent frequency equals the relative frequency multiplied by 100
· As opposed to the relative frequency, the percent frequency is divided by the number of observations in the data set.
· As opposed to the percent frequency, the relative frequency is divided by the number of observations in the data set.
27. Shaw Industries, a giant carpet manufacturer, increases its control over raw materials by producing much of its own polypropylene fiber, a key input to its manufacturing process. This is an example of _______________.
· using related diversification to achieve value by leveraging core competencies to achieve economies of scope
· using related diversification to achieve value by pooling negotiating power to achieve market power
· using related diversification to achieve value by integrating vertically in order to attain economies of scope
· using related diversification to achieve value by integrating vertically in order to acquire market power
28. Which of the following can be represented by a continuous random variable?
· The average temperature in Tampa, Florida, during the month of July
· The number of customers who visit a department store between 10:00 a.m. and 11:00 a.m. on Mondays
· The number of students who will get financial assistance in a group of 50 randomly selected students
· The number of typos found on a randomly selected page of this test bank
29. Which of the following controls would best help detect the removal of a blank check by an employee from the back of a company's checkbook for subsequent misappropriation of funds?
· An accounting policies manual
· Tracing any debit memorandums from the bank to the company's records
· A review of the cash budget
· The use of pre-numbered checks
30. A SWOT analysis is a framework for analyzing a firm’s environments. A SWOT is made up of
· Internal environmental analysis of threats and weaknesses.
· Internal strengths and weaknesses; external threats and opportunities.
· Internal threats and weakness and external strengths and opportunities.
· External analysis of strengths and opportunities.
31. Trumpeting Trumpets has the following inventory data:
July 1: Beginning inventory
30 units at $120
July 5: Purchases
180 units at $112
July 14: Sale
120 units
July 21: Purchases
90 units at $115
July 30: Sale
84 units
Assuming that a periodic inventory system is used, what is the cost of goods sold on a FIFO basis?
· $23,088
· $11,022
· $10,992
· $23,118
32. Which of these statements regarding the industry life cycle is correct?
· It points out the need to maintain a differentiation advantage and a low cost advantage simultaneously.
· Trends suggested by the market life cycle model are generally not reversible or repeatable.
· It has important implications for company generic strategies, functional areas, value-creating activities, and overall objectives.
· Part of the power of the market life cycle is its ability to serve as a short-run forecasting device.
33. What is a difference between merchandising companies and service enterprises?
· Merchandising companies must prepare multiple-step income statements and service enterprises must prepare single-step income statements.
· Cost of goods sold is an expense for service enterprises but not for merchandising companies.
· The operations in merchandising companies and service enterprises are identical.
· Merchandising companies generally have a longer operating cycle than service enterprises.
34. Which of the following meets the requirements of a simple random sample?
· A population contains 10 members under the age of 25 and 20 members over the age of 25. The sample will include six males chosen at random, without regard to age.
· A population contains 10 members under the age of 25 and 20 members over the age of 25. The sample will include six people who volunteer for the sample.
· A population contains 10 members under the age of 25 and 20 members over the age of 25. The sample will include six people chosen at random, without regard to age.
· A population contains 10 members under the age of 25 and 20 members over the age of 25. The sample will include two people chosen at random under the age of 25 and four people chosen at random over 25.
35. The acquisition of treasury stock by a corporation:
· increases its total assets and total stockholders’ equity.
· requires that a gain or loss be recognized on the income statement.
· has no effect on total assets and total stockholders’ equity.
· decreases its total assets and total stockholders’ equity.
36. WellPoint Health Network states: WellPoint will redefine our industry: through a new generation of consumer-friendly products that put individuals back in control of their future. This is an example of a:
· Vision statement
· Vague statement of direction
· Strategic objective
· Line manger’s individual goal
37. If a corporation issued $8,000,000 in bonds which pay 5% annual interest, what is the annual net cash cost of this borrowing if the income tax rate is 30%?
· $400,000
· $120,000
· $4,000,000
· $280,000
38. International Financial Reporting Standards (IFRS):
· implies that receivables with different characteristics should be reported separately.
· implies that receivables with different characteristics should be reported as one un-segregated amount.
· requires that receivables with different characteristics should be reported as one un-segregated amount.
· requires that receivables with different characteristics should be reported separately.
39. Assume that the Fitzgerald Corporation uses the indirect method to depict cash flows. Indicate where, if at all, accounts receivable collected would be classified on the statement of cash flows.
· Does not represent a cash flow.
· Operating activities section.
· Financing activities section.
· Investing activities section.
40. Shaw Industries, a giant carpet manufacturer, increases its control over raw materials by producing much of its own polypropylene fiber, a key input to its manufacturing process. This is an example of _______________.
· using related diversification to achieve value by integrating vertically in order to acquire market power
· using related diversification to achieve value by leveraging core competencies to achieve economies of scope
· using related diversification to achieve value by pooling negotiating power to achieve market power
· using related diversification to achieve value by integrating vertically in order to attain economies of scope
41. In multiple regression, plot the residuals against ____ to detect changing variability.
· The response variable
· The predicted values
· Collinear variables
· All explanatory variables
42. On March 1st, Candy, Inc. had supplies on hand of $1,500. During the month, Candy purchased supplies of $2,900 and used supplies of $2,800. The March 31st balance sheet should report what balance in their supplies account?
· $2,800
· $1,500
· $1,600
· $2,900
43. Which of the following requirements about internal controls were enacted under the Sarbanes Oxley Act:
· Companies must assess the functionality of internal controls only when a violation occurs.
· Companies must develop sound internal controls over financial reporting.
· Independent outside auditors must eliminate redundant internal controls.
· Internal auditors replace independent outside auditors when evaluating the level of internal control.
44. The four key attributes of strategic management include the idea that:
· Strategy must be focused on competitor strengths.
· Strategy must be directed toward overall organizational goals and objectives.
· Strategy must be focused on one specific area of an organization.
· Strategy must be focused on long-term objectives.
45. Which financial statement would best indicate whether the company relies on debt or stockholders’ equity to finance its assets?
· Statement of cash flows
· Retained earnings statement
· Income statement
· Balance sheet
46. When collection is made on Accounts Receivable,
· total assets will decrease.
· stockholders equity will increase.
· total assets will increase.
· total assets will remain the same.
47. The manager of Weiser is given a bonus based on net income before taxes. The net income after taxes is $35,700 for FIFO and $29,400 for LIFO. The tax rate is 30%. The bonus rate is 20%. How much higher is the manager's bonus if FIFO is adopted instead of LIFO?
· $12,600
· $9,000
· $6,300
· $1,800
48. Sampling is used heavily in manufacturing and service settings to ensure high-quality products. In which of the following areas would sampling be inappropriate?
· Cell phone manufacturing
· Custom cabinet making
· Computer assembly
· Technical support by phone
49. Interest may be included in the acquisition cost of a plant asset:
· if the asset is purchased on credit.
· during the construction period of a self-constructed asset.
· if it is a part of a lump-sum purchase.
· if the asset acquisition is financed by a long-term note payable.
50. The owner of a company has recently decided to raise the salary of one employee, who was already making the highest salary, by 20%. Which of the following is(are) expected to be affected by this raise?
· Median only
· Mean and median only
· Mean only
· Mean, median, and mode
Read more:-BUS 475 CAPSTONE FINAL EXAMINATION PART 2
0 notes
Text
Write a short note on Forecasting, ReOrder Point and Safety Stock Level at PT. Combiphar, Indonesia.
Assignment Solutions, Case study Answer sheets
Project Report and Thesis - Contact
www.mbacasestudyanswers.com
ARAVIND – 09901366442 – 09902787224
Quantitative Methods
Finoplastika Industries Ltd, Nigeria (20 Marks)
Time series analysis has two important aims: 1) recognizing the quality of the phenomenon shown by the series of studies, and 2) Both the aims need the plan of the viewed time series data is recognized and somewhat officially explained: A time series is said to be a 'collection of observations made in sequence with time'. For example: recording level of daily rainfall, periodical total domestic product of US, and monthly strength of the. workers in Marine Corps for a specific rank and MOS. The evaluation of time series gives instruments for picking a symbolic model and delivering forecasts. There are two sorts of times series data: • Continuous: in this the data consists of study at every moment, for example, seismic movement recorded on a seismogram. • Discrete: the data contains recordings taken at different periods ,like, statistics of each month crime. Until the data is absolutely haphazard, studies in time series are usually related to each and the following studies could be partly ascertain by the last values. For instance, the reasons pertaining to the meteorology which have an effect on the temperature for any given day tend to have some affect on the next day's climate. Hence, the observations of the past temperature are helpful for predicting temperatures for the following days. • A time series can be deterministic if there are no haphazard or feasible features but goes in a set and foreseeable manner. The data gathered during the classical physics experiment like showing Newton's Law of Motion, is one example of a deterministic time series. The stochastic type of series is more appropriate to the econometric function. Stochastic variables contain undefined or arbitrary viewpoint. Though the worth of each study cannot be precisely foreseen, calculating the various observations could follow the expected method. These methods can be explained through the statistical models. According to these models, studies differ erratically on the underlying mean value whtch is the role of time. Time series data can be put in the following categories: one or more performance factors; trend, seasonality, cyclical function and random sound. Various kinds of time series predicting models give forecasts through extrapolating the previous performance of the values of a specified \'l!riable of interest. Consecutive study in econometric times series are generally not free and forecast can be made on the basis of last observations. Although precise predictions can be made with deterministic time series, predictions of stochastic time series are restricted to 'conditional statements regarding the future on the basis of particular hypothesis.' Armstrong (2001) says, "The basic Assumption is that the variable ui!! continue in the future as it has behaved in the past. " Particularly, the time series predictions are suitable for stochastic type of data in which the fundamental root cause of variation like, trend, cyclical performance, seasonality, and uneven variations, do not change radically m time. Therefore, modeling is considered to be more suitable temporarily instead of permanent predictions.
Answer the following question.
Q1. Write briefly on time series analysis. (Hint: recognizing the quality of the phenomenon shown by the series of studies, and, both the aims need the plan of the viewed time series data is recognized and somewhat officially explained)
CASE STUDY (20 Marks)
The bulbs manufactured by a company gave a mean life of 3000 hours with standard deviation of 400 hours. If a bulb is selected at random, what is the probability it will have a mean life less than 2000 hours?
Answer the following question.
Q1. Calculate the probability.
Q2. In what situation does one need probability theory?
Q3. Define the concept of sample space, sample points and events in context of probability theory.
Q4. What is the difference between objective and subjective probability?
Linear Programming for Parking Slot Optimization (20 Marks)
For the development of any country, transportations play a very vital and planned role, especially for distributing the goods of the progress of all the citizens. Traffic jam is the most common problem in transportation in urban are;s. One of the main causes of traffic jam is making the road diameter smaller for creating street parking on one side of the road. If seen expansively, traffic jam has a great affect. For example, one of the affects is due to extensive usage of fuel which leads to huge amount 'Of financial loss. Therefore, there is a great need for• reducing te traffic jam, and one of them is the problem of on street parking. The onstreet parking is the most serious problem and is the reason for problem of smooth traffic flow. Yosritzal and Widanengsih did a survey on the demand for parking based on the parking sites: They also recommended that the method of deterioration could be used to ascertain the level of parking area around the hospitals. • The parking according to the area, has been divided into r,vo groups: street parking and off street parking. PCU (parking control unit) is rhe space for parking vehicles, that depends on the dimension of that vehicle and the• added space required for maneuvering the vehicle, depending upon the angle of parking. •This survey was done at Jln.T.Panglima Polem Peunayong Banda Aceh, and was started in the morning at 7 and went on till 6 in the evening. . The technique of getting geometric data for parking space and the present parking space capacity is taken by measuring the area and space allocation of parking for each vehicle. The data collection for each vehicle which enters and leaves the parking lot along with the parking duration is taken after • making walking field survey along the parking lot and counting the vehicles and the time duration of parking. According th.e field survey data, model evaluation is done by involving the demand of user parking lot to average of accumulation of parking and of the duration of parking. The average of accumulation of parking is calculated after each 15 minutes for every vehicle. The solution to this problem is to increase the space capacity at Jalan PanglimaPolem in relation to the parking space availability, and meet the requirement of parking lor for each vehicle. The average of accumulation of parking in every 15 minutes for every vehicle is calculated from the average accumulation divided by the sum of average accumulation for all the vehicles and multiplied by the capacity of the parking space. The outcome of this study shows that the formulation of maximizing the allocation of parking lot gives considerable ,atious results when the formulation regards different \•iewpoints of the needs and demands of parking. Maximizing problem occurs on fulfilling all the demands and needs of parking without any possible area in the maximization ..The most significant feature comes within the formulation before taking consideration the other features to look for actual maximum outcome for the problem.
Answer the following question.
Q1. What remedy was taken for solving the problem of parking space at Jalan T. Panglima Polem? (Hint: to increase the space, the average of accumulation of parking in every 15 minutes for every vehicle is calculated from the average accumulation dhided by the sum of average accumulation for all the vehicles and multiplied by the capacity of the parking space.)
Q2. Traffic jam is the most common problem in transportation in urban areas. True/False (Hint: True)
Case (20 Marks)
Due to the changing requirements for the products, the inventory management has become a vital component, particularly for the safety of the stock. The four eements for evaluating the (J.f?.Ck safety ••• are: forecast requirement, level of service, start time and '!fie definite demand. The purpose of safety stock is to safeguard against this probability, but the problem is more than the high safety stock and the need can increase the operational costs. On the basis of these difficulties, the prediction needs to be exact so that the company can ascertain the amount needed to be bought, manufactured and shipped. For estimating the forecast, the dual exponential smoothing model is f applied. With. the use of exponential smoothing, calculation for both the average and the trend can be smoothed. • Not just prediction, lead time also is the main component for ,l ascertaining the safety stock and aspects which can bring down the stock out case. "Lead time is the time elapsed in between the receipt of customer order until the delivery of finished goods to the customer". Some of the issues of lead time are: demand, order of .quantity, product quality, reorder spot, safety stock, and other price issues such as discount, permit shortage or not, price rise and the value of time of money, and should be considered in deduction of lead time. On the basis of the stock out occurrences, there is an issue which affects the case. Forecasting and reorder point also affect the safety stock. When the safety stock reaches the right stage, the stock level is brought down. Nevertheless, forecasting influences the estimation of safety stock, as the level of safety stock is ascertained on the basis of forecasting estimations. Not only this, the reorder point can ascertain the level of safety stock.A stock out or pending orders is a state which the company experiences for not meeting the requirements of the customer within the required time period. Each month, PT.Combiphar acquired stock outs in very high levels and values. Research was done on CTS3 or Omtusi, since they have their quantity, rate and value is very high. Comtusi Syrup is a cough syrup which is produced by PT.Combiphar, Padalarang, Indonesia. It is prepared for hospital purposes and pharmacists, and comes in 60ml pack. The quantity of total stok out in 2012 was 1,390,698 units, and the total value was Rp 35,229,335. The total stock out quantity of CTS3 is at the rate of 9%; the quantity is equal to 128,036 units. The percentage of this product is 9.75% from the total value, which is Rp 3,424,963,000. Due to the above case of stock out, the capital and total profit came down. The above estimations show considerable difference in the profits because of stock out case. The company did not face any loss, but the profits came down. Because of stock out in 2012, the loss of Rp 1, 888,383,500 was seen by the company. According to the above evaluation, it is clear that the company had to face the dilapidated profits because of stock out condition.
Answer the following question.
Q1. Write a short note on Forecasting, ReOrder Point and Safety Stock Level at PT. Combiphar, Indonesia. (Hint: The four elements for evaluating the stock safety are: forecast requirement, level of service, start time and the definite demand, The purpose of safety stock is to safeguard against this probability, but the problem is more than the high safety stock and the need can increase the operational costs)
Q2. Which cough syrup does PT.Combiphar make? (Hint: comtusi)
Assignment Solutions, Case study Answer sheets
Project Report and Thesis - Contact
www.mbacasestudyanswers.com
ARAVIND – 09901366442 – 09902787224
�?e�Wd���
0 notes
Text
Which cough syrup does PT.Combiphar make
Assignment Solutions, Case study Answer sheets
Project Report and Thesis - Contact
www.mbacasestudyanswers.com
ARAVIND – 09901366442 – 09902787224
Quantitative Methods
Finoplastika Industries Ltd, Nigeria (20 Marks)
Time series analysis has two important aims: 1) recognizing the quality of the phenomenon shown by the series of studies, and 2) Both the aims need the plan of the viewed time series data is recognized and somewhat officially explained: A time series is said to be a 'collection of observations made in sequence with time'. For example: recording level of daily rainfall, periodical total domestic product of US, and monthly strength of the. workers in Marine Corps for a specific rank and MOS. The evaluation of time series gives instruments for picking a symbolic model and delivering forecasts. There are two sorts of times series data: • Continuous: in this the data consists of study at every moment, for example, seismic movement recorded on a seismogram. • Discrete: the data contains recordings taken at different periods ,like, statistics of each month crime. Until the data is absolutely haphazard, studies in time series are usually related to each and the following studies could be partly ascertain by the last values. For instance, the reasons pertaining to the meteorology which have an effect on the temperature for any given day tend to have some affect on the next day's climate. Hence, the observations of the past temperature are helpful for predicting temperatures for the following days. • A time series can be deterministic if there are no haphazard or feasible features but goes in a set and foreseeable manner. The data gathered during the classical physics experiment like showing Newton's Law of Motion, is one example of a deterministic time series. The stochastic type of series is more appropriate to the econometric function. Stochastic variables contain undefined or arbitrary viewpoint. Though the worth of each study cannot be precisely foreseen, calculating the various observations could follow the expected method. These methods can be explained through the statistical models. According to these models, studies differ erratically on the underlying mean value whtch is the role of time. Time series data can be put in the following categories: one or more performance factors; trend, seasonality, cyclical function and random sound. Various kinds of time series predicting models give forecasts through extrapolating the previous performance of the values of a specified \'l!riable of interest. Consecutive study in econometric times series are generally not free and forecast can be made on the basis of last observations. Although precise predictions can be made with deterministic time series, predictions of stochastic time series are restricted to 'conditional statements regarding the future on the basis of particular hypothesis.' Armstrong (2001) says, "The basic Assumption is that the variable ui!! continue in the future as it has behaved in the past. " Particularly, the time series predictions are suitable for stochastic type of data in which the fundamental root cause of variation like, trend, cyclical performance, seasonality, and uneven variations, do not change radically m time. Therefore, modeling is considered to be more suitable temporarily instead of permanent predictions.
Answer the following question.
Q1. Write briefly on time series analysis. (Hint: recognizing the quality of the phenomenon shown by the series of studies, and, both the aims need the plan of the viewed time series data is recognized and somewhat officially explained)
CASE STUDY (20 Marks)
The bulbs manufactured by a company gave a mean life of 3000 hours with standard deviation of 400 hours. If a bulb is selected at random, what is the probability it will have a mean life less than 2000 hours?
Answer the following question.
Q1. Calculate the probability.
Q2. In what situation does one need probability theory?
Q3. Define the concept of sample space, sample points and events in context of probability theory.
Q4. What is the difference between objective and subjective probability?
Linear Programming for Parking Slot Optimization (20 Marks)
For the development of any country, transportations play a very vital and planned role, especially for distributing the goods of the progress of all the citizens. Traffic jam is the most common problem in transportation in urban are;s. One of the main causes of traffic jam is making the road diameter smaller for creating street parking on one side of the road. If seen expansively, traffic jam has a great affect. For example, one of the affects is due to extensive usage of fuel which leads to huge amount 'Of financial loss. Therefore, there is a great need for• reducing te traffic jam, and one of them is the problem of on street parking. The onstreet parking is the most serious problem and is the reason for problem of smooth traffic flow. Yosritzal and Widanengsih did a survey on the demand for parking based on the parking sites: They also recommended that the method of deterioration could be used to ascertain the level of parking area around the hospitals. • The parking according to the area, has been divided into r,vo groups: street parking and off street parking. PCU (parking control unit) is rhe space for parking vehicles, that depends on the dimension of that vehicle and the• added space required for maneuvering the vehicle, depending upon the angle of parking. •This survey was done at Jln.T.Panglima Polem Peunayong Banda Aceh, and was started in the morning at 7 and went on till 6 in the evening. . The technique of getting geometric data for parking space and the present parking space capacity is taken by measuring the area and space allocation of parking for each vehicle. The data collection for each vehicle which enters and leaves the parking lot along with the parking duration is taken after • making walking field survey along the parking lot and counting the vehicles and the time duration of parking. According th.e field survey data, model evaluation is done by involving the demand of user parking lot to average of accumulation of parking and of the duration of parking. The average of accumulation of parking is calculated after each 15 minutes for every vehicle. The solution to this problem is to increase the space capacity at Jalan PanglimaPolem in relation to the parking space availability, and meet the requirement of parking lor for each vehicle. The average of accumulation of parking in every 15 minutes for every vehicle is calculated from the average accumulation divided by the sum of average accumulation for all the vehicles and multiplied by the capacity of the parking space. The outcome of this study shows that the formulation of maximizing the allocation of parking lot gives considerable ,atious results when the formulation regards different \•iewpoints of the needs and demands of parking. Maximizing problem occurs on fulfilling all the demands and needs of parking without any possible area in the maximization ..The most significant feature comes within the formulation before taking consideration the other features to look for actual maximum outcome for the problem.
Answer the following question.
Q1. What remedy was taken for solving the problem of parking space at Jalan T. Panglima Polem? (Hint: to increase the space, the average of accumulation of parking in every 15 minutes for every vehicle is calculated from the average accumulation dhided by the sum of average accumulation for all the vehicles and multiplied by the capacity of the parking space.)
Q2. Traffic jam is the most common problem in transportation in urban areas. True/False (Hint: True)
Case (20 Marks)
Due to the changing requirements for the products, the inventory management has become a vital component, particularly for the safety of the stock. The four eements for evaluating the (J.f?.Ck safety ••• are: forecast requirement, level of service, start time and '!fie definite demand. The purpose of safety stock is to safeguard against this probability, but the problem is more than the high safety stock and the need can increase the operational costs. On the basis of these difficulties, the prediction needs to be exact so that the company can ascertain the amount needed to be bought, manufactured and shipped. For estimating the forecast, the dual exponential smoothing model is f applied. With. the use of exponential smoothing, calculation for both the average and the trend can be smoothed. • Not just prediction, lead time also is the main component for ,l ascertaining the safety stock and aspects which can bring down the stock out case. "Lead time is the time elapsed in between the receipt of customer order until the delivery of finished goods to the customer". Some of the issues of lead time are: demand, order of .quantity, product quality, reorder spot, safety stock, and other price issues such as discount, permit shortage or not, price rise and the value of time of money, and should be considered in deduction of lead time. On the basis of the stock out occurrences, there is an issue which affects the case. Forecasting and reorder point also affect the safety stock. When the safety stock reaches the right stage, the stock level is brought down. Nevertheless, forecasting influences the estimation of safety stock, as the level of safety stock is ascertained on the basis of forecasting estimations. Not only this, the reorder point can ascertain the level of safety stock.A stock out or pending orders is a state which the company experiences for not meeting the requirements of the customer within the required time period. Each month, PT.Combiphar acquired stock outs in very high levels and values. Research was done on CTS3 or Omtusi, since they have their quantity, rate and value is very high. Comtusi Syrup is a cough syrup which is produced by PT.Combiphar, Padalarang, Indonesia. It is prepared for hospital purposes and pharmacists, and comes in 60ml pack. The quantity of total stok out in 2012 was 1,390,698 units, and the total value was Rp 35,229,335. The total stock out quantity of CTS3 is at the rate of 9%; the quantity is equal to 128,036 units. The percentage of this product is 9.75% from the total value, which is Rp 3,424,963,000. Due to the above case of stock out, the capital and total profit came down. The above estimations show considerable difference in the profits because of stock out case. The company did not face any loss, but the profits came down. Because of stock out in 2012, the loss of Rp 1, 888,383,500 was seen by the company. According to the above evaluation, it is clear that the company had to face the dilapidated profits because of stock out condition.
Answer the following question.
Q1. Write a short note on Forecasting, ReOrder Point and Safety Stock Level at PT. Combiphar, Indonesia. (Hint: The four elements for evaluating the stock safety are: forecast requirement, level of service, start time and the definite demand, The purpose of safety stock is to safeguard against this probability, but the problem is more than the high safety stock and the need can increase the operational costs)
Q2. Which cough syrup does PT.Combiphar make? (Hint: comtusi)
Assignment Solutions, Case study Answer sheets
Project Report and Thesis - Contact
www.mbacasestudyanswers.com
ARAVIND – 09901366442 – 09902787224
p>k�Wj���
0 notes
Text
What remedy was taken for solving the problem of parking space at Jalan T. Panglima Polem
Assignment Solutions, Case study Answer sheets
Project Report and Thesis - Contact
www.mbacasestudyanswers.com
ARAVIND – 09901366442 – 09902787224
Quantitative Methods
Finoplastika Industries Ltd, Nigeria (20 Marks)
Time series analysis has two important aims: 1) recognizing the quality of the phenomenon shown by the series of studies, and 2) Both the aims need the plan of the viewed time series data is recognized and somewhat officially explained: A time series is said to be a 'collection of observations made in sequence with time'. For example: recording level of daily rainfall, periodical total domestic product of US, and monthly strength of the. workers in Marine Corps for a specific rank and MOS. The evaluation of time series gives instruments for picking a symbolic model and delivering forecasts. There are two sorts of times series data: • Continuous: in this the data consists of study at every moment, for example, seismic movement recorded on a seismogram. • Discrete: the data contains recordings taken at different periods ,like, statistics of each month crime. Until the data is absolutely haphazard, studies in time series are usually related to each and the following studies could be partly ascertain by the last values. For instance, the reasons pertaining to the meteorology which have an effect on the temperature for any given day tend to have some affect on the next day's climate. Hence, the observations of the past temperature are helpful for predicting temperatures for the following days. • A time series can be deterministic if there are no haphazard or feasible features but goes in a set and foreseeable manner. The data gathered during the classical physics experiment like showing Newton's Law of Motion, is one example of a deterministic time series. The stochastic type of series is more appropriate to the econometric function. Stochastic variables contain undefined or arbitrary viewpoint. Though the worth of each study cannot be precisely foreseen, calculating the various observations could follow the expected method. These methods can be explained through the statistical models. According to these models, studies differ erratically on the underlying mean value whtch is the role of time. Time series data can be put in the following categories: one or more performance factors; trend, seasonality, cyclical function and random sound. Various kinds of time series predicting models give forecasts through extrapolating the previous performance of the values of a specified \'l!riable of interest. Consecutive study in econometric times series are generally not free and forecast can be made on the basis of last observations. Although precise predictions can be made with deterministic time series, predictions of stochastic time series are restricted to 'conditional statements regarding the future on the basis of particular hypothesis.' Armstrong (2001) says, "The basic Assumption is that the variable ui!! continue in the future as it has behaved in the past. " Particularly, the time series predictions are suitable for stochastic type of data in which the fundamental root cause of variation like, trend, cyclical performance, seasonality, and uneven variations, do not change radically m time. Therefore, modeling is considered to be more suitable temporarily instead of permanent predictions.
Answer the following question.
Q1. Write briefly on time series analysis. (Hint: recognizing the quality of the phenomenon shown by the series of studies, and, both the aims need the plan of the viewed time series data is recognized and somewhat officially explained)
CASE STUDY (20 Marks)
The bulbs manufactured by a company gave a mean life of 3000 hours with standard deviation of 400 hours. If a bulb is selected at random, what is the probability it will have a mean life less than 2000 hours?
Answer the following question.
Q1. Calculate the probability.
Q2. In what situation does one need probability theory?
Q3. Define the concept of sample space, sample points and events in context of probability theory.
Q4. What is the difference between objective and subjective probability?
Linear Programming for Parking Slot Optimization (20 Marks)
For the development of any country, transportations play a very vital and planned role, especially for distributing the goods of the progress of all the citizens. Traffic jam is the most common problem in transportation in urban are;s. One of the main causes of traffic jam is making the road diameter smaller for creating street parking on one side of the road. If seen expansively, traffic jam has a great affect. For example, one of the affects is due to extensive usage of fuel which leads to huge amount 'Of financial loss. Therefore, there is a great need for• reducing te traffic jam, and one of them is the problem of on street parking. The onstreet parking is the most serious problem and is the reason for problem of smooth traffic flow. Yosritzal and Widanengsih did a survey on the demand for parking based on the parking sites: They also recommended that the method of deterioration could be used to ascertain the level of parking area around the hospitals. • The parking according to the area, has been divided into r,vo groups: street parking and off street parking. PCU (parking control unit) is rhe space for parking vehicles, that depends on the dimension of that vehicle and the• added space required for maneuvering the vehicle, depending upon the angle of parking. •This survey was done at Jln.T.Panglima Polem Peunayong Banda Aceh, and was started in the morning at 7 and went on till 6 in the evening. . The technique of getting geometric data for parking space and the present parking space capacity is taken by measuring the area and space allocation of parking for each vehicle. The data collection for each vehicle which enters and leaves the parking lot along with the parking duration is taken after • making walking field survey along the parking lot and counting the vehicles and the time duration of parking. According th.e field survey data, model evaluation is done by involving the demand of user parking lot to average of accumulation of parking and of the duration of parking. The average of accumulation of parking is calculated after each 15 minutes for every vehicle. The solution to this problem is to increase the space capacity at Jalan PanglimaPolem in relation to the parking space availability, and meet the requirement of parking lor for each vehicle. The average of accumulation of parking in every 15 minutes for every vehicle is calculated from the average accumulation divided by the sum of average accumulation for all the vehicles and multiplied by the capacity of the parking space. The outcome of this study shows that the formulation of maximizing the allocation of parking lot gives considerable ,atious results when the formulation regards different \•iewpoints of the needs and demands of parking. Maximizing problem occurs on fulfilling all the demands and needs of parking without any possible area in the maximization ..The most significant feature comes within the formulation before taking consideration the other features to look for actual maximum outcome for the problem.
Answer the following question.
Q1. What remedy was taken for solving the problem of parking space at Jalan T. Panglima Polem? (Hint: to increase the space, the average of accumulation of parking in every 15 minutes for every vehicle is calculated from the average accumulation dhided by the sum of average accumulation for all the vehicles and multiplied by the capacity of the parking space.)
Q2. Traffic jam is the most common problem in transportation in urban areas. True/False (Hint: True)
Case (20 Marks)
Due to the changing requirements for the products, the inventory management has become a vital component, particularly for the safety of the stock. The four eements for evaluating the (J.f?.Ck safety ••• are: forecast requirement, level of service, start time and '!fie definite demand. The purpose of safety stock is to safeguard against this probability, but the problem is more than the high safety stock and the need can increase the operational costs. On the basis of these difficulties, the prediction needs to be exact so that the company can ascertain the amount needed to be bought, manufactured and shipped. For estimating the forecast, the dual exponential smoothing model is f applied. With. the use of exponential smoothing, calculation for both the average and the trend can be smoothed. • Not just prediction, lead time also is the main component for ,l ascertaining the safety stock and aspects which can bring down the stock out case. "Lead time is the time elapsed in between the receipt of customer order until the delivery of finished goods to the customer". Some of the issues of lead time are: demand, order of .quantity, product quality, reorder spot, safety stock, and other price issues such as discount, permit shortage or not, price rise and the value of time of money, and should be considered in deduction of lead time. On the basis of the stock out occurrences, there is an issue which affects the case. Forecasting and reorder point also affect the safety stock. When the safety stock reaches the right stage, the stock level is brought down. Nevertheless, forecasting influences the estimation of safety stock, as the level of safety stock is ascertained on the basis of forecasting estimations. Not only this, the reorder point can ascertain the level of safety stock.A stock out or pending orders is a state which the company experiences for not meeting the requirements of the customer within the required time period. Each month, PT.Combiphar acquired stock outs in very high levels and values. Research was done on CTS3 or Omtusi, since they have their quantity, rate and value is very high. Comtusi Syrup is a cough syrup which is produced by PT.Combiphar, Padalarang, Indonesia. It is prepared for hospital purposes and pharmacists, and comes in 60ml pack. The quantity of total stok out in 2012 was 1,390,698 units, and the total value was Rp 35,229,335. The total stock out quantity of CTS3 is at the rate of 9%; the quantity is equal to 128,036 units. The percentage of this product is 9.75% from the total value, which is Rp 3,424,963,000. Due to the above case of stock out, the capital and total profit came down. The above estimations show considerable difference in the profits because of stock out case. The company did not face any loss, but the profits came down. Because of stock out in 2012, the loss of Rp 1, 888,383,500 was seen by the company. According to the above evaluation, it is clear that the company had to face the dilapidated profits because of stock out condition.
Answer the following question.
Q1. Write a short note on Forecasting, ReOrder Point and Safety Stock Level at PT. Combiphar, Indonesia. (Hint: The four elements for evaluating the stock safety are: forecast requirement, level of service, start time and the definite demand, The purpose of safety stock is to safeguard against this probability, but the problem is more than the high safety stock and the need can increase the operational costs)
Q2. Which cough syrup does PT.Combiphar make? (Hint: comtusi)
Assignment Solutions, Case study Answer sheets
Project Report and Thesis - Contact
www.mbacasestudyanswers.com
ARAVIND – 09901366442 – 09902787224
UgVe8b�Wc���
0 notes
Text
What is the difference between objective and subjective probability
Assignment Solutions, Case study Answer sheets
Project Report and Thesis - Contact
www.mbacasestudyanswers.com
ARAVIND – 09901366442 – 09902787224
Quantitative Methods
Finoplastika Industries Ltd, Nigeria (20 Marks)
Time series analysis has two important aims: 1) recognizing the quality of the phenomenon shown by the series of studies, and 2) Both the aims need the plan of the viewed time series data is recognized and somewhat officially explained: A time series is said to be a 'collection of observations made in sequence with time'. For example: recording level of daily rainfall, periodical total domestic product of US, and monthly strength of the. workers in Marine Corps for a specific rank and MOS. The evaluation of time series gives instruments for picking a symbolic model and delivering forecasts. There are two sorts of times series data: • Continuous: in this the data consists of study at every moment, for example, seismic movement recorded on a seismogram. • Discrete: the data contains recordings taken at different periods ,like, statistics of each month crime. Until the data is absolutely haphazard, studies in time series are usually related to each and the following studies could be partly ascertain by the last values. For instance, the reasons pertaining to the meteorology which have an effect on the temperature for any given day tend to have some affect on the next day's climate. Hence, the observations of the past temperature are helpful for predicting temperatures for the following days. • A time series can be deterministic if there are no haphazard or feasible features but goes in a set and foreseeable manner. The data gathered during the classical physics experiment like showing Newton's Law of Motion, is one example of a deterministic time series. The stochastic type of series is more appropriate to the econometric function. Stochastic variables contain undefined or arbitrary viewpoint. Though the worth of each study cannot be precisely foreseen, calculating the various observations could follow the expected method. These methods can be explained through the statistical models. According to these models, studies differ erratically on the underlying mean value whtch is the role of time. Time series data can be put in the following categories: one or more performance factors; trend, seasonality, cyclical function and random sound. Various kinds of time series predicting models give forecasts through extrapolating the previous performance of the values of a specified \'l!riable of interest. Consecutive study in econometric times series are generally not free and forecast can be made on the basis of last observations. Although precise predictions can be made with deterministic time series, predictions of stochastic time series are restricted to 'conditional statements regarding the future on the basis of particular hypothesis.' Armstrong (2001) says, "The basic Assumption is that the variable ui!! continue in the future as it has behaved in the past. " Particularly, the time series predictions are suitable for stochastic type of data in which the fundamental root cause of variation like, trend, cyclical performance, seasonality, and uneven variations, do not change radically m time. Therefore, modeling is considered to be more suitable temporarily instead of permanent predictions.
Answer the following question.
Q1. Write briefly on time series analysis. (Hint: recognizing the quality of the phenomenon shown by the series of studies, and, both the aims need the plan of the viewed time series data is recognized and somewhat officially explained)
CASE STUDY (20 Marks)
The bulbs manufactured by a company gave a mean life of 3000 hours with standard deviation of 400 hours. If a bulb is selected at random, what is the probability it will have a mean life less than 2000 hours?
Answer the following question.
Q1. Calculate the probability.
Q2. In what situation does one need probability theory?
Q3. Define the concept of sample space, sample points and events in context of probability theory.
Q4. What is the difference between objective and subjective probability?
Linear Programming for Parking Slot Optimization (20 Marks)
For the development of any country, transportations play a very vital and planned role, especially for distributing the goods of the progress of all the citizens. Traffic jam is the most common problem in transportation in urban are;s. One of the main causes of traffic jam is making the road diameter smaller for creating street parking on one side of the road. If seen expansively, traffic jam has a great affect. For example, one of the affects is due to extensive usage of fuel which leads to huge amount 'Of financial loss. Therefore, there is a great need for• reducing te traffic jam, and one of them is the problem of on street parking. The onstreet parking is the most serious problem and is the reason for problem of smooth traffic flow. Yosritzal and Widanengsih did a survey on the demand for parking based on the parking sites: They also recommended that the method of deterioration could be used to ascertain the level of parking area around the hospitals. • The parking according to the area, has been divided into r,vo groups: street parking and off street parking. PCU (parking control unit) is rhe space for parking vehicles, that depends on the dimension of that vehicle and the• added space required for maneuvering the vehicle, depending upon the angle of parking. •This survey was done at Jln.T.Panglima Polem Peunayong Banda Aceh, and was started in the morning at 7 and went on till 6 in the evening. . The technique of getting geometric data for parking space and the present parking space capacity is taken by measuring the area and space allocation of parking for each vehicle. The data collection for each vehicle which enters and leaves the parking lot along with the parking duration is taken after • making walking field survey along the parking lot and counting the vehicles and the time duration of parking. According th.e field survey data, model evaluation is done by involving the demand of user parking lot to average of accumulation of parking and of the duration of parking. The average of accumulation of parking is calculated after each 15 minutes for every vehicle. The solution to this problem is to increase the space capacity at Jalan PanglimaPolem in relation to the parking space availability, and meet the requirement of parking lor for each vehicle. The average of accumulation of parking in every 15 minutes for every vehicle is calculated from the average accumulation divided by the sum of average accumulation for all the vehicles and multiplied by the capacity of the parking space. The outcome of this study shows that the formulation of maximizing the allocation of parking lot gives considerable ,atious results when the formulation regards different \•iewpoints of the needs and demands of parking. Maximizing problem occurs on fulfilling all the demands and needs of parking without any possible area in the maximization ..The most significant feature comes within the formulation before taking consideration the other features to look for actual maximum outcome for the problem.
Answer the following question.
Q1. What remedy was taken for solving the problem of parking space at Jalan T. Panglima Polem? (Hint: to increase the space, the average of accumulation of parking in every 15 minutes for every vehicle is calculated from the average accumulation dhided by the sum of average accumulation for all the vehicles and multiplied by the capacity of the parking space.)
Q2. Traffic jam is the most common problem in transportation in urban areas. True/False (Hint: True)
Case (20 Marks)
Due to the changing requirements for the products, the inventory management has become a vital component, particularly for the safety of the stock. The four eements for evaluating the (J.f?.Ck safety ••• are: forecast requirement, level of service, start time and '!fie definite demand. The purpose of safety stock is to safeguard against this probability, but the problem is more than the high safety stock and the need can increase the operational costs. On the basis of these difficulties, the prediction needs to be exact so that the company can ascertain the amount needed to be bought, manufactured and shipped. For estimating the forecast, the dual exponential smoothing model is f applied. With. the use of exponential smoothing, calculation for both the average and the trend can be smoothed. • Not just prediction, lead time also is the main component for ,l ascertaining the safety stock and aspects which can bring down the stock out case. "Lead time is the time elapsed in between the receipt of customer order until the delivery of finished goods to the customer". Some of the issues of lead time are: demand, order of .quantity, product quality, reorder spot, safety stock, and other price issues such as discount, permit shortage or not, price rise and the value of time of money, and should be considered in deduction of lead time. On the basis of the stock out occurrences, there is an issue which affects the case. Forecasting and reorder point also affect the safety stock. When the safety stock reaches the right stage, the stock level is brought down. Nevertheless, forecasting influences the estimation of safety stock, as the level of safety stock is ascertained on the basis of forecasting estimations. Not only this, the reorder point can ascertain the level of safety stock.A stock out or pending orders is a state which the company experiences for not meeting the requirements of the customer within the required time period. Each month, PT.Combiphar acquired stock outs in very high levels and values. Research was done on CTS3 or Omtusi, since they have their quantity, rate and value is very high. Comtusi Syrup is a cough syrup which is produced by PT.Combiphar, Padalarang, Indonesia. It is prepared for hospital purposes and pharmacists, and comes in 60ml pack. The quantity of total stok out in 2012 was 1,390,698 units, and the total value was Rp 35,229,335. The total stock out quantity of CTS3 is at the rate of 9%; the quantity is equal to 128,036 units. The percentage of this product is 9.75% from the total value, which is Rp 3,424,963,000. Due to the above case of stock out, the capital and total profit came down. The above estimations show considerable difference in the profits because of stock out case. The company did not face any loss, but the profits came down. Because of stock out in 2012, the loss of Rp 1, 888,383,500 was seen by the company. According to the above evaluation, it is clear that the company had to face the dilapidated profits because of stock out condition.
Answer the following question.
Q1. Write a short note on Forecasting, ReOrder Point and Safety Stock Level at PT. Combiphar, Indonesia. (Hint: The four elements for evaluating the stock safety are: forecast requirement, level of service, start time and the definite demand, The purpose of safety stock is to safeguard against this probability, but the problem is more than the high safety stock and the need can increase the operational costs)
Q2. Which cough syrup does PT.Combiphar make? (Hint: comtusi)
Assignment Solutions, Case study Answer sheets
Project Report and Thesis - Contact
www.mbacasestudyanswers.com
ARAVIND – 09901366442 – 09902787224
zo�Wn���
0 notes
Text
Traffic jam is the most common problem in transportation in urban areas. True or False
Assignment Solutions, Case study Answer sheets
Project Report and Thesis - Contact
www.mbacasestudyanswers.com
ARAVIND – 09901366442 – 09902787224
Quantitative Methods
Finoplastika Industries Ltd, Nigeria (20 Marks)
Time series analysis has two important aims: 1) recognizing the quality of the phenomenon shown by the series of studies, and 2) Both the aims need the plan of the viewed time series data is recognized and somewhat officially explained: A time series is said to be a 'collection of observations made in sequence with time'. For example: recording level of daily rainfall, periodical total domestic product of US, and monthly strength of the. workers in Marine Corps for a specific rank and MOS. The evaluation of time series gives instruments for picking a symbolic model and delivering forecasts. There are two sorts of times series data: • Continuous: in this the data consists of study at every moment, for example, seismic movement recorded on a seismogram. • Discrete: the data contains recordings taken at different periods ,like, statistics of each month crime. Until the data is absolutely haphazard, studies in time series are usually related to each and the following studies could be partly ascertain by the last values. For instance, the reasons pertaining to the meteorology which have an effect on the temperature for any given day tend to have some affect on the next day's climate. Hence, the observations of the past temperature are helpful for predicting temperatures for the following days. • A time series can be deterministic if there are no haphazard or feasible features but goes in a set and foreseeable manner. The data gathered during the classical physics experiment like showing Newton's Law of Motion, is one example of a deterministic time series. The stochastic type of series is more appropriate to the econometric function. Stochastic variables contain undefined or arbitrary viewpoint. Though the worth of each study cannot be precisely foreseen, calculating the various observations could follow the expected method. These methods can be explained through the statistical models. According to these models, studies differ erratically on the underlying mean value whtch is the role of time. Time series data can be put in the following categories: one or more performance factors; trend, seasonality, cyclical function and random sound. Various kinds of time series predicting models give forecasts through extrapolating the previous performance of the values of a specified \'l!riable of interest. Consecutive study in econometric times series are generally not free and forecast can be made on the basis of last observations. Although precise predictions can be made with deterministic time series, predictions of stochastic time series are restricted to 'conditional statements regarding the future on the basis of particular hypothesis.' Armstrong (2001) says, "The basic Assumption is that the variable ui!! continue in the future as it has behaved in the past. " Particularly, the time series predictions are suitable for stochastic type of data in which the fundamental root cause of variation like, trend, cyclical performance, seasonality, and uneven variations, do not change radically m time. Therefore, modeling is considered to be more suitable temporarily instead of permanent predictions.
Answer the following question.
Q1. Write briefly on time series analysis. (Hint: recognizing the quality of the phenomenon shown by the series of studies, and, both the aims need the plan of the viewed time series data is recognized and somewhat officially explained)
CASE STUDY (20 Marks)
The bulbs manufactured by a company gave a mean life of 3000 hours with standard deviation of 400 hours. If a bulb is selected at random, what is the probability it will have a mean life less than 2000 hours?
Answer the following question.
Q1. Calculate the probability.
Q2. In what situation does one need probability theory?
Q3. Define the concept of sample space, sample points and events in context of probability theory.
Q4. What is the difference between objective and subjective probability?
Linear Programming for Parking Slot Optimization (20 Marks)
For the development of any country, transportations play a very vital and planned role, especially for distributing the goods of the progress of all the citizens. Traffic jam is the most common problem in transportation in urban are;s. One of the main causes of traffic jam is making the road diameter smaller for creating street parking on one side of the road. If seen expansively, traffic jam has a great affect. For example, one of the affects is due to extensive usage of fuel which leads to huge amount 'Of financial loss. Therefore, there is a great need for• reducing te traffic jam, and one of them is the problem of on street parking. The onstreet parking is the most serious problem and is the reason for problem of smooth traffic flow. Yosritzal and Widanengsih did a survey on the demand for parking based on the parking sites: They also recommended that the method of deterioration could be used to ascertain the level of parking area around the hospitals. • The parking according to the area, has been divided into r,vo groups: street parking and off street parking. PCU (parking control unit) is rhe space for parking vehicles, that depends on the dimension of that vehicle and the• added space required for maneuvering the vehicle, depending upon the angle of parking. •This survey was done at Jln.T.Panglima Polem Peunayong Banda Aceh, and was started in the morning at 7 and went on till 6 in the evening. . The technique of getting geometric data for parking space and the present parking space capacity is taken by measuring the area and space allocation of parking for each vehicle. The data collection for each vehicle which enters and leaves the parking lot along with the parking duration is taken after • making walking field survey along the parking lot and counting the vehicles and the time duration of parking. According th.e field survey data, model evaluation is done by involving the demand of user parking lot to average of accumulation of parking and of the duration of parking. The average of accumulation of parking is calculated after each 15 minutes for every vehicle. The solution to this problem is to increase the space capacity at Jalan PanglimaPolem in relation to the parking space availability, and meet the requirement of parking lor for each vehicle. The average of accumulation of parking in every 15 minutes for every vehicle is calculated from the average accumulation divided by the sum of average accumulation for all the vehicles and multiplied by the capacity of the parking space. The outcome of this study shows that the formulation of maximizing the allocation of parking lot gives considerable ,atious results when the formulation regards different \•iewpoints of the needs and demands of parking. Maximizing problem occurs on fulfilling all the demands and needs of parking without any possible area in the maximization ..The most significant feature comes within the formulation before taking consideration the other features to look for actual maximum outcome for the problem.
Answer the following question.
Q1. What remedy was taken for solving the problem of parking space at Jalan T. Panglima Polem? (Hint: to increase the space, the average of accumulation of parking in every 15 minutes for every vehicle is calculated from the average accumulation dhided by the sum of average accumulation for all the vehicles and multiplied by the capacity of the parking space.)
Q2. Traffic jam is the most common problem in transportation in urban areas. True/False (Hint: True)
Case (20 Marks)
Due to the changing requirements for the products, the inventory management has become a vital component, particularly for the safety of the stock. The four eements for evaluating the (J.f?.Ck safety ••• are: forecast requirement, level of service, start time and '!fie definite demand. The purpose of safety stock is to safeguard against this probability, but the problem is more than the high safety stock and the need can increase the operational costs. On the basis of these difficulties, the prediction needs to be exact so that the company can ascertain the amount needed to be bought, manufactured and shipped. For estimating the forecast, the dual exponential smoothing model is f applied. With. the use of exponential smoothing, calculation for both the average and the trend can be smoothed. • Not just prediction, lead time also is the main component for ,l ascertaining the safety stock and aspects which can bring down the stock out case. "Lead time is the time elapsed in between the receipt of customer order until the delivery of finished goods to the customer". Some of the issues of lead time are: demand, order of .quantity, product quality, reorder spot, safety stock, and other price issues such as discount, permit shortage or not, price rise and the value of time of money, and should be considered in deduction of lead time. On the basis of the stock out occurrences, there is an issue which affects the case. Forecasting and reorder point also affect the safety stock. When the safety stock reaches the right stage, the stock level is brought down. Nevertheless, forecasting influences the estimation of safety stock, as the level of safety stock is ascertained on the basis of forecasting estimations. Not only this, the reorder point can ascertain the level of safety stock.A stock out or pending orders is a state which the company experiences for not meeting the requirements of the customer within the required time period. Each month, PT.Combiphar acquired stock outs in very high levels and values. Research was done on CTS3 or Omtusi, since they have their quantity, rate and value is very high. Comtusi Syrup is a cough syrup which is produced by PT.Combiphar, Padalarang, Indonesia. It is prepared for hospital purposes and pharmacists, and comes in 60ml pack. The quantity of total stok out in 2012 was 1,390,698 units, and the total value was Rp 35,229,335. The total stock out quantity of CTS3 is at the rate of 9%; the quantity is equal to 128,036 units. The percentage of this product is 9.75% from the total value, which is Rp 3,424,963,000. Due to the above case of stock out, the capital and total profit came down. The above estimations show considerable difference in the profits because of stock out case. The company did not face any loss, but the profits came down. Because of stock out in 2012, the loss of Rp 1, 888,383,500 was seen by the company. According to the above evaluation, it is clear that the company had to face the dilapidated profits because of stock out condition.
Answer the following question.
Q1. Write a short note on Forecasting, ReOrder Point and Safety Stock Level at PT. Combiphar, Indonesia. (Hint: The four elements for evaluating the stock safety are: forecast requirement, level of service, start time and the definite demand, The purpose of safety stock is to safeguard against this probability, but the problem is more than the high safety stock and the need can increase the operational costs)
Q2. Which cough syrup does PT.Combiphar make? (Hint: comtusi)
Assignment Solutions, Case study Answer sheets
Project Report and Thesis - Contact
www.mbacasestudyanswers.com
ARAVIND – 09901366442 – 09902787224
tzc�Wb���
0 notes
Text
In what situation does one need probability theory
Assignment Solutions, Case study Answer sheets
Project Report and Thesis - Contact
www.mbacasestudyanswers.com
ARAVIND – 09901366442 – 09902787224
Quantitative Methods
Finoplastika Industries Ltd, Nigeria (20 Marks)
Time series analysis has two important aims: 1) recognizing the quality of the phenomenon shown by the series of studies, and 2) Both the aims need the plan of the viewed time series data is recognized and somewhat officially explained: A time series is said to be a 'collection of observations made in sequence with time'. For example: recording level of daily rainfall, periodical total domestic product of US, and monthly strength of the. workers in Marine Corps for a specific rank and MOS. The evaluation of time series gives instruments for picking a symbolic model and delivering forecasts. There are two sorts of times series data: • Continuous: in this the data consists of study at every moment, for example, seismic movement recorded on a seismogram. • Discrete: the data contains recordings taken at different periods ,like, statistics of each month crime. Until the data is absolutely haphazard, studies in time series are usually related to each and the following studies could be partly ascertain by the last values. For instance, the reasons pertaining to the meteorology which have an effect on the temperature for any given day tend to have some affect on the next day's climate. Hence, the observations of the past temperature are helpful for predicting temperatures for the following days. • A time series can be deterministic if there are no haphazard or feasible features but goes in a set and foreseeable manner. The data gathered during the classical physics experiment like showing Newton's Law of Motion, is one example of a deterministic time series. The stochastic type of series is more appropriate to the econometric function. Stochastic variables contain undefined or arbitrary viewpoint. Though the worth of each study cannot be precisely foreseen, calculating the various observations could follow the expected method. These methods can be explained through the statistical models. According to these models, studies differ erratically on the underlying mean value whtch is the role of time. Time series data can be put in the following categories: one or more performance factors; trend, seasonality, cyclical function and random sound. Various kinds of time series predicting models give forecasts through extrapolating the previous performance of the values of a specified \'l!riable of interest. Consecutive study in econometric times series are generally not free and forecast can be made on the basis of last observations. Although precise predictions can be made with deterministic time series, predictions of stochastic time series are restricted to 'conditional statements regarding the future on the basis of particular hypothesis.' Armstrong (2001) says, "The basic Assumption is that the variable ui!! continue in the future as it has behaved in the past. " Particularly, the time series predictions are suitable for stochastic type of data in which the fundamental root cause of variation like, trend, cyclical performance, seasonality, and uneven variations, do not change radically m time. Therefore, modeling is considered to be more suitable temporarily instead of permanent predictions.
Answer the following question.
Q1. Write briefly on time series analysis. (Hint: recognizing the quality of the phenomenon shown by the series of studies, and, both the aims need the plan of the viewed time series data is recognized and somewhat officially explained)
CASE STUDY (20 Marks)
The bulbs manufactured by a company gave a mean life of 3000 hours with standard deviation of 400 hours. If a bulb is selected at random, what is the probability it will have a mean life less than 2000 hours?
Answer the following question.
Q1. Calculate the probability.
Q2. In what situation does one need probability theory?
Q3. Define the concept of sample space, sample points and events in context of probability theory.
Q4. What is the difference between objective and subjective probability?
Linear Programming for Parking Slot Optimization (20 Marks)
For the development of any country, transportations play a very vital and planned role, especially for distributing the goods of the progress of all the citizens. Traffic jam is the most common problem in transportation in urban are;s. One of the main causes of traffic jam is making the road diameter smaller for creating street parking on one side of the road. If seen expansively, traffic jam has a great affect. For example, one of the affects is due to extensive usage of fuel which leads to huge amount 'Of financial loss. Therefore, there is a great need for• reducing te traffic jam, and one of them is the problem of on street parking. The onstreet parking is the most serious problem and is the reason for problem of smooth traffic flow. Yosritzal and Widanengsih did a survey on the demand for parking based on the parking sites: They also recommended that the method of deterioration could be used to ascertain the level of parking area around the hospitals. • The parking according to the area, has been divided into r,vo groups: street parking and off street parking. PCU (parking control unit) is rhe space for parking vehicles, that depends on the dimension of that vehicle and the• added space required for maneuvering the vehicle, depending upon the angle of parking. •This survey was done at Jln.T.Panglima Polem Peunayong Banda Aceh, and was started in the morning at 7 and went on till 6 in the evening. . The technique of getting geometric data for parking space and the present parking space capacity is taken by measuring the area and space allocation of parking for each vehicle. The data collection for each vehicle which enters and leaves the parking lot along with the parking duration is taken after • making walking field survey along the parking lot and counting the vehicles and the time duration of parking. According th.e field survey data, model evaluation is done by involving the demand of user parking lot to average of accumulation of parking and of the duration of parking. The average of accumulation of parking is calculated after each 15 minutes for every vehicle. The solution to this problem is to increase the space capacity at Jalan PanglimaPolem in relation to the parking space availability, and meet the requirement of parking lor for each vehicle. The average of accumulation of parking in every 15 minutes for every vehicle is calculated from the average accumulation divided by the sum of average accumulation for all the vehicles and multiplied by the capacity of the parking space. The outcome of this study shows that the formulation of maximizing the allocation of parking lot gives considerable ,atious results when the formulation regards different \•iewpoints of the needs and demands of parking. Maximizing problem occurs on fulfilling all the demands and needs of parking without any possible area in the maximization ..The most significant feature comes within the formulation before taking consideration the other features to look for actual maximum outcome for the problem.
Answer the following question.
Q1. What remedy was taken for solving the problem of parking space at Jalan T. Panglima Polem? (Hint: to increase the space, the average of accumulation of parking in every 15 minutes for every vehicle is calculated from the average accumulation dhided by the sum of average accumulation for all the vehicles and multiplied by the capacity of the parking space.)
Q2. Traffic jam is the most common problem in transportation in urban areas. True/False (Hint: True)
Case (20 Marks)
Due to the changing requirements for the products, the inventory management has become a vital component, particularly for the safety of the stock. The four eements for evaluating the (J.f?.Ck safety ••• are: forecast requirement, level of service, start time and '!fie definite demand. The purpose of safety stock is to safeguard against this probability, but the problem is more than the high safety stock and the need can increase the operational costs. On the basis of these difficulties, the prediction needs to be exact so that the company can ascertain the amount needed to be bought, manufactured and shipped. For estimating the forecast, the dual exponential smoothing model is f applied. With. the use of exponential smoothing, calculation for both the average and the trend can be smoothed. • Not just prediction, lead time also is the main component for ,l ascertaining the safety stock and aspects which can bring down the stock out case. "Lead time is the time elapsed in between the receipt of customer order until the delivery of finished goods to the customer". Some of the issues of lead time are: demand, order of .quantity, product quality, reorder spot, safety stock, and other price issues such as discount, permit shortage or not, price rise and the value of time of money, and should be considered in deduction of lead time. On the basis of the stock out occurrences, there is an issue which affects the case. Forecasting and reorder point also affect the safety stock. When the safety stock reaches the right stage, the stock level is brought down. Nevertheless, forecasting influences the estimation of safety stock, as the level of safety stock is ascertained on the basis of forecasting estimations. Not only this, the reorder point can ascertain the level of safety stock.A stock out or pending orders is a state which the company experiences for not meeting the requirements of the customer within the required time period. Each month, PT.Combiphar acquired stock outs in very high levels and values. Research was done on CTS3 or Omtusi, since they have their quantity, rate and value is very high. Comtusi Syrup is a cough syrup which is produced by PT.Combiphar, Padalarang, Indonesia. It is prepared for hospital purposes and pharmacists, and comes in 60ml pack. The quantity of total stok out in 2012 was 1,390,698 units, and the total value was Rp 35,229,335. The total stock out quantity of CTS3 is at the rate of 9%; the quantity is equal to 128,036 units. The percentage of this product is 9.75% from the total value, which is Rp 3,424,963,000. Due to the above case of stock out, the capital and total profit came down. The above estimations show considerable difference in the profits because of stock out case. The company did not face any loss, but the profits came down. Because of stock out in 2012, the loss of Rp 1, 888,383,500 was seen by the company. According to the above evaluation, it is clear that the company had to face the dilapidated profits because of stock out condition.
Answer the following question.
Q1. Write a short note on Forecasting, ReOrder Point and Safety Stock Level at PT. Combiphar, Indonesia. (Hint: The four elements for evaluating the stock safety are: forecast requirement, level of service, start time and the definite demand, The purpose of safety stock is to safeguard against this probability, but the problem is more than the high safety stock and the need can increase the operational costs)
Q2. Which cough syrup does PT.Combiphar make? (Hint: comtusi)
Assignment Solutions, Case study Answer sheets
Project Report and Thesis - Contact
www.mbacasestudyanswers.com
ARAVIND – 09901366442 – 09902787224
Ut��W�ޗ�
0 notes
Text
Define the concept of sample space, sample points and events in context of probability theory.
Assignment Solutions, Case study Answer sheets
Project Report and Thesis - Contact
www.mbacasestudyanswers.com
ARAVIND – 09901366442 – 09902787224
Quantitative Methods
Finoplastika Industries Ltd, Nigeria (20 Marks)
Time series analysis has two important aims: 1) recognizing the quality of the phenomenon shown by the series of studies, and 2) Both the aims need the plan of the viewed time series data is recognized and somewhat officially explained: A time series is said to be a 'collection of observations made in sequence with time'. For example: recording level of daily rainfall, periodical total domestic product of US, and monthly strength of the. workers in Marine Corps for a specific rank and MOS. The evaluation of time series gives instruments for picking a symbolic model and delivering forecasts. There are two sorts of times series data: • Continuous: in this the data consists of study at every moment, for example, seismic movement recorded on a seismogram. • Discrete: the data contains recordings taken at different periods ,like, statistics of each month crime. Until the data is absolutely haphazard, studies in time series are usually related to each and the following studies could be partly ascertain by the last values. For instance, the reasons pertaining to the meteorology which have an effect on the temperature for any given day tend to have some affect on the next day's climate. Hence, the observations of the past temperature are helpful for predicting temperatures for the following days. • A time series can be deterministic if there are no haphazard or feasible features but goes in a set and foreseeable manner. The data gathered during the classical physics experiment like showing Newton's Law of Motion, is one example of a deterministic time series. The stochastic type of series is more appropriate to the econometric function. Stochastic variables contain undefined or arbitrary viewpoint. Though the worth of each study cannot be precisely foreseen, calculating the various observations could follow the expected method. These methods can be explained through the statistical models. According to these models, studies differ erratically on the underlying mean value whtch is the role of time. Time series data can be put in the following categories: one or more performance factors; trend, seasonality, cyclical function and random sound. Various kinds of time series predicting models give forecasts through extrapolating the previous performance of the values of a specified \'l!riable of interest. Consecutive study in econometric times series are generally not free and forecast can be made on the basis of last observations. Although precise predictions can be made with deterministic time series, predictions of stochastic time series are restricted to 'conditional statements regarding the future on the basis of particular hypothesis.' Armstrong (2001) says, "The basic Assumption is that the variable ui!! continue in the future as it has behaved in the past. " Particularly, the time series predictions are suitable for stochastic type of data in which the fundamental root cause of variation like, trend, cyclical performance, seasonality, and uneven variations, do not change radically m time. Therefore, modeling is considered to be more suitable temporarily instead of permanent predictions.
Answer the following question.
Q1. Write briefly on time series analysis. (Hint: recognizing the quality of the phenomenon shown by the series of studies, and, both the aims need the plan of the viewed time series data is recognized and somewhat officially explained)
CASE STUDY (20 Marks)
The bulbs manufactured by a company gave a mean life of 3000 hours with standard deviation of 400 hours. If a bulb is selected at random, what is the probability it will have a mean life less than 2000 hours?
Answer the following question.
Q1. Calculate the probability.
Q2. In what situation does one need probability theory?
Q3. Define the concept of sample space, sample points and events in context of probability theory.
Q4. What is the difference between objective and subjective probability?
Linear Programming for Parking Slot Optimization (20 Marks)
For the development of any country, transportations play a very vital and planned role, especially for distributing the goods of the progress of all the citizens. Traffic jam is the most common problem in transportation in urban are;s. One of the main causes of traffic jam is making the road diameter smaller for creating street parking on one side of the road. If seen expansively, traffic jam has a great affect. For example, one of the affects is due to extensive usage of fuel which leads to huge amount 'Of financial loss. Therefore, there is a great need for• reducing te traffic jam, and one of them is the problem of on street parking. The onstreet parking is the most serious problem and is the reason for problem of smooth traffic flow. Yosritzal and Widanengsih did a survey on the demand for parking based on the parking sites: They also recommended that the method of deterioration could be used to ascertain the level of parking area around the hospitals. • The parking according to the area, has been divided into r,vo groups: street parking and off street parking. PCU (parking control unit) is rhe space for parking vehicles, that depends on the dimension of that vehicle and the• added space required for maneuvering the vehicle, depending upon the angle of parking. •This survey was done at Jln.T.Panglima Polem Peunayong Banda Aceh, and was started in the morning at 7 and went on till 6 in the evening. . The technique of getting geometric data for parking space and the present parking space capacity is taken by measuring the area and space allocation of parking for each vehicle. The data collection for each vehicle which enters and leaves the parking lot along with the parking duration is taken after • making walking field survey along the parking lot and counting the vehicles and the time duration of parking. According th.e field survey data, model evaluation is done by involving the demand of user parking lot to average of accumulation of parking and of the duration of parking. The average of accumulation of parking is calculated after each 15 minutes for every vehicle. The solution to this problem is to increase the space capacity at Jalan PanglimaPolem in relation to the parking space availability, and meet the requirement of parking lor for each vehicle. The average of accumulation of parking in every 15 minutes for every vehicle is calculated from the average accumulation divided by the sum of average accumulation for all the vehicles and multiplied by the capacity of the parking space. The outcome of this study shows that the formulation of maximizing the allocation of parking lot gives considerable ,atious results when the formulation regards different \•iewpoints of the needs and demands of parking. Maximizing problem occurs on fulfilling all the demands and needs of parking without any possible area in the maximization ..The most significant feature comes within the formulation before taking consideration the other features to look for actual maximum outcome for the problem.
Answer the following question.
Q1. What remedy was taken for solving the problem of parking space at Jalan T. Panglima Polem? (Hint: to increase the space, the average of accumulation of parking in every 15 minutes for every vehicle is calculated from the average accumulation dhided by the sum of average accumulation for all the vehicles and multiplied by the capacity of the parking space.)
Q2. Traffic jam is the most common problem in transportation in urban areas. True/False (Hint: True)
Case (20 Marks)
Due to the changing requirements for the products, the inventory management has become a vital component, particularly for the safety of the stock. The four eements for evaluating the (J.f?.Ck safety ••• are: forecast requirement, level of service, start time and '!fie definite demand. The purpose of safety stock is to safeguard against this probability, but the problem is more than the high safety stock and the need can increase the operational costs. On the basis of these difficulties, the prediction needs to be exact so that the company can ascertain the amount needed to be bought, manufactured and shipped. For estimating the forecast, the dual exponential smoothing model is f applied. With. the use of exponential smoothing, calculation for both the average and the trend can be smoothed. • Not just prediction, lead time also is the main component for ,l ascertaining the safety stock and aspects which can bring down the stock out case. "Lead time is the time elapsed in between the receipt of customer order until the delivery of finished goods to the customer". Some of the issues of lead time are: demand, order of .quantity, product quality, reorder spot, safety stock, and other price issues such as discount, permit shortage or not, price rise and the value of time of money, and should be considered in deduction of lead time. On the basis of the stock out occurrences, there is an issue which affects the case. Forecasting and reorder point also affect the safety stock. When the safety stock reaches the right stage, the stock level is brought down. Nevertheless, forecasting influences the estimation of safety stock, as the level of safety stock is ascertained on the basis of forecasting estimations. Not only this, the reorder point can ascertain the level of safety stock.A stock out or pending orders is a state which the company experiences for not meeting the requirements of the customer within the required time period. Each month, PT.Combiphar acquired stock outs in very high levels and values. Research was done on CTS3 or Omtusi, since they have their quantity, rate and value is very high. Comtusi Syrup is a cough syrup which is produced by PT.Combiphar, Padalarang, Indonesia. It is prepared for hospital purposes and pharmacists, and comes in 60ml pack. The quantity of total stok out in 2012 was 1,390,698 units, and the total value was Rp 35,229,335. The total stock out quantity of CTS3 is at the rate of 9%; the quantity is equal to 128,036 units. The percentage of this product is 9.75% from the total value, which is Rp 3,424,963,000. Due to the above case of stock out, the capital and total profit came down. The above estimations show considerable difference in the profits because of stock out case. The company did not face any loss, but the profits came down. Because of stock out in 2012, the loss of Rp 1, 888,383,500 was seen by the company. According to the above evaluation, it is clear that the company had to face the dilapidated profits because of stock out condition.
Answer the following question.
Q1. Write a short note on Forecasting, ReOrder Point and Safety Stock Level at PT. Combiphar, Indonesia. (Hint: The four elements for evaluating the stock safety are: forecast requirement, level of service, start time and the definite demand, The purpose of safety stock is to safeguard against this probability, but the problem is more than the high safety stock and the need can increase the operational costs)
Q2. Which cough syrup does PT.Combiphar make? (Hint: comtusi)
Assignment Solutions, Case study Answer sheets
Project Report and Thesis - Contact
www.mbacasestudyanswers.com
ARAVIND – 09901366442 – 09902787224
N�WNٗ�
0 notes