#Data transformation
Explore tagged Tumblr posts
Visit Tumblr Blog
Explore Tumblr blogs with no restrictions, modern design and the best experience.
Last Seen Tumblr Blogs


Fun Fact
The Tumblr office adopted Tommy, an 11-year-old Pomeranian.
Text
Maximizing Report Creation: A Comparison of Power BI and Tableau Migration
Introduction: The Evolution of Business Intelligence
In the fast-paced business world, data visualization plays a pivotal role in driving strategic decisions. The choice of a business intelligence (BI) tool significantly impacts how organizations analyze and present their data. With technology continuously evolving, staying ahead with cutting-edge BI solutions is crucial for maintaining a competitive edge.
If you are currently using Tableau but are considering a switch to Power BI, you may be wondering whether it’s worth the effort. In this blog, we’ll guide you through the transition process, explore the key advantages of Power BI, and highlight best practices to ensure a smooth migration.
Data Source Connection: New Beginnings vs. Existing Connections
Building from Scratch: In Power BI, starting fresh with report creation means establishing new data connections.
Migration from Tableau: During migration, you connect to the pre-existing data sources that were used in Tableau, ensuring continuity and reducing the need for data reconfiguration.
Rebuilding in Power BI: Replication vs. New Creation
Building from Scratch: Creating reports from scratch allows full customization of visualizations and structure without constraints from existing designs, giving greater creative freedom.
Migration from Tableau: Migration requires replicating Tableau’s reports and visualizations, often involving reverse-engineering the work done in Tableau to rebuild similar dashboards and reports in Power BI.
Read More about Why Move from Tableau to Power BI: Key Benefits Explained
Translating Logic: Adapting Tableau’s Logic to DAX in Power BI
Building from Scratch: When creating reports from scratch, you have the flexibility to design new calculations using Power BI’s DAX language.
Migration from Tableau: One of the most intricate parts of migration is converting Tableau’s calculated fields and logic into Power BI’s DAX language, ensuring that functionality is retained while adapting to Power BI’s unique environment.
Styling and Formatting: Matching the Look vs. Redesigning from Scratch
Building from Scratch: Rebuilding reports in Power BI from scratch allows for more flexibility, offering a fresh, modern design aligned with current brand aesthetics and business needs.
Migration from Tableau: During migration, it’s often necessary to match the style and design of Tableau reports to ensure a consistent user experience.
Migration Challenges: Balancing Consistency and Flexibility
Building from Scratch: Starting fresh presents no challenges in maintaining consistency with previous designs but allows for full creative control.
Migration from Tableau: The migration process is more challenging than building from scratch, as it requires careful attention to replicating Tableau’s functionality and design to ensure the Power BI reports mirror the original in both appearance and performance.
Post-Migration Support: Ensuring a Smooth Transition to Power BI
Once the migration from Tableau to Power BI is complete, providing comprehensive post-migration support is vital to ensuring a smooth transition. This includes offering training sessions, preparing documentation that outlines the differences between Tableau and Power BI, and establishing dedicated channels for users to ask questions or report issues. These efforts will facilitate user adoption and ensure the transition to Power BI is both successful and sustainable.
Know more about Tableau to Power BI: Save Costs & Gain AI-Driven Insights
Key Considerations for Migrating from Tableau to Power BI
Calculated Columns and Measures: Understanding the Differences
Tableau: Tableau’s calculated fields enable users to perform a wide variety of in-platform calculations and dynamic analysis, creating new metrics and applying complex formulas.
Power BI: Power BI uses measures for similar functionality but requires translating Tableau’s logic into Power BI’s DAX language, which might involve some fine-tuning to maintain consistency.
Chart Creation: A Shift from Modularity to Flexibility
Tableau: Tableau uses a modular approach where each chart resides in a separate worksheet. This makes it easier to analyze individual visualizations but requires more effort to manage multiple charts.
Power BI: Power BI allows multiple charts to be placed on a single page for efficient comparison and analysis, offering greater flexibility and ease of comparison within a unified workspace.
Both Power BI and Tableau provide powerful charting capabilities. Power BI’s design allows for dynamic and interconnected visualizations, while Tableau’s modular approach emphasizes individual analysis of specific datasets.
Why Choose Acuvate?
At Acuvate, we help businesses seamlessly transition their BI tools to stay ahead in today’s data-driven world. As a trusted Microsoft partner, we ensure efficiency, security, and governance in analytics modernization.
Try our migration calculator: Seamlessly Transition from Tableau to Power BI with Acuvate
How Acuvate Supports Your Power BI Migration
1. Efficient Migration Strategy
Migrating from Tableau to Power BI can be complex, but Acuvate streamlines the process. Unlike traditional BI firms, we leverage automation and best practices to accelerate migration with minimal disruption.
2. Faster Adoption with Self-Service Analytics
Power BI empowers business users with self-service analytics. Acuvate ensures teams can independently create reports while maintaining data security and governance.
3. Seamless Microsoft Integration
As a Microsoft Solutions Partner, we integrate Power BI with Office 365, Azure, and Dynamics 365 to enhance insights and decision-making.
4. Scalable and Cost-Effective Solutions
We offer flexible managed services for security compliance, data governance, and ongoing support tailored to your business needs.
5. Cutting-Edge BI Technologies
Acuvate stays ahead of BI trends, collaborating closely with Microsoft to bring the latest innovations to our clients.
6. Reliable Support & Maintenance
Beyond migration, we ensure your Power BI environment remains optimized with continuous support and performance tuning.
7. Accelerated Data Transformation
Acuvate enhances Power BI migration with AcuWeave, our advanced Microsoft Fabric accelerator. AcuWeave streamlines data ingestion, transformation, and modeling, ensuring faster insights and seamless integration with your existing BI ecosystem.
Get Started with Acuvate Today
Whether you need a full-scale migration or phased transition, Acuvate is here to guide you. Contact us to leverage Power BI for smarter insights and decision automation.
Conclusion: Unlock the Power of Advanced BI
As businesses strive for smarter analytics and improved decision-making, Power BI emerges as a powerful alternative to Tableau. Its deep integration with Microsoft products, cost efficiency, and user-friendly experience make it an excellent choice for organizations looking to enhance their BI strategy.
With a structured migration approach and best practices in place, transitioning from Tableau to Power BI can be a game-changer for your business. Don’t hesitate to make the switch and unlock new insights to drive your company forward!
Ready to migrate? Reach out to our experts today and take the first step towards an optimized business intelligence experience with Power BI.
#powerbi#automation#tableau#migration#power bi solutions#Data visualization#data modeling#data governance#Migration tool#data transformation
0 notes
Text
Kalodata's Innovative Revenue Source Shop Analytics
I am excited to share insights about Kalodata and its exceptional revenue source shop analytics features. Since its inception, Kalodata has been at the forefront of transforming how businesses leverage data for growth. Their analytics tools provide deep insights into customer behavior and sales trends, enabling businesses to make informed decisions.
Kalodata's shop analytics is designed to empower entrepreneurs and retailers, helping them understand what drives their sales and how to optimize their revenue streams. With user-friendly dashboards and real-time data, users can easily track performance and identify new opportunities.
In a rapidly changing market, having access to reliable analytics is crucial, and Kalodata is committed to providing innovative solutions that help businesses thrive. I am proud to be a part of this journey and excited to see how Kalodata continues to lead the way in the platform industry.
#entrepreneurs#customer behavior#real-time data#business growth#retailers#data transformation#revenue source
0 notes
Text
0 notes
Text

By 2025, data will fuel 80% of business decisions. Is YOUR organization ready? Unlock the future of data transformation with actionable insights to: ✅ Turn raw data into strategic gold. ✅ Future-proof your analytics. ✅ Outpace competitors in the AI era. �� Dive into USDSI’s Definitive 2025 Guide to master the art of data transformation—before it’s too late! 🔗 https://bit.ly/4hcC8nm
0 notes
Text

Data transformation is essential for businesses aiming to unlock the full potential of their data. Our latest blog explores how this process goes beyond mere data collection, preparation, and storage—it’s about embedding data-driven insights into every decision and operation. Discover how data transformation can elevate your business to truly become “data-driven."
0 notes
Text
Big Data vs. Traditional Data: Understanding the Differences and When to Use Python

In the evolving landscape of data science, understanding the nuances between big data and traditional data is crucial. Both play pivotal roles in analytics, but their characteristics, processing methods, and use cases differ significantly. Python, a powerful and versatile programming language, has become an indispensable tool for handling both types of data. This blog will explore the differences between big data and traditional data and explain when to use Python, emphasizing the importance of enrolling in a data science training program to master these skills.
What is Traditional Data?
Traditional data refers to structured data typically stored in relational databases and managed using SQL (Structured Query Language). This data is often transactional and includes records such as sales transactions, customer information, and inventory levels.
Characteristics of Traditional Data:
Structured Format: Traditional data is organized in a structured format, usually in rows and columns within relational databases.
Manageable Volume: The volume of traditional data is relatively small and manageable, often ranging from gigabytes to terabytes.
Fixed Schema: The schema, or structure, of traditional data is predefined and consistent, making it easy to query and analyze.
Use Cases of Traditional Data:
Transaction Processing: Traditional data is used for transaction processing in industries like finance and retail, where accurate and reliable records are essential.
Customer Relationship Management (CRM): Businesses use traditional data to manage customer relationships, track interactions, and analyze customer behavior.
Inventory Management: Traditional data is used to monitor and manage inventory levels, ensuring optimal stock levels and efficient supply chain operations.
What is Big Data?
Big data refers to extremely large and complex datasets that cannot be managed and processed using traditional database systems. It encompasses structured, unstructured, and semi-structured data from various sources, including social media, sensors, and log files.
Characteristics of Big Data:
Volume: Big data involves vast amounts of data, often measured in petabytes or exabytes.
Velocity: Big data is generated at high speed, requiring real-time or near-real-time processing.
Variety: Big data comes in diverse formats, including text, images, videos, and sensor data.
Veracity: Big data can be noisy and uncertain, requiring advanced techniques to ensure data quality and accuracy.
Use Cases of Big Data:
Predictive Analytics: Big data is used for predictive analytics in fields like healthcare, finance, and marketing, where it helps forecast trends and behaviors.
IoT (Internet of Things): Big data from IoT devices is used to monitor and analyze physical systems, such as smart cities, industrial machines, and connected vehicles.
Social Media Analysis: Big data from social media platforms is analyzed to understand user sentiments, trends, and behavior patterns.
Python: The Versatile Tool for Data Science
Python has emerged as the go-to programming language for data science due to its simplicity, versatility, and robust ecosystem of libraries and frameworks. Whether dealing with traditional data or big data, Python provides powerful tools and techniques to analyze and visualize data effectively.
Python for Traditional Data:
Pandas: The Pandas library in Python is ideal for handling traditional data. It offers data structures like DataFrames that facilitate easy manipulation, analysis, and visualization of structured data.
SQLAlchemy: Python's SQLAlchemy library provides a powerful toolkit for working with relational databases, allowing seamless integration with SQL databases for querying and data manipulation.
Python for Big Data:
PySpark: PySpark, the Python API for Apache Spark, is designed for big data processing. It enables distributed computing and parallel processing, making it suitable for handling large-scale datasets.
Dask: Dask is a flexible parallel computing library in Python that scales from single machines to large clusters, making it an excellent choice for big data analytics.
When to Use Python for Data Science
Understanding when to use Python for different types of data is crucial for effective data analysis and decision-making.
Traditional Data:
Business Analytics: Use Python for traditional data analytics in business scenarios, such as sales forecasting, customer segmentation, and financial analysis. Python's libraries, like Pandas and Matplotlib, offer comprehensive tools for these tasks.
Data Cleaning and Transformation: Python is highly effective for data cleaning and transformation, ensuring that traditional data is accurate, consistent, and ready for analysis.
Big Data:
Real-Time Analytics: When dealing with real-time data streams from IoT devices or social media platforms, Python's integration with big data frameworks like Apache Spark enables efficient processing and analysis.
Large-Scale Machine Learning: For large-scale machine learning projects, Python's compatibility with libraries like TensorFlow and PyTorch, combined with big data processing tools, makes it an ideal choice.
The Importance of Data Science Training Programs
To effectively navigate the complexities of both traditional data and big data, it is essential to acquire the right skills and knowledge. Data science training programs provide comprehensive education and hands-on experience in data science tools and techniques.
Comprehensive Curriculum: Data science training programs cover a wide range of topics, including data analysis, machine learning, big data processing, and data visualization, ensuring a well-rounded education.
Practical Experience: These programs emphasize practical learning through projects and case studies, allowing students to apply theoretical knowledge to real-world scenarios.
Expert Guidance: Experienced instructors and industry mentors offer valuable insights and support, helping students master the complexities of data science.
Career Opportunities: Graduates of data science training programs are in high demand across various industries, with opportunities to work on innovative projects and drive data-driven decision-making.
Conclusion
Understanding the differences between big data and traditional data is fundamental for any aspiring data scientist. While traditional data is structured, manageable, and used for transaction processing, big data is vast, varied, and requires advanced tools for real-time processing and analysis. Python, with its robust ecosystem of libraries and frameworks, is an indispensable tool for handling both types of data effectively.
Enrolling in a data science training program equips you with the skills and knowledge needed to navigate the complexities of data science. Whether you're working with traditional data or big data, mastering Python and other data science tools will enable you to extract valuable insights and drive innovation in your field. Start your journey today and unlock the potential of data science with a comprehensive training program.
#Big Data#Traditional Data#Data Science#Python Programming#Data Analysis#Machine Learning#Predictive Analytics#Data Science Training Program#SQL#Data Visualization#Business Analytics#Real-Time Analytics#IoT Data#Data Transformation
0 notes
Text
Mastering Data Transformation: Understanding Big Data Transformation Tools
In today's data-driven world, the ability to transform raw data into meaningful insights is paramount. This process, known as data transformation, is crucial for extracting value from vast amounts of information. Whether you're a data scientist, business analyst, or IT professional, understanding data transformation and the tools available is essential. In this blog, we'll delve into what data transformation entails, explore some of the leading big data transformation tools, and discuss their importance in modern analytics.

What is Data Transformation?
Data transformation involves converting data from one format or structure into another to prepare it for analysis, storage, or presentation. This process is fundamental as raw data often comes in disparate formats, lacks consistency, or requires aggregation before meaningful insights can be extracted. Key tasks in data transformation include:
Cleaning and Validation: Identifying and rectifying errors, inconsistencies, or missing values in the data.
Normalization: Ensuring data conforms to a standard format or structure.
Aggregation: Combining data from multiple sources into a single dataset for analysis.
Integration: Merging different datasets to create a comprehensive view.
Data transformation ensures that data is accurate, reliable, and ready for analysis, enabling organizations to make informed decisions based on trustworthy information.
Importance of Data Transformation
Effective data transformation is critical for several reasons:
Enhanced Data Quality: By cleaning and standardizing data, organizations can trust the accuracy of their analytics.
Improved Decision-Making: Transformed data provides insights that drive strategic decisions and operational improvements.
Operational Efficiency: Automation of transformation processes reduces manual effort and speeds up analysis.
Regulatory Compliance: Ensuring data meets regulatory requirements through proper transformation processes.
Big Data Transformation Tools
As data volumes continue to grow exponentially, traditional methods of data transformation struggle to keep pace. Big data transformation tools are designed to handle the complexities and scale of modern datasets efficiently. Let's explore some prominent tools in this space:
1. Apache Spark
Apache Spark is a powerful open-source framework for distributed data processing. It provides libraries for various tasks including SQL, machine learning, graph processing, and streaming. Spark's DataFrame API facilitates scalable data transformation operations such as filtering, aggregating, and joining datasets. Its in-memory processing capability makes it suitable for handling large-scale data transformation tasks with speed and efficiency.
2. Apache Hadoop
Apache Hadoop is another widely used framework for distributed storage and processing of large datasets. It includes components like HDFS (Hadoop Distributed File System) for storage and MapReduce for parallel processing of data. Hadoop ecosystem tools such as Apache Hive and Apache Pig enable data transformation tasks through high-level query languages (HiveQL and Pig Latin) that abstract complex processing tasks into simpler commands.
3. Talend
Talend is an open-source data integration platform that offers capabilities for data transformation, data integration, and data quality. It provides a graphical interface for designing data transformation workflows, making it accessible to users with varying technical backgrounds. Talend supports integration with various data sources and targets, including cloud-based solutions, making it a versatile choice for organizations looking to streamline their data transformation processes.
4. Informatica PowerCenter
Informatica PowerCenter is a leading enterprise data integration platform that includes robust data transformation capabilities. It supports both traditional on-premises and cloud-based data integration scenarios, offering features such as data profiling, cleansing, and transformation. PowerCenter's visual development environment allows developers to design complex data transformation workflows using a drag-and-drop interface, enhancing productivity and reducing time-to-insight.
5. Apache NiFi
Apache NiFi is an easy-to-use, powerful data integration and dataflow automation tool that excels in handling real-time data streams. It provides a visual interface for designing data pipelines and supports data transformation tasks through a variety of processors. NiFi's flow-based programming model allows for the creation of complex data transformation workflows with built-in support for scalability and fault tolerance.
Choosing the Right Tool
Selecting the right big data transformation tool depends on various factors such as:
Scalability: Ability to handle large volumes of data efficiently.
Ease of Use: Intuitive interfaces that streamline development and maintenance.
Integration Capabilities: Support for diverse data sources and destinations.
Performance: Processing speed and optimization for different types of transformations.
Organizations should evaluate their specific requirements and infrastructure considerations when choosing a tool that aligns with their data transformation needs.
Conclusion
In conclusion, data transformation is a cornerstone of modern analytics, enabling organizations to derive valuable insights from their data assets. Big data transformation tools play a crucial role in simplifying and scaling this process, allowing businesses to process large volumes of data efficiently and effectively. Whether leveraging Apache Spark's distributed computing power or Talend's intuitive interface, choosing the right tool is essential for maximizing the value of data transformation efforts. As data continues to grow in complexity and volume, investing in robust data transformation tools will be key to staying competitive in the digital era.
By mastering data transformation and harnessing the capabilities of big data transformation tools, organizations can unlock the full potential of their data assets and drive innovation across industries.
0 notes
Text
Creating an Effective Power BI Dashboard: A Comprehensive Guide

Introduction to Power BI Power BI is a suite of business analytics tools that allows you to connect to multiple data sources, transform data into actionable insights, and share those insights across your organization. With Power BI, you can create interactive dashboards and reports that provide a 360-degree view of your business.
Step-by-Step Guide to Creating a Power BI Dashboard
1. Data Import and Transformation The first step in creating a Power BI dashboard is importing your data. Power BI supports various data sources, including Excel, SQL Server, Azure, and more.
Steps to Import Data:
Open Power BI Desktop.
Click on Get Data in the Home ribbon.
Select your data source (e.g., Excel, SQL Server, etc.).
Load the data into Power BI.
Once the data is loaded, you may need to transform it to suit your reporting needs. Power BI provides Power Query Editor for data transformation.
Data Transformation:
Open Power Query Editor.
Apply necessary transformations such as filtering rows, adding columns, merging tables, etc.
Close and apply the changes.
2. Designing the Dashboard After preparing your data, the next step is to design your dashboard. Start by adding a new report and selecting the type of visualization you want to use.
Types of Visualizations:
Charts: Bar, Line, Pie, Area, etc.
Tables and Matrices: For detailed data representation.
Maps: Geographic data visualization.
Cards and Gauges: For key metrics and KPIs.
Slicers: For interactive data filtering.
Adding Visualizations:
Drag and drop fields from the Fields pane to the canvas.
Choose the appropriate visualization type from the Visualizations pane.
Customize the visual by adjusting properties such as colors, labels, and titles.
3. Enhancing the Dashboard with Interactivity Interactivity is one of the key features of Power BI dashboards. You can add slicers, drill-throughs, and bookmarks to make your dashboard more interactive and user-friendly.
Using Slicers:
Add a slicer visual to the canvas.
Drag a field to the slicer to allow users to filter data dynamically.
Drill-throughs:
Enable drill-through on visuals to allow users to navigate to detailed reports.
Set up drill-through pages by defining the fields that will trigger the drill-through.
Bookmarks:
Create bookmarks to capture the state of a report page.
Use bookmarks to toggle between different views of the data.

Different Styles of Power BI Dashboards Power BI dashboards can be styled to meet various business needs. Here are a few examples:
1. Executive Dashboard An executive dashboard provides a high-level overview of key business metrics. It typically includes:
KPI visuals for critical metrics.
Line charts for trend analysis.
Bar charts for categorical comparison.
Maps for geographic insights.
Example:
KPI cards for revenue, profit margin, and customer satisfaction.
A line chart showing monthly sales trends.
A bar chart comparing sales by region.
A map highlighting sales distribution across different states.
2. Sales Performance Dashboard A sales performance dashboard focuses on sales data, providing insights into sales trends, product performance, and sales team effectiveness.
Example:
A funnel chart showing the sales pipeline stages.
A bar chart displaying sales by product category.
A scatter plot highlighting the performance of sales representatives.
A table showing detailed sales transactions.
3. Financial Dashboard A financial dashboard offers a comprehensive view of the financial health of an organization. It includes:
Financial KPIs such as revenue, expenses, and profit.
Financial statements like income statement and balance sheet.
Trend charts for revenue and expenses.
Pie charts for expense distribution.
Example:
KPI cards for net income, operating expenses, and gross margin.
A line chart showing monthly revenue and expense trends.
A pie chart illustrating the breakdown of expenses.
A matrix displaying the income statement.
Best Practices for Designing Power BI Dashboards To ensure your Power BI dashboard is effective and user-friendly, follow these best practices:
Keep it Simple:
Avoid cluttering the dashboard with too many visuals.
Focus on the most important metrics and insights.
2. Use Consistent Design:
Maintain a consistent color scheme and font style.
Align visuals properly for a clean layout.
3. Ensure Data Accuracy:
Validate your data to ensure accuracy.
Regularly update the data to reflect the latest information.
4. Enhance Interactivity:
Use slicers and drill-throughs to provide a dynamic user experience.
Add tooltips to provide additional context.
5. Optimize Performance:
Use aggregations and data reduction techniques to improve performance.
Avoid using too many complex calculations.
Conclusion Creating a Power BI dashboard involves importing and transforming data, designing interactive visuals, and applying best practices to ensure clarity and effectiveness. By following the steps outlined in this guide, you can build dashboards that provide valuable insights and support data-driven decision-making in your organization. Power BI’s flexibility and range of visualizations make it an essential tool for any business looking to leverage its data effectively.
#Dynamic Data Visualization#Business Analytics#Interactive Dashboards#Data Insights#Data Transformation#KPI Metrics#Real-time Reporting#Data Connectivity#Trend Analysis#Visual Analytics#Performance Metrics#Data Modeling#Executive Dashboards#Sales Performance#Financial Reporting#Data Interactivity#Data-driven Decisions#Power Query#Custom Visuals#Data Integration
0 notes
Text
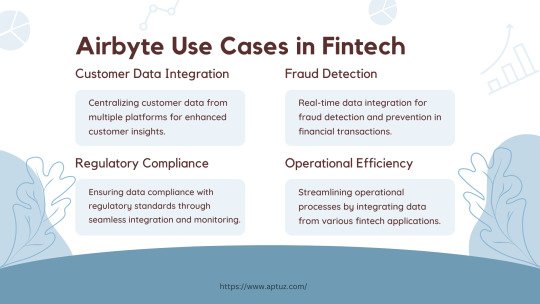
Explore the impactful use cases of Airbyte in the fintech industry, from centralizing customer data for enhanced insights to real-time fraud detection and ensuring regulatory compliance. Learn how Airbyte drives operational efficiency by streamlining data integration across various fintech applications, providing businesses with actionable insights and improved processes.
Know more at: https://bit.ly/3UbqGyT
#Fintech#data analytics#data engineering#technology#Airbyte#ETL#ELT#Cloud data#Data Integration#Data Transformation#Data management#Data extraction#Data Loading#Tech videos
0 notes
Text

Explore the essential steps in data preprocessing for AI projects with our informative guide. This simplified overview breaks down the key processes involved in preparing data for machine learning tasks, ensuring better model performance and accuracy. Perfect for anyone embarking on AI projects. Stay informed with Softlabs Group for more insightful content on advanced technologies.
#Data collection#Encoding categorical variables#Data transformation#Data splitting#Data normalization
0 notes
Text
Transform and unlock the power of your data with our top-notch Data Transformation services at In2in Global. Contact us to learn more about our innovative solutions.
0 notes
Text
#Azure Data Factory#azure data factory interview questions#adf interview question#azure data engineer interview question#pyspark#sql#sql interview questions#pyspark interview questions#Data Integration#Cloud Data Warehousing#ETL#ELT#Data Pipelines#Data Orchestration#Data Engineering#Microsoft Azure#Big Data Integration#Data Transformation#Data Migration#Data Lakes#Azure Synapse Analytics#Data Processing#Data Modeling#Batch Processing#Data Governance
1 note
·
View note
Text

So. I went online and bought this Transformers generations Blurr toy and holy shit nothing prepared me for the lore on the back of it’s box o_o
Also every time Blurr gets to be a sniper my soul ascends a little bit~
+ Bonus doodles

#maccadam#transformers#blurr#tf blurr#I’m pretty sure the figure comes with one or two big ass riffles#the box has them at least#I already have two drifts now I need two Blurrs#Eventually I will get second Jazz im pretty sure ahahaha#ALSO. LISTEN. THIS. VERSION OF BLURR IS SO FUCKING COOL#Delivering super secret data and sniping his enemies???#Being all fast and chatty and also INCREDIBLY patient and focused when needed#that right here is Spec Ops material if I ever saw one#fucking. imAGINe. Decepticons have freaking Soundwave on their side. Soundwave can catch any signal and transmission and call and data#the solution#Yeah no just give the most important data to Blurr and use him like a pigeon for delivering messages#good luck hacking this Soundwave
1K notes
·
View notes
Text
TacticAI: Leveraging AI to Elevate Football Coaching and Strategy
New Post has been published on https://thedigitalinsider.com/tacticai-leveraging-ai-to-elevate-football-coaching-and-strategy/
TacticAI: Leveraging AI to Elevate Football Coaching and Strategy
Football, also known as soccer, stands out as one of the most widely enjoyed sports globally. Beyond the physical skills displayed on the field, it’s the strategic nuances that bring depth and excitement to the game. As former German football striker Lukas Podolsky famously remarked, “Football is like chess, but without the dice.”
DeepMind, known for its expertise in strategic gaming with successes in Chess and Go, has partnered with Liverpool FC to introduce TacticAI. This AI system is designed to support football coaches and strategists in refining game strategies, focusing specifically on optimizing corner kicks – a crucial aspect of football gameplay.
In this article, we’ll take a closer look at TacticAI, exploring how this innovative technology is developed to enhance football coaching and strategy analysis. TacticAI utilizes geometric deep learning and graph neural networks (GNNs) as its foundational AI components. These components will be introduced before delving into the inner workings of TacticAI and its transformative impact on football strategy and beyond.
Geometric Deep Learning and Graph Neural Networks
Geometric Deep Learning (GDL) is a specialized branch of artificial intelligence (AI) and machine learning (ML) focused on learning from structured or unstructured geometric data, such as graphs and networks that have inherent spatial relationships.
Graph Neural Networks (GNNs) are neural networks designed to process graph-structured data. They excel at understanding relationships and dependencies between entities represented as nodes and edges in a graph.
GNNs leverage the graph structure to propagate information across nodes, capturing relational dependencies in the data. This approach transforms node features into compact representations, known as embeddings, which are utilized for tasks such as node classification, link prediction, and graph classification. For example, in sports analytics, GNNs take the graph representation of game states as input and learn player interactions, for outcome prediction, player valuation, identifying critical game moments, and decision analysis.
TacticAI Model
The TacticAI model is a deep learning system that processes player tracking data in trajectory frames to predicts three aspects of the corner kicks including receiver of the shot (who is most likely to receive the ball), determines shot likelihood (will the shot be taken), and suggests player positioning adjustments (how to position the players to increase/decrease shot probability).
Here’s how the TacticAI is developed:
Data Collection: TacticAI uses a comprehensive dataset of over 9,000 corner kicks from Premier League seasons, curated from Liverpool FC’s archives. The data includes various sources, including spatio-temporal trajectory frames (tracking data), event stream data (annotating game events), player profiles (heights, weights), and miscellaneous game data (stadium info, pitch dimensions).
Data Pre-processing: The data were aligned using game IDs and timestamps, filtering out invalid corner kicks and filling in missing data.
Data Transformation and Pre-processing: The collected data is transformed into graph structures, with players as nodes and edges representing their movements and interactions. Nodes were encoded with features like player positions, velocities, heights, and weights. Edges were encoded with binary indicators of team membership (whether players are teammates or opponents).
Data Modeling: GNNs process data to uncover complex player relationships and predict the outputs. By utilizing node classification, graph classification, and predictive modelling, GNNs are used for identifying receivers, predicting shot probabilities, and determining optimal player positions, respectively. These outputs provide coaches with actionable insights to enhance strategic decision-making during corner kicks.
Generative Model Integration: TacticAI includes a generative tool that assists coaches in adjusting their game plans. It offers suggestions for slight modifications in player positioning and movements, aiming to either increase or decrease the chances of a shot being taken, depending on what’s needed for the team’s strategy.
Impact of TacticAI Beyond Football
The development of TacticAI, while primarily focused on football, has broader implications and potential impacts beyond the football. Some potential future impacts are as follows:
Advancing AI in Sports: TacticAI could play a substantial role in advancing AI across different sports fields. It can analyze complex game events, better manage resources, and anticipate strategic moves offering a meaningful boost to sports analytics. This can lead to a significant improvement of coaching practices, the enhancement of performance evaluation, and the development of players in sports like basketball, cricket, rugby, and beyond.
Defense and Military AI Enhancements: Utilizing the core concepts of TacticAI, AI technologies could lead to major improvements in defense and military strategy and threat analysis. Through the simulation of different battlefield conditions, providing resource optimization insights, and forecasting potential threats, AI systems inspired by TacticAI’s approach could offer crucial decision-making support, boost situational awareness, and increase the military’s operational effectiveness.
Discoveries and Future Progress: TacticAI’s development emphasizes the importance of collaboration between human insights and AI analysis. This highlights potential opportunities for collaborative advancements across different fields. As we explore AI-supported decision-making, the insights gained from TacticAI’s development could serve as guidelines for future innovations. These innovations will combine advanced AI algorithms with specialized domain knowledge, helping address complex challenges and achieve strategic objectives across various sectors, expanding beyond sports and defense.
The Bottom Line
TacticAI represents a significant leap in merging AI with sports strategy, particularly in football, by refining the tactical aspects of corner kicks. Developed through a partnership between DeepMind and Liverpool FC, it exemplifies the fusion of human strategic insight with advanced AI technologies, including geometric deep learning and graph neural networks. Beyond football, TacticAI’s principles have the potential to transform other sports, as well as fields like defense and military operations, by enhancing decision-making, resource optimization, and strategic planning. This pioneering approach underlines the growing importance of AI in analytical and strategic domains, promising a future where AI’s role in decision support and strategic development spans across various sectors.
#000#ai#AI systems#Algorithms#Analysis#Analytics#approach#Article#artificial#Artificial Intelligence#awareness#binary#chess#Collaboration#collaborative#comprehensive#data#data collection#data modeling#data transformation#decision support#Deep Learning#DeepMind#defense#development#dimensions#Discoveries#domains#embeddings#Events
0 notes
Text
Here is how you can Choose the Right Tools for Data Transformation
For those who are running a business, data management is an art. Choosing the right data transformation tools is a critical decision that can significantly impact the quality and efficiency of your processes. This informative guide explores vital considerations and insights to help you navigate the landscape and make informed decisions.
Understanding Data Quality:
The foundation of any data transformation lies in ensuring data quality. Before probing into the selection of tools, assessing the quality of your existing datasets is crucial. Look for tools that offer robust data quality features, including validation checks, anomaly detection, and cleansing capabilities. A device that addresses data quality concerns ensures the accuracy and reliability of your transformed data.
Validation:
An essential aspect of data transformation is validating the input and output data sets. Effective validation mechanisms within a tool help identify and rectify errors, ensuring that the transformed data adheres to standards that have already been laid out to set the course. Look for tools with comprehensive validation features to guarantee the integrity of your data throughout the transformation process.
Combining Data Sets and Aggregation:
Many data transformation tasks involve merging or combining dissimilar data sets to derive meaningful insights. Choose tools that offer seamless integration capabilities, enabling you to combine data from various sources effortlessly. Additionally, look for tools with robust aggregation functionalities that help summarize and analyze data at different granularities to meet specific business requirements.
Compatibility with Existing Systems:
Ensuring compatibility with your existing systems should be a priority for a smooth integration process. Evaluate data transformation tools that seamlessly integrate with your current infrastructure, databases, and analytics platforms. A software tool that aligns with your existing ecosystem minimizes disruptions, streamlines the adoption process, and optimizes your overall data transformation workflow. Trust use when we tell you that optimizing the data so that it fits in well with the new version of the software tool that you plan on using can be a task, hence use the one with possible integration.
Scalability for Future Growth:
As your organization grows, so does the volume and complexity of your data. Opt for tools that offer scalability, allowing you to handle increasing data loads and evolving business needs. A scalable data transformation tool ensures that your processes remain efficient and effective even as your data requirements expand. It should be able to get in data silos and integrate them together so as to make meaningful insights that can help in the business growth.
Making Informed Decisions:
Choosing the right tools is a strategic decision that influences the success of your data initiatives. By prioritizing data quality, validation capabilities, the ability to combine and aggregate data, compatibility with existing systems, and scalability, you empower your organization to harness the full potential of your data. As you begin to select data transformation tools, keep these considerations in mind. By making informed decisions at this stage, you lay the groundwork for a robust and agile data transformation process that aligns seamlessly with your business objectives. With the right tools and partners like HubBroker, your organization can unlock the true value of its data assets.
#datamanagement#datasecurity#data transformation#automation#erpsoftware#erp solution#ecommerce integration#invoice software development bd#supplychain#healthcare
1 note
·
View note