#Visual Analytics
Explore tagged Tumblr posts
Visit Tumblr Blog
Explore Tumblr blogs with no restrictions, modern design and the best experience.
Last Seen Tumblr Blogs


Fun Fact
Tumblr.com rank in the US is 25.
Text
0 notes
Text
India’s Top Valued Quick Commerce Brands: Leaders in Instant Delivery

Most Valued Quick Commerce Brands in India: Who’s Leading the Game?
Quick commerce is rapidly becoming the new normal in India’s grocery shopping landscape. As the demand for ultra-fast delivery services grows, several players have emerged as key contenders in this space. In fact, 31% of urban Indians now use quick commerce for their primary grocery shopping, while 39% rely on it for top-ups. This trend has given rise to intense competition among quick commerce brands, with a few emerging as leaders. Let’s take a closer look at India’s top valued quick commerce brands and how they’ve positioned themselves in this booming market.
The Dominant Players in India’s Quick Commerce Market
When we talk about quick commerce in India, three names come up repeatedly: Blinkit, Swiggy Instamart, and Zepto. These brands have become synonymous with fast, reliable grocery deliveries, and each has carved out a unique position in this competitive market.
Blinkit: The Market Leader
Blinkit, backed by Zomato, with 39% market share, has taken a commanding lead in India’s quick commerce space. Originally known as Grofers, Blinkit rebranded itself and shifted focus to deliver groceries and essentials within minutes. The company’s massive infrastructure, efficient delivery systems, and strong funding from Zomato have given it a significant edge over competitors.
Blinkit’s ability to fulfill customer orders in under 10-15 minutes has become its biggest selling point. As convenience becomes more critical for urban shoppers, Blinkit continues to dominate by improving its delivery speeds and expanding its network of dark stores (localized warehouses for quick delivery). Today, Blinkit is synonymous with quick grocery shopping in major Indian cities.
Swiggy Instamart: Leveraging a Massive Customer Base
Swiggy Instamart, Swiggy’s grocery delivery arm, has emerged as a serious player in the quick commerce market. The main rival of zomato commands a whooping 37% of the market share. What sets Instamart apart is its ability to tap into Swiggy’s massive customer base, built over years of being one of the leading food delivery platforms in India. With its established network, Swiggy Instamart has been able to quickly scale operations, offering a wide variety of grocery items that can be delivered in under 30 minutes.
Instamart has focused heavily on improving distribution, leveraging Swiggy’s expertise in logistics to make rapid deliveries possible. As a result, it has become a preferred option for many urban customers looking for convenience and speed.
Zepto: The Fast-Moving Challenger
Despite entering the market later than its competitors, Zepto has quickly risen to the forefront, leaving behind more established players like Dunzo and BigBasket in the quick commerce space. Zepto with a market share of 20%, has built its reputation on delivering groceries in under 10 minutes, a feat that has resonated strongly with younger, urban customers. This focus on ultra-fast deliveries has allowed Zepto to capture significant market share, even in a crowded space.
One of Zepto’s strategies has been to focus on smaller basket sizes but higher frequency of orders, catering to customers who need quick top-ups rather than bulk grocery orders. This has helped the brand stay nimble and scale rapidly in key metropolitan areas.
Why These Brands Are Thriving
What makes these three brands stand out from the crowd? The answer lies in their ability to scale rapidly, streamline logistics, and meet the growing demand for ultra-fast deliveries. Each brand has its strengths: Blinkit’s market leadership and Zomato backing, Instamart’s access to Swiggy’s user base, and Zepto’s promise of lightning-fast deliveries.
The Indian quick commerce market is still in its early stages, but these brands have already established a strong foothold. Their ability to adapt to customer needs, invest in infrastructure, and innovate in delivery times will likely keep them at the top of the game for years to come.
The Future of Quick Commerce in India
As India’s top valued quick commerce brands continue to evolve, the market shows no signs of slowing down. With more urban Indians relying on quick commerce for both primary grocery shopping and top-ups, the demand for ultra-fast delivery services will only grow. The competition will get fiercer, but Blinkit, Swiggy Instamart, and Zepto have already demonstrated their ability to thrive in this environment.
In the future, we can expect even faster deliveries, broader product offerings, and more localized solutions as these brands look to solidify their positions and expand into new markets. Quick commerce is here to stay, and India’s urban consumers are more than ready for it.
0 notes
Text
https://www.bloglovin.com/@vastedge/kpi-dashboards-a-visual-guide-to-business
Unlock the power of KPI dashboards with this visual guide. This blog post provides insights into how KPI dashboards can enhance business performance by offering clear, actionable data visualizations. Learn how to design and utilize these dashboards to monitor key metrics, make informed decisions, and drive strategic growth.
#KPI Dashboards#Business Performance#Data Visualization#Key Metrics#Dashboard Design#Performance Tracking#Business Intelligence#Strategic Growth#Data Analytics#Visual Analytics
0 notes
Text
Creating an Effective Power BI Dashboard: A Comprehensive Guide

Introduction to Power BI Power BI is a suite of business analytics tools that allows you to connect to multiple data sources, transform data into actionable insights, and share those insights across your organization. With Power BI, you can create interactive dashboards and reports that provide a 360-degree view of your business.
Step-by-Step Guide to Creating a Power BI Dashboard
1. Data Import and Transformation The first step in creating a Power BI dashboard is importing your data. Power BI supports various data sources, including Excel, SQL Server, Azure, and more.
Steps to Import Data:
Open Power BI Desktop.
Click on Get Data in the Home ribbon.
Select your data source (e.g., Excel, SQL Server, etc.).
Load the data into Power BI.
Once the data is loaded, you may need to transform it to suit your reporting needs. Power BI provides Power Query Editor for data transformation.
Data Transformation:
Open Power Query Editor.
Apply necessary transformations such as filtering rows, adding columns, merging tables, etc.
Close and apply the changes.
2. Designing the Dashboard After preparing your data, the next step is to design your dashboard. Start by adding a new report and selecting the type of visualization you want to use.
Types of Visualizations:
Charts: Bar, Line, Pie, Area, etc.
Tables and Matrices: For detailed data representation.
Maps: Geographic data visualization.
Cards and Gauges: For key metrics and KPIs.
Slicers: For interactive data filtering.
Adding Visualizations:
Drag and drop fields from the Fields pane to the canvas.
Choose the appropriate visualization type from the Visualizations pane.
Customize the visual by adjusting properties such as colors, labels, and titles.
3. Enhancing the Dashboard with Interactivity Interactivity is one of the key features of Power BI dashboards. You can add slicers, drill-throughs, and bookmarks to make your dashboard more interactive and user-friendly.
Using Slicers:
Add a slicer visual to the canvas.
Drag a field to the slicer to allow users to filter data dynamically.
Drill-throughs:
Enable drill-through on visuals to allow users to navigate to detailed reports.
Set up drill-through pages by defining the fields that will trigger the drill-through.
Bookmarks:
Create bookmarks to capture the state of a report page.
Use bookmarks to toggle between different views of the data.

Different Styles of Power BI Dashboards Power BI dashboards can be styled to meet various business needs. Here are a few examples:
1. Executive Dashboard An executive dashboard provides a high-level overview of key business metrics. It typically includes:
KPI visuals for critical metrics.
Line charts for trend analysis.
Bar charts for categorical comparison.
Maps for geographic insights.
Example:
KPI cards for revenue, profit margin, and customer satisfaction.
A line chart showing monthly sales trends.
A bar chart comparing sales by region.
A map highlighting sales distribution across different states.
2. Sales Performance Dashboard A sales performance dashboard focuses on sales data, providing insights into sales trends, product performance, and sales team effectiveness.
Example:
A funnel chart showing the sales pipeline stages.
A bar chart displaying sales by product category.
A scatter plot highlighting the performance of sales representatives.
A table showing detailed sales transactions.
3. Financial Dashboard A financial dashboard offers a comprehensive view of the financial health of an organization. It includes:
Financial KPIs such as revenue, expenses, and profit.
Financial statements like income statement and balance sheet.
Trend charts for revenue and expenses.
Pie charts for expense distribution.
Example:
KPI cards for net income, operating expenses, and gross margin.
A line chart showing monthly revenue and expense trends.
A pie chart illustrating the breakdown of expenses.
A matrix displaying the income statement.
Best Practices for Designing Power BI Dashboards To ensure your Power BI dashboard is effective and user-friendly, follow these best practices:
Keep it Simple:
Avoid cluttering the dashboard with too many visuals.
Focus on the most important metrics and insights.
2. Use Consistent Design:
Maintain a consistent color scheme and font style.
Align visuals properly for a clean layout.
3. Ensure Data Accuracy:
Validate your data to ensure accuracy.
Regularly update the data to reflect the latest information.
4. Enhance Interactivity:
Use slicers and drill-throughs to provide a dynamic user experience.
Add tooltips to provide additional context.
5. Optimize Performance:
Use aggregations and data reduction techniques to improve performance.
Avoid using too many complex calculations.
Conclusion Creating a Power BI dashboard involves importing and transforming data, designing interactive visuals, and applying best practices to ensure clarity and effectiveness. By following the steps outlined in this guide, you can build dashboards that provide valuable insights and support data-driven decision-making in your organization. Power BI’s flexibility and range of visualizations make it an essential tool for any business looking to leverage its data effectively.
#Dynamic Data Visualization#Business Analytics#Interactive Dashboards#Data Insights#Data Transformation#KPI Metrics#Real-time Reporting#Data Connectivity#Trend Analysis#Visual Analytics#Performance Metrics#Data Modeling#Executive Dashboards#Sales Performance#Financial Reporting#Data Interactivity#Data-driven Decisions#Power Query#Custom Visuals#Data Integration
0 notes
Text

How DigitalU3 Can Transform Your Business with AI
Are you looking for AI-driven solutions to boost your systems and assets productivity, efficiency, and driving operational innovation? Do you want to leverage the power of data, analytics, and machine learning to gain a competitive edge? If yes, then you need to check out DigitalU3, the leading provider of AI solutions for businesses of all sizes and domains. DigitalU3 can help you design, develop, and deploy AI led capabilities that suit your specific needs and goals. Whether you need AI to enhance your existing IoT setup or to do it from scratch as an end-to-end process for marketing, informed customer services, optimized operations, or any other area where data can help decision making, DigitalU3 can deliver the best results. Visit www.digitalu3.com today and discover how DigitalU3 can transform your business with AI enabled IoT solutions.
1 note
·
View note
Text
The visual analytics market is undergoing a significant transformation, with a remarkable annual growth rate of 21.4%. This impressive journey is projected to lead to a market size of an astounding US$ 58,969.8 million by the year 2033.
Visual Analytics refers to the use of data visualization tools and techniques to gain insights and make informed decisions. In simpler terms, it involves turning complex data into visual representations that are easy to understand and analyze.
0 notes
Text

Kim the voices in my head are fighting again
#I set out to make analytical Normal Cop and accidentally made EDM obsessed Art Cop#disco elysium#harry du bois#harry dubois#harry dubois fanart#my art#art#traditional art#disco elysium fanart#visual calculus and conceptualization are very cool skills#disco elysium skills
437 notes
·
View notes
Text

Ninja, robots, pirates, magic
I made an interactive visualization on the 100 most popular comics at the Brooklyn Public Library for January 2025. The full 100 is also here on Medium. Top manga 1. Demon slayer = Kimetsu no yaiba Volume 1 by Koyoharu Gotoge, 2019 2. One piece by Eiichirō Oda, 2023 3. Spy x family. 1, Mission 1 by Tatsuya Endo, 2020 4. My hero academia. Vol. 1, Izuku Midoriya: Origin by Kōhei Horikoshi, 2015 5. Spy x family. Vol. 12 by Tatsuya Endō, 2024 6. Demon slayer. 23, Life shining across the years by Koyoharu Gotoge, 2021 7. Naruto. Vol. 1, The tests of the ninja by Masashi Kishimoto, 2023 8. Jujutsu kaisen. Volume 1, Ryomen Sukuna by Gege Akutami, 2019 9. Spy x family. Volume 11 by Tatsuya Endō, 2024 10. Dragon ball super. 1, Warriors from Universe 6! by Akira Toriyama, 2017
Top Marvel checkouts
Guardians of the Galaxy Volume 3, DVD, 2023
Ant-Man and the Wasp: Quantumania, DVD, 2023
Miles Morales, Straight out of Brooklyn by Saladin Ahmed, 2019
Black Panther: Wakanda Forever, DVD, 2021
Spider-Man: No Way Home, DVD, 2022
Doctor Strange in the Multiverse of Madness, DVD, 2022
Ms. Marvel. 1, No normal by G Willow Wilson, 2014
Spider-Man. Vol. 1, Miles Morales by Brian Michael Bendis, 2016
Thor: Love and Thunder, DVD, 2022
Other graphic novels
Heartstopper Volume 5 by Alice Oseman, 2023
Heartstopper Volume 2 by Alice Oseman, 2020
Heartstopper Volume 3 by Alice Oseman, 2021
Heartstopper Volume 4 by Alice Oseman, 2021
The Girl From the Sea by Molly Knox Ostertag, 2021
The Twisted Ones by Scott Cawthon, 2021
Five Nights at Freddy’s, Fazbear Frights, The Fourth Closet by Chris Hastings, 2022
Heartstopper Volume 1 by Alice Oseman, 2020
Five Nights at Freddy’s, Fazbear Frights, Graphic Novel Collection Vol. 1 by Scott Cawthon, 2022
The Princess and the Grilled Cheese Sandwich by Deya Muniz, 2023
#comics#manga#books & libraries#books and reading#books#comic books#comic book art#graphic narrative#lgbtq community#data analytics#data visualization#public libraries
21 notes
·
View notes
Text

Poverty, poverty knock / Keeping one eye on the clock / I know I can guttle, when I hear my shuttle / Go poverty, poverty knock...
...so I read @nothwell's novel 'mr warren's profession' at approximately light speed the other day and felt like drawing some of the cast.
#em draws stuff#mr warren's profession#tagging l to r as usual#miss brewster#<- she doesn't even have a first name but she's a major character in my heart.#emmeline rook#lindsey althorp#aubrey warren#vibes on this one visually are '1890s from memory but other eras have crept in because that's not my usual setting'#and the backgrounds are scanned (text) and traced (flourishes) from 1893 newspapers from my college!#which is why I posted maybe ten different screenshots from old newspapers t'other day. They're Fun.#this was a rather interesting read for me because this is not at all my usual genre of choice as I am probably not the intended audience#(to wit: quite ace)#but also I've never really seen an author do this thorough a fictional portrayal of so many various threads of 19thc queerness before#it's a motivation like any other and I think that's executed very well! and also of course I Do like to hear in great detail about textiles#and mills and looms and analytical engines!!!#more commentary wrt choice of character... we have both My Very Favorites and also we have The Protagonists.#the protagonists oughtn't be forgotten despite my instant and known affection for a union-organiser in a flat cap#you know how it is with union-organisers in flat caps :]
25 notes
·
View notes
Text
Alien: Covenant (2017) - UIs
#alien covenant#graphic design#user interface#user interaction#graphic art#cyberpunk aesthetic#data analytics#data visualization#scifi#computers#computing
68 notes
·
View notes
Text


Shootfighter: Fight to the Death (1993) dir. Patrick Alan
#Shootfighter: Fight to the Death#Ruben Patterson#William Zabka#Movies#Cinematography#Hahahaha no this isn't a real analytical post#I'm not going to pretend the cinematographer Glenn Wershaw meant anything by these cherrypicked screenshots#I just like the visual of a blade obscuring Ruben's face 💗#But I could imagine they mean something.#Miyagi-horiginal#Shootfighter
35 notes
·
View notes
Text
wait wait wait wait wait wait wait
someone used my voice pack!
someone used my voice pack1!!!!!
aaaaaaaaaaaaaaaa
AAAAAAAAAAAAAAAAAA
#i am in a visual novel baby!! i mean ive been in one already but that ones dead in the water so like does it really count#it really wasn't a good pack either i made it on a whim in a day and a half im so shook im going to play it now#did it come out in august and im late?? yeah#granted i would have not even known if someone hadn't clicked their link for the pack and it showed in my analytics#Elise's Other Hobbies
5 notes
·
View notes
Text
Entering the Elite: Wealth required for top 1% by country

In a world where the wealth gap continues to widen, many people wonder: how much Wealth required for top 1% by country? Wealth requirements differ drastically across the globe, often depending on factors like population size, cost of living, and economic policies. This article based on Knight Frank Wealth Report 2021 dives into the specific numbers that separate the financial elite from the rest and explores what it takes to be a part of the top 1% in different nations.
Being part of the top 1% isn’t the same everywhere. In some countries, the bar is set extraordinarily high, while others are more accessible to reach, reflecting vast economic differences and sometimes large wealth disparities within their populations. Let’s break down what you’d need to join the elite ranks around the world.
#data visualisation#content marketing#social media#technology#visual analytics#digital infographics#business#ecommerce
0 notes
Text
For anyone currently in school or recently in school

I am doing a few guest lectures at some of the universities in my state and working on my presentation. Curious if anyone has any recommendations of topics they really enjoyed from a past guest speaker that isn't major/field-specific?
#college#college student#studying#studyblr#school#university#accounting#finance#consulting#data analytics#data analysis#data visualization#big data#data
22 notes
·
View notes
Text
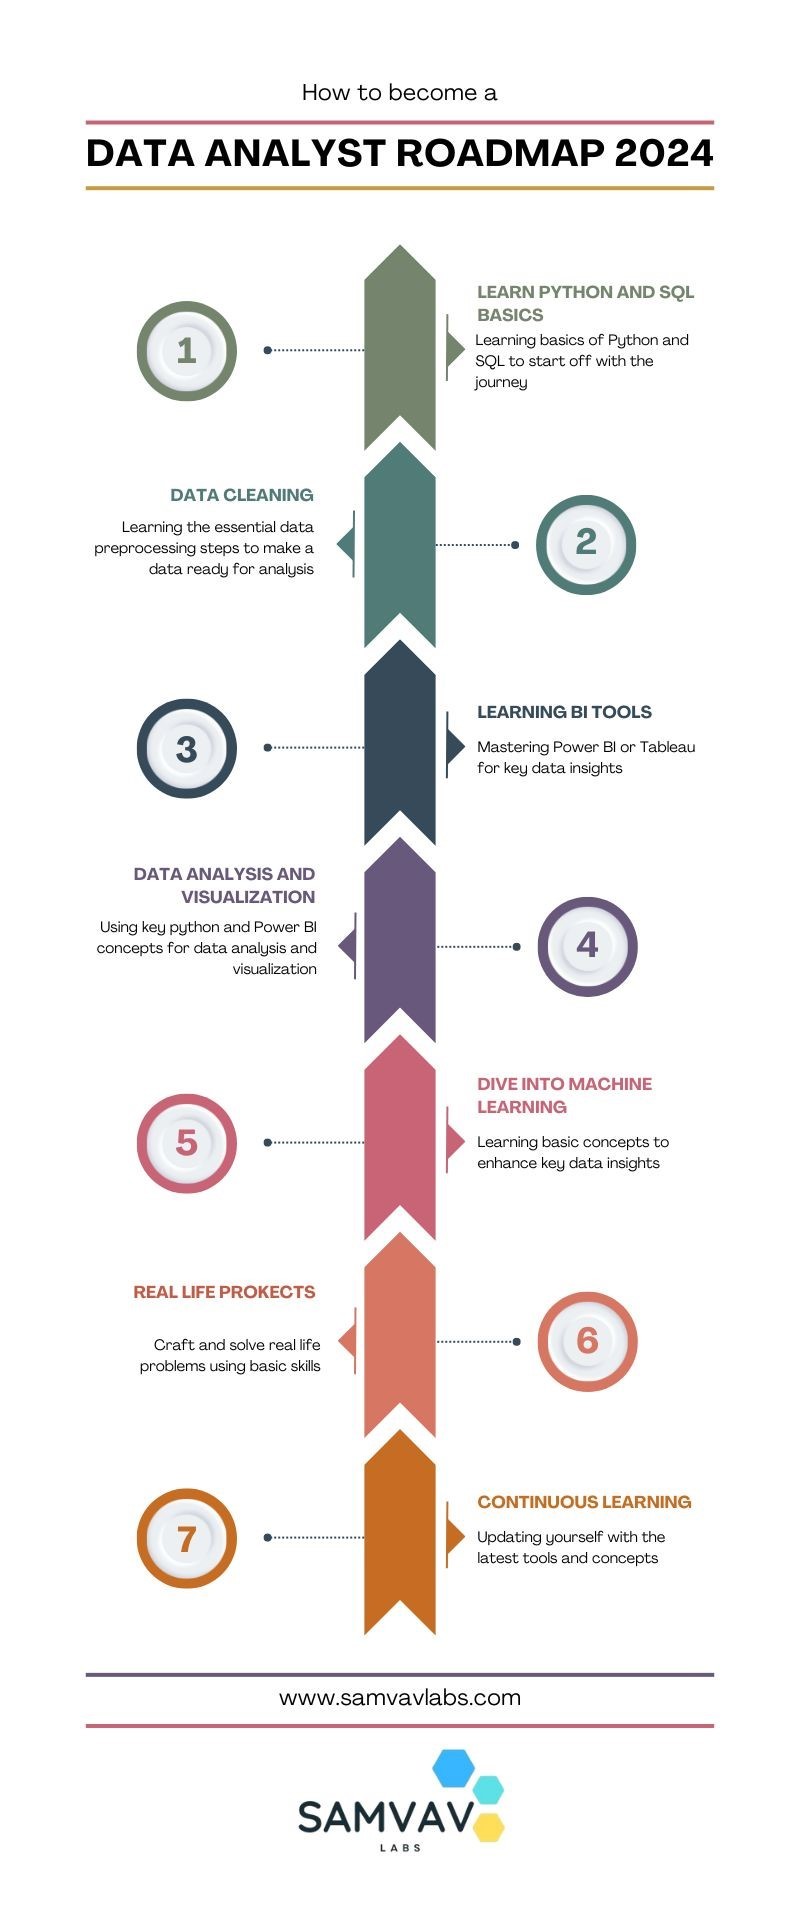
Data Analyst Roadmap for 2024!
Cracking the Data Analyst Roadmap for 2024! Kick off your journey by mastering and delving into Python for data manipulation magic, and dazzle stakeholders with insights using PowerBi or Tableau. Don't forget, that SQL proficiency and hands-on projects refine your skillset, but never overlook the importance of effective communication and problem-solving. Are you checking off these milestones on your path to success? 📌 For more details, visit our website: https://www.samvavlabs.com . . . #DataAnalyst2024 #CareerGrowth #roadmap #DataAnalyst #samvavlabs #roadmap2024 #dataanalystroadmap #datavisualization
#business analytics#data analytics#data analyst#machinelearning#data visualization#datascience#deep learning#data analyst training#dataanalystcourseinKolkata#data analyst certification#data analyst course#data science course#business analyst
11 notes
·
View notes
Text
The Skills I Acquired on My Path to Becoming a Data Scientist
Data science has emerged as one of the most sought-after fields in recent years, and my journey into this exciting discipline has been nothing short of transformative. As someone with a deep curiosity for extracting insights from data, I was naturally drawn to the world of data science. In this blog post, I will share the skills I acquired on my path to becoming a data scientist, highlighting the importance of a diverse skill set in this field.
The Foundation — Mathematics and Statistics
At the core of data science lies a strong foundation in mathematics and statistics. Concepts such as probability, linear algebra, and statistical inference form the building blocks of data analysis and modeling. Understanding these principles is crucial for making informed decisions and drawing meaningful conclusions from data. Throughout my learning journey, I immersed myself in these mathematical concepts, applying them to real-world problems and honing my analytical skills.
Programming Proficiency
Proficiency in programming languages like Python or R is indispensable for a data scientist. These languages provide the tools and frameworks necessary for data manipulation, analysis, and modeling. I embarked on a journey to learn these languages, starting with the basics and gradually advancing to more complex concepts. Writing efficient and elegant code became second nature to me, enabling me to tackle large datasets and build sophisticated models.
Data Handling and Preprocessing
Working with real-world data is often messy and requires careful handling and preprocessing. This involves techniques such as data cleaning, transformation, and feature engineering. I gained valuable experience in navigating the intricacies of data preprocessing, learning how to deal with missing values, outliers, and inconsistent data formats. These skills allowed me to extract valuable insights from raw data and lay the groundwork for subsequent analysis.
Data Visualization and Communication
Data visualization plays a pivotal role in conveying insights to stakeholders and decision-makers. I realized the power of effective visualizations in telling compelling stories and making complex information accessible. I explored various tools and libraries, such as Matplotlib and Tableau, to create visually appealing and informative visualizations. Sharing these visualizations with others enhanced my ability to communicate data-driven insights effectively.

Machine Learning and Predictive Modeling
Machine learning is a cornerstone of data science, enabling us to build predictive models and make data-driven predictions. I delved into the realm of supervised and unsupervised learning, exploring algorithms such as linear regression, decision trees, and clustering techniques. Through hands-on projects, I gained practical experience in building models, fine-tuning their parameters, and evaluating their performance.
Database Management and SQL
Data science often involves working with large datasets stored in databases. Understanding database management and SQL (Structured Query Language) is essential for extracting valuable information from these repositories. I embarked on a journey to learn SQL, mastering the art of querying databases, joining tables, and aggregating data. These skills allowed me to harness the power of databases and efficiently retrieve the data required for analysis.

Domain Knowledge and Specialization
While technical skills are crucial, domain knowledge adds a unique dimension to data science projects. By specializing in specific industries or domains, data scientists can better understand the context and nuances of the problems they are solving. I explored various domains and acquired specialized knowledge, whether it be healthcare, finance, or marketing. This expertise complemented my technical skills, enabling me to provide insights that were not only data-driven but also tailored to the specific industry.
Soft Skills — Communication and Problem-Solving
In addition to technical skills, soft skills play a vital role in the success of a data scientist. Effective communication allows us to articulate complex ideas and findings to non-technical stakeholders, bridging the gap between data science and business. Problem-solving skills help us navigate challenges and find innovative solutions in a rapidly evolving field. Throughout my journey, I honed these skills, collaborating with teams, presenting findings, and adapting my approach to different audiences.
Continuous Learning and Adaptation
Data science is a field that is constantly evolving, with new tools, technologies, and trends emerging regularly. To stay at the forefront of this ever-changing landscape, continuous learning is essential. I dedicated myself to staying updated by following industry blogs, attending conferences, and participating in courses. This commitment to lifelong learning allowed me to adapt to new challenges, acquire new skills, and remain competitive in the field.
In conclusion, the journey to becoming a data scientist is an exciting and dynamic one, requiring a diverse set of skills. From mathematics and programming to data handling and communication, each skill plays a crucial role in unlocking the potential of data. Aspiring data scientists should embrace this multidimensional nature of the field and embark on their own learning journey. If you want to learn more about Data science, I highly recommend that you contact ACTE Technologies because they offer Data Science courses and job placement opportunities. Experienced teachers can help you learn better. You can find these services both online and offline. Take things step by step and consider enrolling in a course if you’re interested. By acquiring these skills and continuously adapting to new developments, they can make a meaningful impact in the world of data science.
#data science#data visualization#education#information#technology#machine learning#database#sql#predictive analytics#r programming#python#big data#statistics
14 notes
·
View notes