#StorytellingWithData
Explore tagged Tumblr posts
Visit Tumblr Blog
Explore Tumblr blogs with no restrictions, modern design and the best experience.
Last Seen Tumblr Blogs


Fun Fact
In 2020, Tumblr had 29.4 million users in the US.
Text
The Role of Data Science in Healthcare and Diagnosis
Data science is changing many areas, and healthcare is one of the most important ones. Today, healthcare uses data science to help doctors find diseases early, make better decisions, and create treatments that fit each patient. Hospitals, clinics, and researchers have a lot of health data, like patient records, test results, and information from devices like fitness trackers. Data science helps to understand all this data and use it to improve health and save lives.
Why Healthcare Needs Data Science
Healthcare creates huge amounts of data every day. Each patient has a medical history, lab tests, prescriptions, and other information. But this data is often spread out and not easy to use. Data science helps by analyzing this data and finding useful patterns.
Using tools like machine learning and statistics, data scientists find important information that can help doctors and nurses make faster and better decisions. This means patients get the right care at the right time.
How Data Science Helps Healthcare
1. Finding Diseases Early
One of the biggest ways data science helps is by spotting diseases early. Doctors use data science models trained on thousands of medical images and patient data to find signs of diseases like cancer or heart problems before they become serious.
For example, some AI tools can look at breast cancer scans and find tiny changes that a doctor might miss. This helps catch cancer early when treatment is easier and more effective.
2. Predicting Health Problems
Data science can also predict which patients might get sick or need extra care. Hospitals use this to plan treatment and avoid emergencies.
For example, data models can predict if a patient might develop a serious infection like sepsis. If the model alerts the doctors early, they can start treatment sooner and save the patient’s life.
3. Making Treatment Personal
Every person is different, so one treatment might not work for everyone. Data science helps by studying a patient’s genes, lifestyle, and past treatments to suggest the best medicine or therapy for them.
In cancer treatment, for example, doctors use genetic data to choose the drugs that will work best for a patient’s specific type of cancer. This approach is called “precision medicine.”
4. Helping Doctors Read Medical Images
Reading X-rays, MRIs, or CT scans takes time and skill. Data science uses AI to help doctors by quickly analyzing these images and pointing out problems.
For example, AI can find small lung nodules on a chest X-ray, which could be early signs of lung cancer. This helps doctors make faster and more accurate diagnoses.
5. Finding New Medicines
Creating new drugs takes a long time and costs a lot of money. Data science can speed up this process by predicting which chemicals might work as medicines.
During the COVID-19 pandemic, data science helped researchers understand the virus and find possible treatments faster than ever before.
Tools Used in Healthcare Data Science
Healthcare data science uses many computer tools to do its work:
Python and R: These programming languages help analyze data and build models.
TensorFlow and PyTorch: These tools help create AI programs that learn from data.
Tableau and Power BI: These help make charts and graphs to show data clearly.
Cloud platforms like AWS and Azure: These provide places to store and process big amounts of data quickly.
Together, these tools help doctors and data scientists work as a team to improve health care.
Challenges of Using Data Science in Healthcare
Even though data science is very helpful, there are some challenges:
Privacy: Patient data is very private. It must be kept safe and only used in the right ways.
Data Quality: Sometimes data is incomplete or wrong, which can lead to mistakes.
Understanding AI: Doctors need to know how AI makes decisions to trust it, but sometimes AI is hard to understand.
Fairness: If data is biased, AI might make unfair decisions that hurt some patients.
Healthcare providers, data scientists, and regulators must work together to solve these problems carefully.
What the Future Looks Like
The future of healthcare will rely even more on data science. Some examples include:
AI assistants helping with mental health support.
Wearable devices that monitor health and alert doctors in emergencies.
Hospitals using data to manage patient care and resources better.
Digital models of patients that test treatments before trying them in real life.
As technology improves and more data becomes available, healthcare will become faster, safer, and more personal.
Conclusion
Data science is changing healthcare in many good ways. It helps find diseases early, predicts health risks, personalizes treatments, helps doctors read medical images, and speeds up drug discovery. These improvements come from using data and technology together.

#data#datascience#datastorytelling#machinelearning#bigdata#analytics#technology#informationtechnology#ai#datainsights#dataanalysis#datavisualization#predictiveanalytics#dataengineer#businessintelligence#deeplearning#dataanalytics#storytellingwithdata#pythonfordatascience#datajourney#mlmodels#cleandata#datascientistlife#datamakesdifference#dataisthenewoil#datasciencetools#techblog#futureofdata#insightsfromdata#datadriven
0 notes
Text
Enhancing Travel Services Statistics in Eswatini: Insights from ITC Day 3 Training

Mbabane, Eswatini — 16 April 2025 By: Thabiso Njoko
The third day of the International Trade Centre (ITC)’s specialized training on Travel Services in Eswatini brought together statisticians, trade experts, and data professionals to deepen their understanding of trade intelligence through robust data handling techniques. The session emphasized fostering African trade integration by strengthening statistical capacity in travel-related services.
Kickstarting with Coffee & Concepts
After a quick Q&A recap of Day 2, things got serious. The morning dove straight into sampling techniques, using real-world case studies from Spain and France to explore how countries collect data without a complete business registry. The solution? Smart sampling — think stratified methods, population frameworks, and creative workarounds.
“We don’t have to count everyone. We just have to count smart,” one participant noted during the group exercise.
Building Better Data: Processing & Precision
Next came the data processing phase, where participants learned how raw survey responses turn into reliable national statistics. It’s more than just crunching numbers — it’s about linking records, correcting errors, and identifying those wild outliers (like the accommodation provider who over-reported by 100x — ouch!).
Tools and techniques covered:
Regression and ratio imputations
Nearest-neighbour donor methods
Automated editing software (yes, robots helping with stats!)
From France’s donor-clustering method to New Zealand’s COVID-era imputation models, the global examples made it clear: no two countries do it the same, but everyone’s working toward the same goal — better data for better decisions.
Imputations: Filling in the Blanks
If you’ve ever skipped a survey question, you’ve contributed to one of the biggest challenges in statistics: missing values. Day 3 tackled this head-on with exercises on how to handle non-response. Do you adjust the weights? Impute values? Go back and ask again?
Participants learned about:
Longitudinal imputation (filling in today’s blanks using yesterday’s answers)
Weighting adjustments to account for non-responding units
And most importantly — choosing the right method for the right situation
Making Data Speak: Dissemination & Metadata
Stats are only as useful as people’s ability to understand them. The final session explored how platforms like OECD’s Data Explorer, ITC Trade Map, and Eurostat make data accessible through strong metadata and sleek design.
“Where is the wisdom we have lost in knowledge? Where is the knowledge we have lost in information?” — T.S. Eliot, as quoted in the final slide.
A reminder that stats aren’t just about counting tourists — they’re about informing policy, supporting business, and building a stronger future.
Wrapping Up with Smiles (and Certificates)
After hours of exercises, discussions, and plenty of “a-ha!” moments, the day ended with a certificate ceremony. Shoutout to the ITC team — especially Christophe Durand and Katerina Blanchard Joklova — for making data training engaging and hands-on.

Final Takeaway
Whether you’re a tourism officer, a data geek, or just curious about how numbers shape our economy — this training was a powerful reminder that behind every statistic, there’s a story.
And in Eswatini, that story is just beginning.
Lets Connect: Discord | Telegram | Linkedin | X
#MediumWriters#DataStorytelling#WhatMatters#InformedOpinions#MediumAfrica#MediumVoices#ThinkPiece#tourism statistics#internation trade centre#travel data#eswatini#workshop#CreativeEconomy#DesignMeetsData#CreativeAfrica#CultureAndCommerce#ArtOfData#StorytellingWithData#DataAndDesign#CapacityBuilding#DataSkills#KnowledgeIsPower#LearningThroughData#SkillUpAfrica#ProfessionalDevelopment#AfricaRising#EswatiniInsights#AfricanTrade#RegionalIntegration#TourismInAfrica
0 notes
Text
What is Snowflake? A Game-Changer for Enterprise Data Management
Snowflake is an innovative cloud data warehouse that eliminates data silos and enables real-time analytics. Unlike traditional databases, it offers elasticity, automated scaling, and multi-cloud compatibility. With AI-driven insights, Snowflake empowers CXOs to make data-driven decisions. Know more:
Want to optimize your business intelligence strategy? DataStoryHub helps leaders unlock Snowflake’s full potential. Explore now!
0 notes
Text
10 Essential Skills You’ll Learn in a Data Analytics Course
In a data analytics course, you'll acquire vital skills like data visualization, statistical analysis, machine learning, and programming, essential for interpreting and deriving insights from complex datasets. Additionally, you'll learn database querying, data wrangling, and storytelling with data, empowering you to excel in the dynamic field of data analytics.
visit for more information:
#DataAnalyticsSkills#DataAnalysis#DataVisualization#StatisticalAnalysis#MachineLearning#Programming#DatabaseQuerying#DataWrangling#StorytellingWithData#DataScience
1 note
·
View note
Text
Top Reasons why Teams Abandon their Visuals
Clear objectives, design optimisation, comprehensive training, visual board maintenance, and addressing technological limitations prevent visual abandonment.
Read More: https://tcard.leantransitionsolutions.com/software-blogs-details/top-reasons-why-teams-abandon-their-visuals
#lts#leantransitionsolutions#tcard#tcards#tcardsoftware#tcardsystem#teamwork#gembawalks#huddleboard#teammeeting#5s#visualaids#teamhuddle#visualcues#huddlemeetings#Visualcommunication#Visualstorytelling#visualmanagement#storytellingwithdata#Visualperception#visualappeal#crossfunctionally#visualneglect#Compatibilityissues#Visualfeedback#Visualmessage#visualcomplexity#Visualconsistency#Visualaccessibility#visualsignals
0 notes
Photo
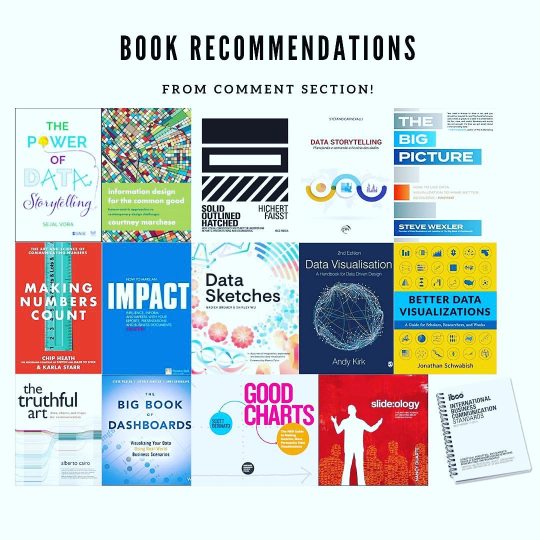
Consolidated all book recommendations from the comment section of my previous post! 😊 I’ve not read all of these BUT some of them are already on it’s way to me! For my personal recommendation, you can refer to my previous post below. https://lnkd.in/gAwVWtkR Book List: The Power of Data Story Telling by Sejal Vora Information Design for the Common Good by Courtney Marchese Solid Outlined Hatched by Rolf Hichert and Jürgen Faisst Data Storytelling, planejando e contando a história de dados by Stéfano Carnevalli The Big Picture" by Steve Wexler The Big Book of Dashboards by Steve Wexler Making Numbers Count: The Art and Science of Communicating Numbers by Chip Heath and Karla Starr Impact by Jon Moon Data Sketches byNadieh Bremer, Shirley Wu Data Visualisation by Andy Kirk Better Data Visualizations by Jonathan Schwabish The Truthful Art by Alberto Cairo Good Charts: The HBR Guide to Making Smarter, More Persuasive Data Visualizations by Scott Berinato slide.ology by Nancy Duarte IBCS – International Business Communication Standards #storytellingwithdata #storytelling #dataanalytics #dataanalyst #businessintelligence #datastorytelling #bookrecommendations https://www.instagram.com/p/CZhHQmaIvmw/?utm_medium=tumblr
#storytellingwithdata#storytelling#dataanalytics#dataanalyst#businessintelligence#datastorytelling#bookrecommendations
11 notes
·
View notes
Photo

จะได้อ่านไหมนะ ซื้ออะไรมา 😛 เปิดบทนำ ดูสารบัญคร่าวๆ คือเล่มซ้ายไปทาง visualization ส่วนทางขวาไปทางตัวเลข statistic // เหมือนเล่มขวา(สีขาว)จะอ่านยากกว่า #storytellingwithdata #theartofstatistics https://www.instagram.com/p/CT_2gY4PnQU/?utm_medium=tumblr
0 notes
Photo

Jadwal Training Storytelling with Data. Info Seminar Storytelling with Data untuk online training. 13 April 2021 Info Seminar Online Zoom: https://www.informasi-seminar.com/seminar-online-zoom/ Info lengkap: WA: 0851-0197-2488 Jadwal training lengkap: https://www.informasi-seminar.com #storytellingwithdata #storytelling #data #webinars #infoseminaronline #onlinetraining #publictraining #inhousetraining #jadwaltrainingapril2021 #agendatraining2021 #infotraining #infoseminar #powerpoint #tableau #presentation #presentasi #excel #visualisasi #charts #diagram (di Wisma Antara, Jl Medan Merdeka Selatan No 17, Gambir, Jakpus rno) https://www.instagram.com/p/CM1H2CHpnWK/?igshid=1o7pj0g4jah3b
#storytellingwithdata#storytelling#data#webinars#infoseminaronline#onlinetraining#publictraining#inhousetraining#jadwaltrainingapril2021#agendatraining2021#infotraining#infoseminar#powerpoint#tableau#presentation#presentasi#excel#visualisasi#charts#diagram
0 notes
Quote
If there isn't anything interesting to say about the data, don't show the data.
on what to include (or not) in your data presentation: Cole Nussbaumer, at a recent Milwaukee data viz gathering
2 notes
·
View notes
Text
Database Management Systems: The Heart of Efficient Data Handling
A database management system (DBMS) is software that enables users to store, retrieve, and manage data efficiently. DBMS solutions ensure data integrity, security, and accessibility, making them a critical component for enterprises handling large datasets. There are various types of DBMS, including relational (SQL-based) and non-relational (NoSQL) databases, each serving different business needs. Relational databases, such as MySQL and PostgreSQL, are ideal for structured data, while NoSQL solutions like MongoDB and Cassandra are better suited for unstructured or semi-structured data. Modern DBMSs offer features like automated backups, indexing, and real-time query optimization. Organizations leverage DBMS to streamline operations, improve customer experiences, and enable seamless data sharing across departments. As businesses embrace cloud-based and AI-powered databases, the efficiency and scalability of DBMS solutions continue to evolve. Choosing the right DBMS is essential for ensuring reliable data management and supporting business growth. For more info: https://www.datastoryhub.ai/data-warehouse-and-database-management-systems/
0 notes
Text
Data Storytelling for Risk Management: Turning Insights into Action

Enhance risk management with data storytelling transform complex risk data into clear, compelling narratives that drive better decisions. By combining analytics with storytelling techniques, organizations can identify threats, communicate risks effectively, and take proactive measures. Discover how data storytelling improves transparency, fosters stakeholder engagement, and strengthens resilience in an ever-evolving risk landscape. Empower your team with actionable insights through the power of storytelling. For more info: https://www.datastoryhub.ai/data-storytelling-for-risk-management/
#DataStorytelling#RiskManagement#DataDrivenDecisions#BusinessInsights#RiskAnalysis#DataVisualization#StorytellingWithData#EnterpriseRisk#DecisionMaking#AIForRisk#DataAnalytics#RiskMitigation#BusinessStrategy#PredictiveAnalytics#DataCommunication
0 notes
Text
Turning Complex Data into Stories with Data Storytelling
Data storytelling takes raw, complex data and turns it into engaging narratives. Through visuals, context, and emotional appeal, it makes data meaningful, empowering audiences to act on insights with confidence. For more info: https://www.datastoryhub.ai/data-storytelling-transforms-complex-data/
#DataStorytelling#ComplexDataSimplified#DataVisualization#StorytellingWithData#DataInsights#EngagingData
0 notes