#Failover Cluster Instances
Explore tagged Tumblr posts
Visit Tumblr Blog
Explore Tumblr blogs with no restrictions, modern design and the best experience.
Last Seen Tumblr Blogs


Fun Fact
The average Tumblr user visits about 67 pages every month.
Text
Choosing Between Failover Cluster Instances and Availability Groups in SQL Server
In SQL Server, high availability and disaster recovery are crucial aspects of database management. Two popular options for achieving these goals are Failover Cluster Instances (FCIs) and Availability Groups (AGs). While both technologies aim to minimize downtime and ensure data integrity, they have distinct use cases and benefits. In this article, we’ll explore scenarios where Failover Cluster…
View On WordPress
#automatic failover#Availability Groups#disaster recovery#Failover Cluster Instances#SQL Server high availability
0 notes
Text
Building a multi-zone and multi-region SQL Server Failover Cluster Instance in Azure
Much has been written about SQL Server Always On Availability Groups, but the topic of SQL Server Failover Cluster Instances (FCI) that span both availability zones and regions is far less discussed. However, for organizations that require SQL Server high availability (HA) and disaster recovery (DR) without the added licensing costs of Enterprise Edition, SQL Server FCI remains a powerful and…
0 notes
Text
AWS Exam Sample Questions 2025?
To effectively prepare for the AWS Certified Solutions Architect – Associate (SAA-C03) exam in 2025, follow these steps:
Understand the Exam Objectives – Review the official AWS exam guide to understand key topics.
Study with Reliable Resources – Use AWS whitepapers, documentation, and online courses.
Practice with Clearcatnet – Utilize Clearcatnet's latest practice tests to assess your knowledge and improve weak areas.
Hands-on Experience – Gain practical experience by working on AWS services in a real or simulated environment.
Review and Revise – Revisit important concepts, practice time management, and take mock tests before the exam.
By following this structured approach, you can confidently prepare and increase your chances of passing the SAA-C03 exam on your first attempt.
Which service allows you to securely connect an on-premises network to AWS?
A) AWS Direct Connect B) Amazon Route 53 C) Amazon CloudFront D) AWS Snowball
A company wants to host a web application with high availability. Which solution should they use?
A) Deploy on a single EC2 instance with an Elastic IP B) Use an Auto Scaling group across multiple Availability Zones C) Store website files on Amazon S3 and use CloudFront D) Host the application on an Amazon RDS instance
What AWS service allows you to run containerized applications without managing servers?
A) AWS Lambda B) Amazon ECS with Fargate C) Amazon RDS D) AWS Glue
Which AWS storage service provides automatic replication across multiple Availability Zones?
A) Amazon EBS B) Amazon S3 C) Amazon EC2 instance store D) AWS Snowball
How can you restrict access to an S3 bucket to only a specific VPC?
A) Use an IAM role B) Enable AWS Shield C) Use an S3 bucket policy D) Use a VPC endpoint policy
A company is designing a high-performance computing (HPC) solution using Amazon EC2 instances. The workload requires low-latency, high-bandwidth communication between instances. Which EC2 feature should the company use?
A) Placement Groups with Cluster Strategy B) Auto Scaling Groups C) EC2 Spot Instances D) Elastic Load Balancing
A company needs to store logs from multiple applications running on AWS. The logs must be available for analysis for 30 days and then automatically deleted. Which AWS service should be used?
A) Amazon S3 with a lifecycle policy B) Amazon RDS C) Amazon EFS D) Amazon EC2 instance with attached EBS volume
A company wants to run a web application in a highly available architecture using Amazon EC2 instances. The company requires automatic failover and must distribute incoming traffic across multiple instances. Which AWS service should be used?
A) AWS Auto Scaling and Application Load Balancer B) Amazon S3 and Amazon CloudFront C) AWS Lambda and API Gateway D) Amazon RDS Multi-AZ
A company is migrating a database from an on-premises data center to AWS. The database must remain online with minimal downtime during migration. Which AWS service should be used?
A) AWS Database Migration Service (DMS) B) AWS Snowball C) AWS Backup D) AWS Glue
An application running on Amazon EC2 needs to access an Amazon S3 bucket securely. What is the best practice for granting access?
A) Attach an IAM role with S3 permissions to the EC2 instance B) Store AWS access keys on the EC2 instance C) Use a security group to grant access to the S3 bucket D) Create an IAM user and share credentials with the application
For Getting More Questions and PDF Download Visit 👉 WWW.CLEARCATNET.COM
#AWS#AWSCertified#AWSCertification#AWSCloud#AWSCommunity#SAAC03#AWSExam#AWSSolutionsArchitect#AWSSAA#AWSAssociate#CloudComputing#CloudCareer#ITCertification#TechLearning#CloudEngineer#StudyTips#ExamPrep#CareerGrowth#LearnAWS#AWSJobs
0 notes
Text
Valkey 8.0 On Memorystore Expands Open-Source Performance

Google is excited to launch Valkey 8.0 in preview form on Memorystore today, making Google Cloud the first significant cloud provider to provide Valkey 8.0 as a fully managed service. This strengthens Google Cloud’s dedication to open source, building on the release of Memorystore for Valkey 7.2 in August 2024 and giving you access to the newest and best features from the Valkey open-source community.
Major League Baseball (MLB) and other customers are examples of Google cloud dedication to customer service, as demonstrated by Valkey 8.0 on Memorystore. MLB, the most storied professional sports league, processes enormous volumes of data in real-time to give fans insights and statistics during games using Memorystore.
The release of Valkey 8.0
The open-source community banded together to establish Valkey a fully open-source alternative under the BSD 3-clause license, earlier this year after Redis Inc. altered the license of Redis OSS from the permissive BSD 3-Clause license to a restrictive Source Available License (RSAL). The open-source Valkey 8.0 was made available to the public in a matter of months by the Valkey community, demonstrating the strength of unrestricted innovation and open-source cooperation.
The latest version of the open-source NoSQL in-memory data store, Valkey 8.0, was released today, according to a statement from the Linux Foundation. With major upgrades intended to improve performance, dependability, and observability for all installations, Valkey 8.0 demonstrates quick innovation. By adding new features that elevate Valkey and building on the qualities of its past open source releases, this release strengthens the foundation.
The release’s main highlights are as follows:
Throughput on AWS r7g instances is improved up to 1.2 million requests per second with intelligent multi-core usage and asynchronous I/O threading, more than three times greater than the previous version.
Enhanced cluster scalability with replicated migration states and automated failover for additional shards
Dual-channel RDB and replica backlog streaming for faster replication
Granular visibility into performance and resource utilization is provided by extensive per-slot and per-client metrics, which include pubsub clients, rehash memory, event loop latency, and command-level heavy traffic recording.
Reduced memory overhead by up to 10% with improved key storage.
Valkey 8.0 may be downloaded right now at valkey.io, and those who already have it can update with a few quick keystrokes. Valkey can be installed using pre-made container images or constructed from source.
As a fully Google managed service, Memorystore for Valkey 8.0 offers better performance, increased dependability, and complete compatibility with Redis OSS.
Wth to recently introduced asynchronous I/O capabilities, the Valkey performance benchmarks have improved. By allowing the main thread and I/O threads to run simultaneously, the improved I/O threading system maximizes throughput by minimizing bottlenecks in handling incoming requests and enabling parallel processing of commands and I/O operations. Compared to Memorystore for Redis Cluster, Memorystore for Valkey 8.0 achieves up to a 2x Queries Per Second (QPS) at microsecond latency, enabling applications to handle higher throughput with clusters of same size. Because of this, Valkey 8.0 is an excellent option for real-time, high-throughput applications that need to deliver very rapid user experiences.
Valkey 8.0 has further optimizations in addition to the throughput gain that improve the service’s overall speed:
Set union procedures can be completed more quickly with the SUNION command.
To achieve faster execution speeds, changes have been made to the ZUNIONSTORE and SDIFF commands.
For expired keys, the DEL command prevents redundant deletions.
Responses from CLUSTER SLOTS are cached to improve throughput and lower latency during cluster activities.
Large data batches benefit from increased CRC64 performance, which is essential for RDB snapshot and slot migration scenarios.
Enhancements to key-memory efficiency are another feature of Valkey 8.0 that let you store more data without having to modify your application. Performance has improved and memory overhead has decreased because to the direct embedding of keys into the main dictionary. Furthermore, the main dictionary is divided into slots by the new per-slot dictionary, which reduces memory overhead by an additional 16 bytes per key-value pair without compromising performance.
Meanwhile, a number of Google-developed innovations that were later added to the project have increased the stability of Valkey 8.0 and greatly improved cluster resilience and availability:
Even in the early phases of scaling, automatic failover for empty shards contributes to high availability by facilitating the seamless failover of newly created, slotless shards.
Replicating slot migration states lowers the chance of data unavailability during failover events and allows new replicas to immediately inherit the right state. It also helps ensure that all CLUSTER SETSLOT commands are synchronized across replicas prior to execution on the main.
Furthermore, slot migration state recovery guarantees that, during a failover, the source and destination nodes are immediately updated, preserving precise request routing to the appropriate primary without the need for operator interaction.
These improvements increase the resilience of Valkey 8.0 clusters against failures during slot transfer, providing clients with the assurance that their data will remain accessible even during intricate scaling processes.
Compliant with Redis OSS version 7.2
Similar to Valkey 7.2, Redis OSS 7.2 APIs are fully backwards compatible with Valkey 8.0, facilitating a smooth transition away from Redis. Well-known Redis clients like Jedis, redis-py, node-redis, and go-redis are completely supported, negating the need for application code changes when transferring workloads to Valkey.
Because Valkey combines the flexibility of open-source software with the dependability of managed services, it offers you an ideal mix of control and simplicity when it comes to your Redis OSS workloads.
Start using Valkey 8.0 on Memorystore
Google cloud cordially encourage you to begin using Valkey 8.0 on Memorystore right now so you can see the aforementioned improvements. Memorystore’s Valkey 8.0 offers the performance, stability, and scalability that today’s high-demanding applications require with features like zero-downtime scaling, high availability, and RDB snapshot and AOF logging based persistence.
Begin by setting up a fully managed Valkey Cluster using the gcloud or Google Cloud console, and become a part of the expanding community that is influencing the direction of truly open-source data management.
Read more on Govindhtech.com
#Valkey8.0#Memorystore#Valkey#Valkey7.2#MajorLeagueBaseball#BSD3#RedisOSS#ValkeyCluster#News#Technews#Technology#Technologynew#Technologytrends#govindhtech
0 notes
Text
7: Oracle RAC and High Availability
Oracle RAC (Real Application Clusters) is designed to provide high availability (HA), ensuring that a database remains operational even if one or more components (such as a node or instance) fail. RAC’s architecture offers failover and recovery mechanisms, client-side failover solutions like FAN (Fast Application Notification) and TAF (Transparent Application Failover), and can integrate with…
0 notes
Text
Advantages and Difficulties of Using ZooKeeper in Kubernetes

Advantages and Difficulties of Using ZooKeeper in Kubernetes
Integrating ZooKeeper with Kubernetes can significantly enhance the management of distributed systems, offering various benefits while also presenting some challenges. This post explores the advantages and difficulties associated with deploying ZooKeeper in a Kubernetes environment.
Advantages
Utilizing ZooKeeper in Kubernetes brings several notable advantages. Kubernetes excels at resource management, ensuring that ZooKeeper nodes are allocated effectively for optimal performance. Scalability is streamlined with Kubernetes, allowing you to easily adjust the number of ZooKeeper instances to meet fluctuating demands. Automated failover and self-healing features ensure high availability, as Kubernetes can automatically reschedule failed ZooKeeper pods to maintain continuous operation. Kubernetes also simplifies deployment through StatefulSets, which handle the complexities of stateful applications like ZooKeeper, making it easier to manage and scale clusters. Furthermore, the Kubernetes ZooKeeper Operator enhances this integration by automating configuration, scaling, and maintenance tasks, reducing manual intervention and potential errors.
Difficulties
Deploying ZooKeeper on Kubernetes comes with its own set of challenges. One significant difficulty is ZooKeeper’s inherent statefulness, which contrasts with Kubernetes’ focus on stateless applications. This necessitates careful management of state and configuration to ensure data consistency and reliability in a containerized environment. Ensuring persistent storage for ZooKeeper data is crucial, as improper storage solutions can impact data durability and performance. Complex network configurations within Kubernetes can pose hurdles for reliable service discovery and communication between ZooKeeper instances. Additionally, security is a critical concern, as containerized environments introduce new potential vulnerabilities, requiring stringent access controls and encryption practices. Resource allocation and performance tuning are essential to prevent bottlenecks and maintain efficiency. Finally, upgrading ZooKeeper and Kubernetes components requires thorough testing to ensure compatibility and avoid disruptions.
In conclusion, deploying ZooKeeper in Kubernetes offers a range of advantages, including enhanced scalability and simplified management, but also presents challenges related to statefulness, storage, network configuration, and security. By understanding these factors and leveraging tools like the Kubernetes ZooKeeper Operator, organizations can effectively navigate these challenges and optimize their ZooKeeper deployments.
To gather more knowledge about deploying ZooKeeper on Kubernetes, Click here.
1 note
·
View note
Text
JAVA Administration in SAP Basis

Java Administration in SAP Basis: A Comprehensive Guide
SAP systems often integrate both ABAP (Advanced Business Application Programming) and Java stacks to power enterprise applications. The Java stack within SAP NetWeaver Application Server (AS Java) necessitates specialized administration, and that’s where SAP Basis administrators play a vital role. In this blog, we’ll delve into the key concepts of Java administration within the SAP Basis domain.
Key Java Administration Tools
SAP provides a suite of tools to manage the AS Java environment:
Config Tool: A command-line utility for handling system-wide configuration. It modifies configuration files and cluster-wide properties.
Visual Administrator: A graphical tool offering a broad range of administration activities including:
Monitoring Java instances and processes
Deploying/undeploying applications
Configuring services
Managing log files and tracing
NetWeaver Administrator (NWA): A web-based administration tool included in later SAP NetWeaver versions. NWA provides an overarching view of both Java and ABAP stacks for centralized management.
Essential Administration Tasks
SAP Basis administrators are responsible for several crucial tasks in the AS Java domain:
Starting and Stopping Instances: Ensure the availability of Java instances and services by managing their startup, controlled shutdown, and restarts. This can be done through tools like the SAP Management Console, Visual Administrator, or NWA.
Monitoring: Proactively monitor resource usage (CPU, memory), log files, system health, and Java server processes to identify and troubleshoot potential issues.
Deploying and Managing Applications: Handle the deployment of Java-based applications (such as WAR and EAR files) and manage their lifecycle within the SAP system.
User Management: Create and maintain user accounts, roles, and authorizations within the AS Java to control access and security.
Performance Tuning: Analyze system performance and implement optimizations at various levels, including JVM parameters, application configuration, and infrastructure adjustments.
Troubleshooting: Diagnose and resolve errors in Java applications, the Java stack itself, or in the interaction between Java and ABAP components.
Additional Considerations
JCo (Java Connector): Become familiar with the JCo library, crucial for communication between ABAP and Java stacks.
Security: Enforce security concepts relevant to Java, including SSL configuration, authentication, and authorization.
High Availability: Design and implement high-availability solutions for Java instances, including clustering and failover mechanisms.
Backup and Recovery: Define strategies for backing up Java applications and configurations, as part of an overall disaster recovery plan.
Conclusion
Java administration is a critical aspect of SAP Basis administration. By mastering these concepts and tools, SAP Basis administrators can ensure the smooth operation and optimal performance of the Java components within SAP landscapes.
youtube
You can find more information about SAP BASIS in this SAP BASIS Link
Conclusion:
Unogeeks is the No.1 IT Training Institute for SAP BASIS Training. Anyone Disagree? Please drop in a comment
You can check out our other latest blogs on SAP BASIS here – SAP BASIS Blogs
You can check out our Best In Class SAP BASIS Details here – SAP BASIS Training
Follow & Connect with us:
———————————-
For Training inquiries:
Call/Whatsapp: +91 73960 33555
Mail us at: [email protected]
Our Website ➜ https://unogeeks.com
Follow us:
Instagram: https://www.instagram.com/unogeeks
Facebook:https://www.facebook.com/UnogeeksSoftwareTrainingInstitute
Twitter: https://twitter.com/unogeek
#Unogeeks #training #Unogeekstraining
0 notes
Text
Jkloglevel

Log Levels Python
Log Level Info Vs Debug
Log Level Data
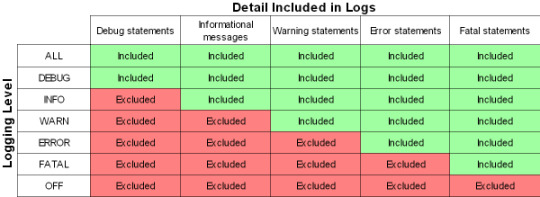
Would it be possible to reproduce with 'JkLogLevel debug' and provide access to the logs and you config (Jk dircetives from httpd and workers.properties, plus info about vhost structure)? That will produce loads of log output though, so one would typically only do it on a test system. High Availability (HA) is the ability for the system to continue functioning after the failure of one or more of the servers. A part of High Availability is failover.
In this example, the app server is located on the same host as the Apache HTTP daemon, and accepts incoming connections on the port 8009 (the default setting for the Tomcat application server).
LoadModule jkmodule modules/modjk.so JkLogFile logs/modjk.log JkLogLevel info JkShmFile logs/modjk.shm JkWorkersFile conf/workers.properties Save and close the file when you are finished. Next, we will create the worker properties file. We will use this to define a worker to connect to our Tomcat backend.
Introduction
This article describes three ways to reverse proxy a tomcat server instance using apache server. The examples below reverse proxy the petclinic web application. These have been tested using a linux server and should be readily applicable to any apache httpd installation.
The methods described here use:
mod_proxy : a standard http reverse proxy
mod_proxy_ajp : a similar configuration that connects to the tomcat ajp port
mod_jk : a module usually used for load balancing in a one server configuration
If you wish to go further and use a cluster of tomcat servers please have a look at post where I explain how to add load balancing capabilities to a cluster of tomcat application servers.
Log Levels Python
Using the HTTP protocol and mod_proxy_http
This configuration requires to have the following modules loaded :
Log Level Info Vs Debug
proxy_module
proxy_connect_module
proxy_http_module
Using the AJP protocol and mod_proxy_ajp
This configuration requires to have the following modules loaded :
proxy_module
proxy_connect_module
proxy_ajp_module
Log Level Data
Using the AJP protocol and mod_jk
This configuration uses the mod_jk module.
mod_jk configuration
To activate mod_jk, add and activate the following configuration

mod_jk worker configuration
the following if the internal mod_jk configuration. Add and actuivat this configuration (for instance in /etc/apache2/conf.d/workers.properties)
Reverse proxy configuration
Once mod_jk is configured, use it simply as following :
1 note
·
View note
Text
Strangulating bare-metal infrastructure to Containers
Change is inevitable. Change for the better is a full-time job ~ Adlai Stevenson I
We run a successful digital platform for one of our clients. It manages huge amounts of data aggregation and analysis in Out of Home advertising domain.
The platform had been running successfully for a while. Our original implementation was focused on time to market. As it expanded across geographies and impact, we decided to shift our infrastructure to containers for reasons outlined later in the post. Our day to day operations and release cadence needed to remain unaffected during this migration. To ensure those goals, we chose an approach of incremental strangulation to make the shift.
Strangler pattern is an established pattern that has been used in the software industry at various levels of abstraction. Documented by Microsoft and talked about by Martin Fowler are just two examples. The basic premise is to build an incremental replacement for an existing system or sub-system. The approach often involves creating a Strangler Facade that abstracts both existing and new implementations consistently. As features are re-implemented with improvements behind the facade, the traffic or calls are incrementally routed via new implementation. This approach is taken until all the traffic/calls go only via new implementation and old implementation can be deprecated. We applied the same approach to gradually rebuild the infrastructure in a fundamentally different way. Because of the approach taken our production disruption was under a few minutes.
This writeup will explore some of the scaffolding we did to enable the transition and the approach leading to a quick switch over with confidence. We will also talk about tech stack from an infrastructure point of view and the shift that we brought in. We believe the approach is generic enough to be applied across a wide array of deployments.
The as-is
###Infrastructure
We rely on Amazon Web Service to do the heavy lifting for infrastructure. At the same time, we try to stay away from cloud-provider lock-in by using components that are open source or can be hosted independently if needed. Our infrastructure consisted of services in double digits, at least 3 different data stores, messaging queues, an elaborate centralized logging setup (Elastic-search, Logstash and Kibana) as well as monitoring cluster with (Grafana and Prometheus). The provisioning and deployments were automated with Ansible. A combination of queues and load balancers provided us with the capability to scale services. Databases were configured with replica sets with automated failovers. The service deployment topology across servers was pre-determined and configured manually in Ansible config. Auto-scaling was not built into the design because our traffic and user-base are pretty stable and we have reasonable forewarning for a capacity change. All machines were bare-metal machines and multiple services co-existed on each machine. All servers were organized across various VPCs and subnets for security fencing and were accessible only via bastion instance.
###Release cadence
Delivering code to production early and frequently is core to the way we work. All the code added within a sprint is released to production at the end. Some features can span across sprints. The feature toggle service allows features to be enabled/disable in various environments. We are a fairly large team divided into small cohesive streams. To manage release cadence across all streams, we trigger an auto-release to our UAT environment at a fixed schedule at the end of the sprint. The point-in-time snapshot of the git master is released. We do a subsequent automated deploy to production that is triggered manually.
CI and release pipelines
Code and release pipelines are managed in Gitlab. Each service has GitLab pipelines to test, build, package and deploy. Before the infrastructure migration, the deployment folder was co-located with source code to tag/version deployment and code together. The deploy pipelines in GitLab triggered Ansible deployment that deployed binary to various environments.
Figure 1 — The as-is release process with Ansible + BareMetal combination
The gaps
While we had a very stable infrastructure and matured deployment process, we had aspirations which required some changes to the existing infrastructure. This section will outline some of the gaps and aspirations.
Cost of adding a new service
Adding a new service meant that we needed to replicate and setup deployment scripts for the service. We also needed to plan deployment topology. This planning required taking into account the existing machine loads, resource requirements as well as the resource needs of the new service. When required new hardware was provisioned. Even with that, we couldn’t dynamically optimize infrastructure use. All of this required precious time to be spent planning the deployment structure and changes to the configuration.
Lack of service isolation
Multiple services ran on each box without any isolation or sandboxing. A bug in service could fill up the disk with logs and have a cascading effect on other services. We addressed these issues with automated checks both at package time and runtime however our services were always susceptible to noisy neighbour issue without service sandboxing.
Multi-AZ deployments
High availability setup required meticulous planning. While we had a multi-node deployment for each component, we did not have a safeguard against an availability zone failure. Planning for an availability zone required leveraging Amazon Web Service’s constructs which would have locked us in deeper into the AWS infrastructure. We wanted to address this without a significant lock-in.
Lack of artefact promotion
Our release process was centred around branches, not artefacts. Every auto-release created a branch called RELEASE that was promoted across environments. Artefacts were rebuilt on the branch. This isn’t ideal as a change in an external dependency within the same version can cause a failure in a rare scenario. Artefact versioning and promotion are more ideal in our opinion. There is higher confidence attached to releasing a tested binary.
Need for a low-cost spin-up of environment
As we expanded into more geographical regions rapidly, spinning up full-fledged environments quickly became crucial. In addition to that without infrastructure optimization, the cost continued to mount up, leaving a lot of room for optimization. If we could re-use the underlying hardware across environments, we could reduce operational costs.
Provisioning cost at deployment time
Any significant changes to the underlying machine were made during deployment time. This effectively meant that we paid the cost of provisioning during deployments. This led to longer deployment downtime in some cases.
Considering containers & Kubernetes
It was possible to address most of the existing gaps in the infrastructure with additional changes. For instance, Route53 would have allowed us to set up services for high availability across AZs, extending Ansible would have enabled multi-AZ support and changing build pipelines and scripts could have brought in artefact promotion.
However, containers, specifically Kubernetes solved a lot of those issues either out of the box or with small effort. Using KOps also allowed us to remained cloud-agnostic for a large part. We decided that moving to containers will provide the much-needed service isolation as well as other benefits including lower cost of operation with higher availability.
Since containers differ significantly in how they are packaged and deployed. We needed an approach that had a minimum or zero impact to the day to day operations and ongoing production releases. This required some thinking and planning. Rest of the post covers an overview of our thinking, approach and the results.
The infrastructure strangulation
A big change like this warrants experimentation and confidence that it will meet all our needs with reasonable trade-offs. So we decided to adopt the process incrementally. The strangulation approach was a great fit for an incremental rollout. It helped in assessing all the aspects early on. It also gave us enough time to get everyone on the team up to speed. Having a good operating knowledge of deployment and infrastructure concerns across the team is crucial for us. The whole team collectively owns the production, deployments and infrastructure setup. We rotate on responsibilities and production support.
Our plan was a multi-step process. Each step was designed to give us more confidence and incremental improvement without disrupting the existing deployment and release process. We also prioritized the most uncertain areas first to ensure that we address the biggest issues at the start itself.
We chose Helm as the Kubernetes package manager to help us with the deployments and image management. The images were stored and scanned in AWS ECR.
The first service
We picked the most complicated service as the first candidate for migration. A change was required to augment the packaging step. In addition to the existing binary file, we added a step to generate a docker image as well. Once the service was packaged and ready to be deployed, we provisioned the underlying Kubernetes infrastructure to deploy our containers. We could deploy only one service at this point but that was ok to prove the correctness of the approach. We updated GitLab pipelines to enable dual deploy. Upon code check-in, the binary would get deployed to existing test environments as well as to new Kubernetes setup.
Some of the things we gained out of these steps were the confidence of reliably converting our services into Docker images and the fact that dual deploy could work automatically without any disruption to existing work.
Migrating logging & monitoring
The second step was to prove that our logging and monitoring stack could continue to work with containers. To address this, we provisioned new servers for both logging and monitoring. We also evaluated Loki to see if we could converge tooling for logging and monitoring. However, due to various gaps in Loki given our need, we stayed with ElasticSearch stack. We did replace logstash and filebeat with Fluentd. This helped us address some of the issues that we had seen with filebeat our old infrastructure. Monitoring had new dashboards for the Kubernetes setup as we now cared about both pods as well in addition to host machine health.
At the end of the step, we had a functioning logging and monitoring stack which could show data for a single Kubernetes service container as well across logical service/component. It made us confident about the observability of our infrastructure. We kept new and old logging & monitoring infrastructure separate to keep the migration overhead out of the picture. Our approach was to keep both of them alive in parallel until the end of the data retention period.
Addressing stateful components
One of the key ingredients for strangulation was to make any changes to stateful components post initial migration. This way, both the new and old infrastructure can point to the same data stores and reflect/update data state uniformly.
So as part of this step, we configured newly deployed service to point to existing data stores and ensure that all read/writes worked seamlessly and reflected on both infrastructures.
Deployment repository and pipeline replication
With one service and support system ready, we extracted out a generic way to build images with docker files and deployment to new infrastructure. These steps could be used to add dual-deployment to all services. We also changed our deployment approach. In a new setup, the deployment code lived in a separate repository where each environment and region was represented by a branch example uk-qa,uk-prod or in-qa etc. These branches carried the variables for the region + environment. In addition to that, we provisioned a Hashicorp Vault to manage secrets and introduced structure to retrieve them by region + environment combination. We introduced namespaces to accommodate multiple environments over the same underlying hardware.
Crowd-sourced migration of services
Once we had basic building blocks ready, the next big step was to convert all our remaining services to have a dual deployment step for new infrastructure. This was an opportunity to familiarize the team with new infrastructure. So we organized a session where people paired up to migrate one service per pair. This introduced everyone to docker files, new deployment pipelines and infrastructure setup.
Because the process was jointly driven by the whole team, we migrated all the services to have dual deployment path in a couple of days. At the end of the process, we had all services ready to be deployed across two environments concurrently.
Test environment migration
At this point, we did a shift and updated the Nameservers with updated DNS for our QA and UAT environments. The existing domain started pointing to Kubernetes setup. Once the setup was stable, we decommissioned the old infrastructure. We also removed old GitLab pipelines. Forcing only Kubernetes setup for all test environments forced us to address the issues promptly.
In a couple of days, we were running all our test environments across Kubernetes. Each team member stepped up to address the fault lines that surfaced. Running this only on test environments for a couple of sprints gave us enough feedback and confidence in our ability to understand and handle issues.
Establishing dual deployment cadence
While we were running Kubernetes on the test environment, the production was still on old infrastructure and dual deployments were working as expected. We continued to release to production in the old style.
We would generate images that could be deployed to production but they were not deployed and merely archived.

Figure 2 — Using Dual deployment to toggle deployment path to new infrastructure
As the test environment ran on Kubernetes and got stabilized, we used the time to establish dual deployment cadence across all non-prod environments.
Troubleshooting and strengthening
Before migrating to the production we spent time addressing and assessing a few things.
We updated the liveness and readiness probes for various services with the right values to ensure that long-running DB migrations don’t cause container shutdown/respawn. We eventually pulled out migrations into separate containers which could run as a job in Kubernetes rather than as a service.
We spent time establishing the right container sizing. This was driven by data from our old monitoring dashboards and the resource peaks from the past gave us a good idea of the ceiling in terms of the baseline of resources needed. We planned enough headroom considering the roll out updates for services.
We setup ECR scanning to ensure that we get notified about any vulnerabilities in our images in time so that we can address them promptly.
We ran security scans to ensure that the new infrastructure is not vulnerable to attacks that we might have overlooked.
We addressed a few performance and application issues. Particularly for batch processes, which were split across servers running the same component. This wasn’t possible in Kubernetes setup, as each instance of a service container feeds off the same central config. So we generated multiple images that were responsible for part of batch jobs and they were identified and deployed as separate containers.
Upgrading production passively
Finally, with all the testing we were confident about rolling out Kubernetes setup to the production environment. We provisioned all the underlying infrastructure across multiple availability zones and deployed services to them. The infrastructure ran in parallel and connected to all the production data stores but it did not have a public domain configured to access it. Days before going live the TTL for our DNS records was reduced to a few minutes. Next 72 hours gave us enough time to refresh this across all DNS servers.
Meanwhile, we tested and ensured that things worked as expected using an alternate hostname. Once everything was ready, we were ready for DNS switchover without any user disruption or impact.
DNS record update
The go-live switch-over involved updating the nameservers’ DNS record to point to the API gateway fronting Kubernetes infrastructure. An alternate domain name continued to point to the old infrastructure to preserve access. It remained on standby for two weeks to provide a fallback option. However, with all the testing and setup, the switch over went smooth. Eventually, the old infrastructure was decommissioned and old GitLab pipelines deleted.

Figure 3 — DNS record update to toggle from legacy infrastructure to containerized setup
We kept old logs and monitoring data stores until the end of the retention period to be able to query them in case of a need. Post-go-live the new monitoring and logging stack continued to provide needed support capabilities and visibility.
Observations and results
Post-migration, time to create environments has reduced drastically and we can reuse the underlying hardware more optimally. Our production runs all services in HA mode without an increase in the cost. We are set up across multiple availability zones. Our data stores are replicated across AZs as well although they are managed outside the Kubernetes setup. Kubernetes had a learning curve and it required a few significant architectural changes, however, because we planned for an incremental rollout with coexistence in mind, we could take our time to change, test and build confidence across the team. While it may be a bit early to conclude, the transition has been seamless and benefits are evident.
2 notes
·
View notes
Text
Setting up Always On SQL Clustering Group, with Microsoft Server 2016 and VMWare

Setting up clusters in Windows Server 2016 has become so easy. However; When integrating it with other environments, like VMWare, and AO SQL Clustering. It can get quite Tricky. First we want to setup our environment in VSphere. Next we will setup Windows Server 2016 with Failover Clustering. Then we’ll make sure to make some adjustments to DNS. Finally, We will setup AlwaysOn SQL Clustering.

Please make sure you have .NET Framework 3.5.1 or greater on the servers. Then We will need to create 2 VMs with 3 drives each. Then we will need to make sure that the drives are online, and available from other locations. However one main aspect that I had overlooked was that the Virtual Disks have to be created Eager Zero Thick not Lazy Zero Thick. I made the heinous mistake of using Lazy Zero Thick, and then could not understand why I was having so many problems.
Note: When creating virtual disks with Eager Zero Thick, it does take longer than using the faster Lazy Zero Thick option. Eager Zero Thick Disks allocates the space for the virtual disk, then zeros it all out unlike the Lazy Zero Thick which only allocates the space.
You also generally wouldn’t use Eager Zero Thick except for Microsoft clustering and Oracle programs. Once the disks are created we are reading to install Windows Server 2016.

Install either Datacenter edition or Standard edition. For this example we’ll use the standard edition. Install all the Microsoft Windows feature updates and verify that you have already allocated all the resources needed. Check that the additional Virtual Disks are available, and make sure you install the Failover Cluster feature. You may want to reboot after the feature is installed, if you have not done so. Once you installed the feature go to the Failover Cluster Manager and prepare to create the cluster. If this is a two node cluster be sure to add a Witness Server or Desktop. Once this is created and validated, go to your computer manager and verify that the virtual disks are online and initialized. Next, you will want to configure the cluster quorum settings. I created a separate server for this quorum and configured a File share witness.
Now, make sure you can access these from another computer on the secured network. You will have to setup a Host A record round robin DNS situation, where you give a specified name the 2 failover cluster nodes IP adresses in the Host address. Example: if the nodes had up address of 192.168.1.43 and 192.168.1.44. Then the two Host records you would need to create are AOSqlServer -> 192.168.1.43 and AOSqlServer -> 192.169.1.44
Finally, We will enable AlwaysOn Availability Groups on SQL Server 2016.
After Installing SQL Server 2012 or 2014 Enterprise edition on all the replicas. Please install it on as a stand-alone instance, and then we will configure SQL Server. Once you expand SQL Server Network Configuration node, and click on Protocols for MSSQLServer, you will see the TCP/IP dialog box on the right panel. Right click on the TCP/IP entry and select Enable.
In SQL Server Configuration Manager, right click on SQL Server Services to open the Properties dialog box. Navigate to the AlwaysOn High Availability tab to select the “Enable AlwaysOn Availability Groups.

Now we must configure the login accounts and the replicas that will need read write privileges.
First verify that your SQL Service Account is there and is a domain account, not a local machine account. Now login through SQL Management Studio (SSMS). Add you SQL Service account to the Administrators group on each replica (via computer management). Then allow connect permissions to the SQL Service account through SSMS: Right click on the SQL Service login to open the Properties dialog box. On each replica navigate to the Securables page and make sure Connect SQL Grant box is checked and allow remote connections. You can do this by using SSMS in the instance properties or by using sp_configure.
EXEC sp_configure ‘remote access’, 1;
GO
RECONFIGURE;
GO
Now we will create the file share through the Server Manager that the SQL Service account, and the replicas can access. The File is for the initial backup/restore process that happens to the databases when you join the AlwaysOn group during setup.

Last thing is to install the AlwaysOn Availability group. Once you’s ensured that full backups have been created, and all databases are in Full recovery mode, you will have to remove these databases from the tlog backup maintenece during the installation of Always on (you can always add them back). It could cause errors with both tlogs backing up while AlwaysOn is being created.
On you primary, open SSMS and expand the AlwaysOn High Availablity folder. Right click on the Availability Groups and select New Availability Group Wizard.

Select only the databases you want to include in the AlwaysOn group.
Next to the databases you will see the status with a blue link. If you see "Meets Prerequisites” it will signify that these databases are included in your group. If it does not say "Meets Prerequisites”, then click on the link to see more details on what needs to be corrected.
Now, you will specify and Add the Replicas. You will need to specify if you want Automatic or Manual Failover, Synchronous or Asynchronous Data Replication, and the type of Connections you are allowing to the end users.
Be sure to view the troubleshooting page if you have any issues:
http://blogs.msdn.com/b/alwaysonpro/archive/2013/12/09/trouble-shoot-error.aspx
The backup preferences tab will assist in choosing the type of backup and to prioritize the replica backups.
In the Listener tab, you will create an availability group listener button, Enter the string DNS name, enter port 1433 and enter the IP address for your listener, which should be an unused IP address on the network.
Next, you will Select Initial Data Synchronization page, join the databases to the Always on group, then verify the Full option is selected for using File Shares. For large databases select Join or Skip to restore the databases to the secondary replica. We will use Full for now. Last thing to do here is remember the SQL Service accounts and set that all replicas have read/write permissions to the file Share or it will not work.
Run the Validation checks, and make sure it the results are successful.
That is it, once you get that done you should have High availability and AlwaysOn SQL Server. I hope you’ve enjoyed this instructional blog. Please come back and visit us to see other projects.
#Always On SQL Server#High Availability SQL#Failover Cluster#SQL Failover Cluster#VMWare Failover Cluster#VMWare with MS Failover Cluster#VMWare with MSFC#AlwaysOn SQL
1 note
·
View note
Text
Central Management Server (CMS) for SQLOpsDB
Central Management Server (CMS) for SQLOpsDB
The CMS is the driver of all the data collection needs. When registering a server in CMS, follow these best practices. Register only the replicas, stand-alone, or failover cluster instances. That is do not register Availability Group Listener in same CMS group as Availability Group Replicas. This will cause duplicate data collection. The SQLOpsDB maps data by server name registered in the…

View On WordPress
0 notes
Text
Redis windows client free

Redis windows client free how to#
Redis windows client free full#
Redis windows client free trial#
Redis windows client free free#
Redis windows client free free#
Under the free trial, you can run this cluster for 2 months and write up to 20 GB of data per month to the cluster.
Redis windows client free how to#
In this post, we showed you how to set up a MemoryDB for Redis cluster. When you don’t need your cluster anymore, delete the cluster with the following steps: Remember, you can write up to 20 GB of data to the cluster per month under the free trial. After a few minutes, the cluster is running and you can connect using the Redis command line interface or any Redis client. That’s it! This sets up your MemoryDB for Redis cluster.
Redis windows client free full#
Lastly, you can choose to enable automatic snapshots for your cluster.Īmazon MemoryDB for Redis includes storage for one full snapshot of your cluster retained for 1 day.MemoryDB ACLs are based on Redis ACLs and provide user credentials and permissions to connect to the cluster. You can also create an ACL to allow only certain users access to MemoryDB commands. When selecting or creating a new security group, make sure your security group allows your client to access the default 6379 port. In the Advanced settings section, you can select the security group that has access to your cluster and choose an Access Control List (ACL).You can run this cluster for about 375 hours or 15 days (750 hours / 2) under the free trial. Alternatively, you can choose to add one replica to test reading from replicas, which creates a cluster with two instances.
Redis windows client free trial#
You can select the db.t4g.small instance type with one shard and zero replicas and run the cluster under the free trial for the whole month. Specify your node type, number of shards, and number of replicas per shard.Īs a reminder, during the free trial, you get 750 hours to run a single db.t4g.small instance for the whole month.For this post, we choose the default 6379 port and parameter groups.Next, you can select your cluster settings. When running production workloads, we recommend creating a cluster with at least two Availability Zones for high availability. This allows you to test your MemoryDB cluster with a single instance. To get started under the free trial, select a subnet with a single Availability Zone.In the Subnet groups section, you can create a subnet group by selecting one of your VPCs and providing a list of subnets that the cluster uses to distribute its nodes.In the Cluster info section, enter a name and optional description.Īll MemoryDB clusters run in an Amazon Virtual Private Cloud (Amazon VPC).On the MemoryDB console, choose Clusters in the navigation pane.To get started using Amazon MemoryDB for Redis under the free trial and set up a cluster, complete the following steps: In this post, we show you how to set up an Amazon MemoryDB for Redis cluster under the free trial. This allows you to test Amazon MemoryDB for Redis for your workloads without worrying about incurring costs during the trial. Under the free trial, you can also write 20 GB of data per month. All new and existing AWS customers get 750 hours per month on a t4g.small instance, which is enough hours to run the instance for the whole month. Today, we’re announcing a 2-month free trial for Amazon MemoryDB for Redis under the AWS Free Tier. With in-memory performance and Multi-AZ durability, you can use MemoryDB as an ultra-fast, high-performance primary database for your microservices applications. MemoryDB also stores data durably across multiple Availability Zones using a distributed transactional log, allowing fast failovers, database recovery, and node restarts. With MemoryDB, all your data is stored in memory, enabling you to achieve microsecond read and single-digit millisecond write latency and high throughput. Since then, we have expanded support to 16 AWS Regions and added support for AWS CloudFormation. On August 19, 2021, we announced Amazon MemoryDB for Redis, a new Redis-compatible, durable, in-memory database.
0 notes
Text
Redis is a free and open-source, in-memory data store used by many developers around the world as a database, cache, message broker, and streaming engine. It gains massive popularity with its broad support, high availability, performance, and flexibility. Redis supports several data structures such as lists, hashes, sets, sorted sorts, strings, streams e.t.c. The capabilities provided by Redis are well explained below: Extensibility: It has a module API that can be used to build extensions in C, C++, and Rust languages. Persistence: It keeps that dataset in memory to allow fast access. It can also persist the data by writing it to a permanent storage disk to survive reboots. High availability: It offers replication with automatic failover for standalone and clustered modes. Programmability: It supports server-side scripting with Lua and server-side stored procedures with Redis Functions. Redis replication is the process of creating exact copies of the Redis master instance. The replication is asynchronous by default. The master continues to handle queries while the replicas perform the initial synchronization or a partial resynchronization. Replication is mainly done to improve read throughput and circumvent data loss in cases of node failure. The Redis replication can be managed manually using the SLAVEOF or REPLICAOF.To make this easier, Redis Sentinel is used. This is a process that is used to automate and monitor the Redis replication failover and switchover. Sentinel requires a number of instances and then works as a group of decision-makers to determine which node is up and which one is down before triggering a failover. The below illustration will help you understand how Sentinel works. Aside from high availability, the Redis Sentinel offers more other features that include: Monitoring: It constantly checks if both the master and replica instances are running as required. Automatic failover: In case the master is not working as required, Sentinel triggers a failover and the replica is promoted to a master. The other replicas attached are then configured to use this new master. Configuration provider: It provides an authoritative source for clients’ service discovery. The clients connect to Sentinels to obtain the address of the current Redis master. Notification: It can be used to notify the system admin when something is wrong with any of the monitored Redis instances. This guide offers a deep demonstration of how to deploy HA Redis Cluster with Sentinel on Rocky Linux 8 | AlmaLinux 8. Setup Requirements. It is recommended to have at least 3 Sentinel instances for a sturdy deployment. This guide will work with 3 servers as below: HOSTNAME TASK IP ADDRESS Redis_master Master 192.168.205.2 Redis_replica1 slave1 192.168.205.3 Redis_replica2 slave2 192.168.205.33 Step 1 – Install Redis on Rocky Linux 8 | AlmaLinux 8 Redis is available in the default Rocky Linux 8 | AlmaLinux 8 repositories and can be installed on all the 3 nodes with the command: sudo dnf install vim @redis -y Once installed, start and enable the service on all the 3 nodes as shown: sudo systemctl start redis sudo systemctl enable redis Verify the status of the server: $ systemctl status redis ● redis.service - Redis persistent key-value database Loaded: loaded (/usr/lib/systemd/system/redis.service; enabled; vendor preset: disabled) Drop-In: /etc/systemd/system/redis.service.d └─limit.conf Active: active (running) since Thu 2022-06-23 05:06:50 EDT; 14s ago Main PID: 2784 (redis-server) Tasks: 4 (limit: 23682) Memory: 6.6M CGroup: /system.slice/redis.service └─2784 /usr/bin/redis-server 127.0.0.1:6379 Step 2 – Configure Redis Replication On Rocky Linux 8 | AlmaLinux 8 Normally, Redis can be configured using the /etc/redis.conf file. We will configure the master and slave instances as shown. A. Configure Redis Master server
Create a backup file and open the configuration file for editing: sudo cp /etc/redis.conf /etc/redis.conf.bak sudo vim /etc/redis.conf Begin by configuring the bind-address: bind 127.0.0.1 192.168.205.2 Next set the protected-mode to no, to allow communication with the slaves. protected-mode no You can secure the master instance using the requirepassdirective: requirepass StrongPassword Set the service to interact with systemd. supervised systemd Save the configuration file and restart the service sudo systemctl daemon-reload sudo systemctl restart redis Allow the service through the firewall: sudo firewall-cmd --zone=public --permanent --add-port=6379/tcp sudo firewall-cmd --reload B. Configure Redis Replicas We will then configure our two replicas as below: sudo cp /etc/redis.conf /etc/redis.conf.bak sudo vim /etc/redis.conf For the replicas, make the below changes, remember to replace values where required. bind 127.0.0.1 192.168.205.3 protected-mode no supervised systemd replicaof 192.168.205.2 6379 masterauth StrongPassword Replace the bind IP address with the appropriate IP address of the replica. The replicaofdirective is used to provide replication of the master server. Save the file and restart the services: sudo systemctl daemon-reload sudo systemctl restart redis Allow the service through the firewall: sudo firewall-cmd --zone=public --permanent --add-port=6379/tcp sudo firewall-cmd --reload C. Verify the Replication Once the above configurations have been made, verify the replication: On the Master node: $ redis-cli 127.0.0.1:6379> AUTH StrongPassword 127.0.0.1:6379> info replication Sample Output: On the Replicas: redis-cli info replication Sample Output. From the above output, we can all agree that we have configured Redis replication on Rocky Linux 8 | AlmaLinux 8 Step 3 – Configure Redis Sentinel on Rocky Linux 8 | AlmaLinux 8 The Redis sentinel was installed when installing the Redis server. Start and enable the service on all the 3 nodes as shown: sudo systemctl start redis-sentinel sudo systemctl enable redis-sentinel Check the status of the service: $ systemctl status redis-sentinel ● redis-sentinel.service - Redis Sentinel Loaded: loaded (/usr/lib/systemd/system/redis-sentinel.service; enabled; vendor preset: disabled) Drop-In: /etc/systemd/system/redis-sentinel.service.d └─limit.conf Active: active (running) since Thu 2022-06-23 05:27:28 EDT; 25s ago Main PID: 3127 (redis-sentinel) Tasks: 4 (limit: 23682) Memory: 6.6M CGroup: /system.slice/redis-sentinel.service └─3127 /usr/bin/redis-sentinel *:26379 [sentinel] To configure the Redis Sentinel service we will edit the file below on all the 3 nodes: sudo cp /etc/redis-sentinel.conf /etc/redis-sentinel.conf.bak sudo vim /etc/redis-sentinel.conf First, ensure the service listens on the desired port, the default port is 26379 port 26379 For Sentinel to monitor our master server, we need to configure it on the 3 nodes as shown: #On Master Server(Sentinel1)/Replica1(Sentinel2)/Replica2(Sentinel3) ....... sentinel monitor mymaster 192.168.205.2 6379 2 sentinel auth-pass mymaster StrongPassword sentinel down-after-milliseconds mymaster 10000 sentinel parallel-syncs mymaster 1 In the file: mymaster can be replaced with a desired name and password. Replace 192.168.205.2 with the master IP address Remember to put the sentinel monitor line before the sentinel auth-passline. Otherwise, the service will fail to restart. The sentinel down-after-millisecondsis used to set the time required for the master to be considered as failed if no response is received. parallel-syncsset the number of replicas to be promoted to the new master after a failover. Save the files and restart the services: sudo systemctl restart redis-sentinel Allow the service through the firewall on all the nodes: sudo firewall-cmd --zone=public --permanent --add-port=26379/tcp
sudo firewall-cmd --reload Step 4 – Check the Redis Sentinel Setup Status Now we can check the status of the Redis Sentinel Setup: On the master node: redis-cli -p 26379 info sentinel Execution output: You can view detailed information with the command: redis-cli -p 26379 sentinel master mymaster Execution output: To check the status of the slaves, use the command: redis-cli -p 26379 sentinel slaves mymaster Step 5 – Redis Sentinel Failover Testing We will test the automatic failover feature provided by Sentinel. To do this, stop the Redis service on the master server. sudo systemctl stop redis After the 10 seconds, (the down-after-milliseconds set) Check the Sentinel log file: sudo cat /var/log/redis/sentinel.log Sample Output: From the output, we can see that our replica 192.168.205.3 has been promoted to the new master. Get detailed info from the Redis CLI redis-cli -h 192.168.205.3 -p 26379 sentinel masters Sample Output: That was enough learning! That marks the end of this guide on how to deploy HA Redis Cluster with Sentinel on Rocky Linux 8 | AlmaLinux 8. I hope this was of importance to you.
0 notes
Text
Accessible: Azure Elastic SAN simply moves SAN to the cloud

What is Azure Elastic SAN? Azure is pleased to announce the general availability (GA) of Azure Elastic SAN, the first fully managed and cloud-native storage area network (SAN) that simplifies cloud SAN deployment, scaling, management, and configuration. Azure Elastic SAN streamlines the migration of large SAN environments to the cloud, improving efficiency and ease.
A SAN-like resource hierarchy, appliance-level provisioning, and dynamic resource distribution to meet the needs of diverse workloads across databases, VDIs, and business applications distinguish this enterprise-class offering. It also offers scale-on-demand, policy-based service management, cloud-native encryption, and network access security. This clever solution combines cloud storage’s flexibility with on-premises SAN systems’ scale.
Since announcing Elastic SAN’s preview, they have added many features to make it enterprise-class:
Multi-session connectivity boosts Elastic SAN performance to 80,000 IOPS and 1,280 MBps per volume, even higher on the entire SAN. SQL Failover Cluster Instances can be easily migrated to Elastic SAN volumes with shared volume support. Server-side encryption with Customer-managed Keys and private endpoint support lets you restrict data consumption and volume access. Snapshot support lets you run critical workloads safely. Elastic SAN GA will add features and expand to more regions:
Use Azure Monitor Metrics to analyze performance and capacity. Azure Policy prevents misconfiguration incidents. This release also makes snapshot export public by eliminating the sign-up process.
When to use Azure Elastic SAN Elastic SAN uses iSCSI to increase storage throughput over compute network bandwidth for throughput and IOPS-intensive workloads. Optimization of SQL Server workloads is possible. SQL Server deployments on Azure VMs sometimes require overprovisioning to reach disk throughput targets.
“Azure SQL Server data warehouse workloads needed a solution to eliminating VM and managed data disk IO bottlenecks. The Azure Elastic SAN solution removes the VM bandwidth bottleneck and boosts IO throughput. They reduced VM size and implemented constrained cores to save money on SQL server core licensing thanks to Elastic SAN performance.”
Moving your on-premises SAN to the Cloud Elastic SAN uses a resource hierarchy similar to on-premises SANs and allows provisioning of input/output operations per second (IOPS) and throughput at the resource level, dynamically sharing performance across workloads, and workload-level security policy management. This makes migrating from on-premises SANs to the cloud easier than right-sizing hundreds or thousands of disks to serve your SAN’s many workloads.
The Azure-Sponsored migration tool by Cirrus Data Solutions in the Azure Marketplace simplifies data migration planning and execution. The cost optimization wizard in Cirrus Migrate Cloud makes migrating and saving even easier:
Azure is excited about Azure Elastic SAN’s launch and sees a real opportunity for companies to lower storage TCO. Over the last 18 months, they have worked with Azure to improve Cirrus Migrate Cloud so enterprises can move live workloads to Azure Elastic SAN with a click. Offering Cirrus Migrate Cloud to accelerate Elastic SAN adoption, analyze the enterprise’s storage performance, and accurately recommend the best Azure storage is an exciting expansion of their partnership with Microsoft and extends their vision of real-time block data mobility to Azure and Elastic SAN.
Cirrus Data Solutions Chairman and CEO Wayne Lam said that we work with Cirrus Data Solutions to ensure their recommendations cover all Azure Block Storage offerings (Disks and Elastic SAN) and your storage needs. The wizard will recommend Ultra Disk, which has the lowest sub-ms latency on Azure, for single queue depth workloads like OLTP.
Consolidate storage and achieve cost efficiency at scale Elastic SAN lets you dynamically share provisioned performance across volumes for high performance at scale. A shared performance pool can handle IO spikes, so you don’t have to overprovision for workload peak traffic. You can right-size to meet your storage needs with Elastic SAN because capacity scales independently of performance. If your workload’s performance requirements are met but you need more storage capacity, you can buy that (at 25% less cost) than more performance.
Get the lowest Azure VMware Solution GiB storage cost this recently announced preview integration lets you expose an Elastic SAN volume as an external datastore to your Azure VMware Solution (AVS) cluster to increase storage capacity without adding vSAN storage nodes. Elastic SAN provides 1 TiB of storage for 6 to 8 cents per GiB per month1, the lowest AVS storage cost per GiB. Its native Azure Storage experience lets you deploy and connect an Elastic SAN datastore through the Azure Portal in minutes as a first-party service.
Azure Container Storage, the first platform-managed container-native storage service in the public cloud, offers highly scalable, cost-effective persistent volumes built natively for containers. Use fast attach and detach. Elastic SAN can back up Azure Container Storage and take advantage of iSCSI’s fast attach and detach. Elastic SAN’s dynamic resource sharing lowers storage costs, and since your data persists on volumes, you can spin down your cluster for more savings. Containerized applications running general-purpose database workloads, streaming and messaging services, or CI/CD environments benefit from its storage.
Price and performance of Azure Elastic SAN Most throughput and IOPS-intensive workloads, like databases, suit elastic SAN. To support more demanding use cases, Azure raised several performance limits:
Azure saw great results with SQL Servers during their Preview. SQL Server deployments on Azure VMs sometimes require overprovisioning to reach disk throughput targets. Since Elastic SAN uses iSCSI to increase storage throughput over compute network bandwidth, this is avoided.
With dynamic performance sharing, you can cut your monthly bill significantly. Another customer wrote data to multiple databases during the preview. If you provision for the maximum IOPS per database, these databases require 100,000 IOPS for peak performance, as shown in the simplified graphic below. In real life, some database instances spike during business hours for inquiries and others off business hours for reporting. Combining these workloads’ peak IOPS was only 50,000.
Elastic SAN lets its volumes share the total performance provisioned at the SAN level, so you can account for the combined maximum performance required by your workloads rather than the sum of the individual requirements, which often means you can provision (and pay for) less performance. In the example, you would provision 50% fewer IOPS at 50,000 IOPS than if you served individual workloads, reducing costs.
Start Elastic SAN today Follow Azure start-up instructions or consult their documentation to deploy an Elastic SAN. Azure Elastic SAN pricing has not changed for general availability. Their pricing page has the latest prices.
Read more on Govindhtech.com
0 notes
Text
Configure Always on the SQL Server instances configured on Windows Failover cluster
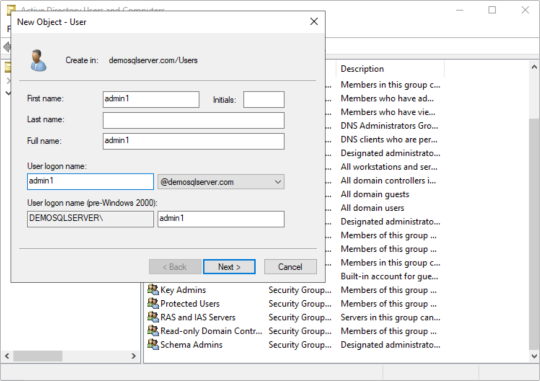
Create a domain account to access the SQL Server database. While installation you can configure these account for the services or later on you can configure the Services to start with these account and create login account in SQL Server databases with sysadmin right. Open the DSA.EXE ( Active Directory user and computer) and right click on user to add new User. Start services with new account…
View On WordPress
0 notes