#Googlesheets
Explore tagged Tumblr posts
Visit Tumblr Blog
Explore Tumblr blogs with no restrictions, modern design and the best experience.
Last Seen Tumblr Blogs


Fun Fact
Tumblr was the first site to host the blog for President Barack Obama in 2011.
Text


Caffeinated Sunday #coffee #latte #sunday
#coffee#latte#sunday#ashtonfei#freelance#upwork#youtube#onescript#google apps script#google workspace#google sheets#googlesheets#addon
6 notes
·
View notes
Text
How MoizWordpress Automated a Gaming Console Inventory with WooCommerce and Google Sheets

A few months ago, we took on a project that would challenge our creativity and technical expertise in ways we hadn't anticipated. Our client, an ambitious retailer of gaming consoles, approached us with a unique problem: they needed to streamline their inventory management, which was becoming increasingly cumbersome. The solution? A seamless integration between Google Sheets and WooCommerce that would automatically update their online store with the latest products, taxonomies, and tags. And to make it even more exciting, the entire process had to be automated through a cron job that would run at a specific time every month.
The Challenge
From the outset, we knew this project was going to be interesting. The client was managing their gaming console inventory in a Google Sheet. Every time they wanted to update their online store, they had to manually input the data into WooCommerce—a tedious process that was eating up valuable time and resources.
The goal was clear: we needed to create a system where all product data, including details like console types, storage capacities, and even color options, would be automatically imported from Google Sheets into WooCommerce. But it didn’t stop there. We also had to generate the correct taxonomies and product tags, ensuring everything was organized and searchable. And the best part? This all needed to happen on autopilot, triggered by a monthly cron job.
Crafting the Solution
We began by diving deep into the Google Sheet where the client kept all their data. Each row represented a gaming console, with columns for various attributes like brand, model, operating system, RAM, and more. We knew that every piece of information in this sheet had to find a home in WooCommerce, so we mapped out how each column would correspond to a product property, taxonomy, or tag in the store.
The first step was to create a custom WooCommerce integration that could read the Google Sheet data. We developed a script that would pull the information directly from the sheet, process it, and then push it into WooCommerce. This wasn’t just about creating products; we needed to ensure that each product was categorized correctly, with all relevant taxonomies and tags.
To make the shopping experience even better, we added a feature that allowed users to compare prices and features across different gaming consoles. This comparison tool would enable customers to make well-informed decisions, comparing specs like storage capacity, operating system, and price points—all at a glance.
We then turned our attention to the cron job. The client wanted the store to be updated automatically at a specific time each month, reflecting any changes made to the Google Sheet. To achieve this, we set up a cron job on their server that would trigger our script at the designated time. This cron job would fetch the latest data, compare it with what was already in WooCommerce, and make any necessary updates—whether it was adding new products, modifying existing ones, or deleting items no longer available.
Overcoming the Hurdles
Like any project, we encountered our share of challenges. One of the biggest was ensuring that the data transfer was both accurate and efficient. Google Sheets is a fantastic tool, but when you're dealing with large amounts of data, things can get a little tricky. We had to carefully manage how the data was read and processed to avoid any potential issues like timeouts or incomplete transfers.
Another challenge was making sure that the cron job ran smoothly without interrupting the client's site. We tested the process extensively, running it at different times and with varying amounts of data to ensure that everything would work as intended when it went live.
The Outcome
When we finally deployed the solution, the results were exactly what the client had hoped for. Their WooCommerce store was now fully integrated with Google Sheets, and the monthly cron job was keeping everything up to date without any manual intervention. The client could focus on growing their business, confident that their online store was always accurate and up-to-date.
The addition of the price and features comparison tool was a game-changer. Customers could now easily weigh their options, helping them choose the console that best suited their needs and budget. This not only enhanced the shopping experience but also built trust and transparency with their audience.
Final Thoughts
This project was a testament to what the MoizWordPress team can achieve with the right mix of creativity and technical know-how. By thoroughly understanding our client’s needs and leveraging the power of automation, we delivered a solution that not only met but exceeded their expectations. The seamless integration of Google Sheets with WooCommerce, coupled with the addition of a price and features comparison tool, truly transformed their online store.
If you’re looking to streamline your own processes, enhance your e-commerce platform, or simply want to learn more about how we can help bring your ideas to life, we’d love to hear from you. Get in touch with us today to explore how MoizWordPress can elevate your business to the next level.
#WooCommerce#GoogleSheets#Automation#Ecommerce#WebDevelopment#TechSolutions#OnlineBusiness#SmallBusiness#WordPress#CronJobs#TechInnovation#WebDesign#CustomDevelopment#TechEntrepreneur#DigitalSolutions#BusinessGrowth#RetailTech#ProjectManagement#StartupSuccess#MoizWordPress#e-commerce#NewtonBusiness#AarnaDigital#DigitalMarketing#SEO#ResponsiveDesign#Branding#TechTrends#like4like#businessgrowth
3 notes
·
View notes
Text
Plantilla de Diagrama de Gantt Gratis para descargar en Excel
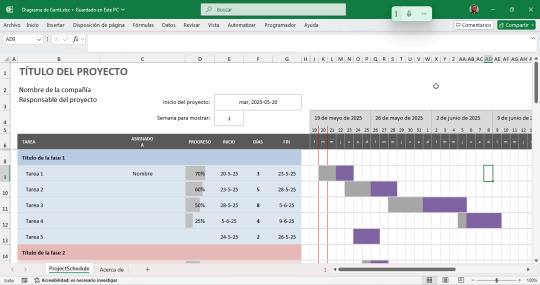
¿Te sientes abrumado por la cantidad de tareas y plazos en tus proyectos? ¡No te preocupes más! Una de las herramientas más efectivas para la gestión visual de proyectos es el Diagrama de Gantt. Y lo mejor de todo es que puedes crear uno de manera sencilla y gratuita utilizando Excel. El archivo Excel que te proporcionarpe es un diagrama de Gantt que contiene una hoja llamada "ProjectSchedule", diseñada para planificar y visualizar tareas de un proyecto a lo largo del tiempo. A continuación, te explico cómo funciona esta plantilla: 📄 Estructura general - Celdas de encabezado (filas 1 a 4): - B1: Título del proyecto. - B2: Nombre de la compañía. - B3: Responsable del proyecto. - E4: Semana de inicio que se desea mostrar. - Filas 1-4 incluyen también instrucciones sobre cómo usar la hoja. - Fila 5 – Encabezados de tabla: Contiene los encabezados para las columnas principales, tales como: - TAREA: Nombre de la actividad. - ASIGNADO A: Responsable de la tarea. - PROGRESO: Avance (%). - INICIO: Fecha de inicio. - DÍAS: Duración en días. - FIN: Fecha de término. - Luego siguen columnas por día (I5 a BL5) que representan el calendario del proyecto, con cada celda representando un día. 📊 Funcionamiento del diagrama de Gantt - Cada fila debajo de la fila 5 representa una tarea del proyecto. - Las celdas de días (desde la columna I hacia la derecha) se llenan automáticamente usando formato condicional para mostrar una barra visual del progreso, en función de la fecha de inicio y duración. - Los días se indican en el encabezado como fechas (en formato de número de serie de Excel) y como letras (l, m, m, j, v, s, d) para indicar los días de la semana. - El progreso probablemente se representa con colores que indican: - Días trabajados vs. días restantes. - Avance total en relación con lo planificado. 🔄 Automatización y fórmulas - La plantilla está diseñada para que: - Al ingresar la fecha de inicio y duración, se calcule automáticamente la fecha de fin. - Las barras de Gantt se ajusten en el calendario visual (a la derecha). - El avance se puede indicar numéricamente (en %) y se reflejará visualmente en la barra. 📘 Archivo para descargar: (verarchivo: https://fernandoarciniega.com/wp-content/uploads/Diagrama-de-Gantt.xlsx) Diagrama de GanttDescarga Read the full article
#colaboración#cronograma#diagramadeGantt#gestióndeproyectos#gestióndetiempo#GoogleSheets#herramientasgratuitas.#hojadecálculo#organización#pasoapaso#planificacióndeproyectos#plazos#productividad#tareas#tutorial#visualizacióndeproyectos
0 notes
Text
Compare Google Sheets and Microsoft Excel to find out which tool is best for your needs. Discover features, pricing, and more in this detailed guide.
0 notes
Text
Enhancing Data Organization in Google Sheets: The Importance of Adding Headers
High-quality professional Google Slides design: Common Questions Answered
1.How do I add headers in Google Sheets?
To add headers in Google Sheets, click on the row number where you want the header (usually row 1). Enter your header titles in the cells of that row. To format them, select the row and use the toolbar options to bold, change text size, or adjust background color. You can freeze the header row via View > Freeze > 1 Row.
2. How do you fragment shapes in Google Slides?
To fragment shapes in Google Slides, select the shapes you want to combine. Click on "Arrange" in the top menu, then choose "Grouping" and select "Ungroup" if they are grouped. After that, go to "Arrange" again, select "Subtract" to create fragments, or use "Intersect" for overlapping areas. Unfortunately, Google Slides does not have a direct "Fragment" feature like some other programs.
3. How do I add a line animation in Google Slides?
To add a line animation in Google Slides, first select the line you want to animate. Then, click on "Insert" in the menu, choose "Animation," and select your preferred animation type from the sidebar. Adjust the timing and trigger options as needed. Finally, click "Play" to preview the animation. Save your changes when you're satisfied.
4. How do I add transitions to text in Google Slides?
To add transitions to text in Google Slides, select the text box you want to modify. Click on "Insert" in the top menu, then choose "Animation." In the Animation panel that appears, select a transition type from the dropdown menu. Adjust the speed and click "Play" to preview. Remember to apply the transition to other text boxes if needed.
5. How do you markup on Google Slides?
To markup on Google Slides, use the "Scribble" tool in the Shapes menu. Select "Line," then choose "Scribble" to draw freehand. You can also add comments by clicking on the comment icon or using the "Insert" menu to add shapes, text boxes, or images for annotations. Adjust colors and line thickness as needed.

Visit: VS Website See: VS Portfolio
0 notes
Text
youtube
How To Hyperlink Text To A Webpage In Google Sheets
This is a video tutorial on how to hyperlink text to a website in Google Sheets. I will be using the Google Chrome web browser on a desktop PC for this.
Simple Steps
Open your project in Google Sheets.
Select the text that you want to hyperlink by left clicking on the text.
Select the "insert" tab and choose "Link" from the dropdown.
In the dialog box that opens, paste the URL that you want to hyperlink the text to.
0 notes
Text
Harnessing Google Sheets for Athlete Training Load, Wellness, and Recovery Monitoring: A Case Study from TeamLarne
In the fast-paced world of competitive sports, monitoring athlete training loads, wellness, and recovery has become an essential part of optimizing performance and preventing injuries. At TeamLarne, we’ve embraced this necessity by utilizing Google Sheets as our primary tool for data collection and analysis over the past six years. This blog post will explore how Google Sheets has transformed our…
#AthleteWellness#AthleteDevelopment#AthleteMonitoring#CoachingTips#DataDrivenCoaching#FitnessTracking#googlesheets#InjuryPrevention#PerformanceOptimization#recovery#SportsScienc#swimcoaching#TeamLarene#TeamManagement#TrainingLoad
0 notes
Text
Perfect for any project size or methodology, our templates save time and improve productivity. improve your project management and aid success with our versatile templates. Perfect for Project Managers, PMO teams, and project professionals across industries, our templates are fully customizable and compatible with Excel, Word.
#ProjectManagement#Templates#GanttChart#WBS#RiskManagement#ToDoList#RAGStatus#ProjectBrief#ProductivityTools#TaskManagement#FreeTemplates#ExcelTemplates#PowerPointTemplates#GoogleSheets#TeamCollaboration
0 notes
Text
Unlock Your Productivity with Professional Google Sheets & Excel Templates!
Transform your data management with our professional Google Sheets and Excel spreadsheets! 🌟 Get customizable templates designed to boost productivity and streamline your workflow. Perfect for tracking expenses, managing projects, and analyzing data effortlessly. Elevate your efficiency today!
#GoogleSheets#ExcelTemplates#DataManagement#Productivity#SpreadsheetTemplates#Organization#ProjectManagement#BusinessTools#Efficiency#WorkSmart#ExcelTips#GoogleSheetsTemplates#SmallBusiness#DataAnalysis#FinanceTracking
0 notes
Text
Master 10 Basic Excel & Google Sheets Formulas in One Class! Enhance Your Spreadsheet skills!
Unlock the power of Excel and Google Sheets with Krishna Academy Rewa! In this class, we'll cover 10 essential formulas and functions that will help you master spreadsheet tasks with ease. Visit More : https://www.youtube.com/watch?v=TQb35cjMFzw
What You'll Learn:
1. SUM: Add up a range of numbers effortlessly.
2. COUNTA: Count the number of non-empty cells.
3. MAX & MIN: Find the highest and lowest values in your data.
4. AVERAGE: Calculate the mean value.
5. CONCATENATE: Combine text from multiple cells.
6. COUNT: Count the number of cells that contain numbers.
7. UPPER & LOWER: Convert text to uppercase or lowercase.
8. PROPER: Capitalize the first letter of each word. Why Join Us?
1. Expert Instruction: Learn from experienced professionals at Krishna Academy Rewa.
2. Hands-On Learning: Practical examples and exercises to help you understand and apply each function.
3. Versatile Skills: These formulas are crucial for various tasks in both Excel and Google Sheets.
Don't miss this opportunity to enhance your spreadsheet skills! Subscribe to our channel for more tutorials and visit Krishna Academy Rewa for advanced courses on computer applications. -
- - #excelformulas - #GoogleSheetsFormulas - #spreadsheettips - #exceltutorial - #googlesheetstutorial - #BasicExcelFunctions - #BasicGoogleSheetsFunctions - #KrishnaAcademyRewa - #excelforbeginners - #GoogleSheetsForBeginners - #learnexcel - #LearnGoogleSheets - #computereducation - #onlinelearning - #dataanalysis - #SpreadsheetTraining - #exceltips - #googlesheetstips
0 notes
Text
A Beginner Guide to Tableau Software
Tableau Software is a powerful tool that helps you visualize data in a way that is easy to understand. Imagine you have lots of numbers and information. Tableau turns that into charts, graphs, and maps, making it simple to see patterns and trends. It is like turning a confusing spreadsheet into a colorful picture.
Getting started with Tableau is straightforward. You can drag and drop data to create different types of visualizations. It works with many data sources, like Excel, Google Sheets, and databases. You do not need to be a tech expert to use it, Tableau is designed to be user-friendly.
With Tableau, you can create dashboards that combine multiple visualizations, making it easy to share insights with others. It is great for students, business professionals, and anyone who wants to make data-driven decisions. Whether you want to track sales, analyze survey results, or see trends in website traffic, Tableau software helps you see the big picture quickly and clearly.
#Tableau#Datavisualization#Beginnerguide#Dataanalysis#Dashboards#Businessintelligence#Data#Userfriendly#Charts#Graphs#Datatrends#Visualanalytics#ExcelIntegration#Googlesheets#Databaseconnections#Datainsights
0 notes
Text


Black Friday
#coffee#latte#workday#friday#youtube#upwork#ashtonfei#google apps script#onescript#google sheets#google workspace#googlesheets#freelance#addon
3 notes
·
View notes
Text
A Step-by-Step Guide to Transferring Data from Google Sheets to Power BI

In today's data-driven world, businesses rely heavily on robust tools for data analysis and visualization. Google Sheets and Power BI are two such powerful platforms widely used for managing and analyzing data. However, integrating data from Google Sheets into Power BI can be a significant change for organizations seeking to streamline their data analysis processes. In this step-by-step guide, we will walk you through the process of transferring data from Google Sheets to Power BI, empowering you to harness the full potential of your data.
Step 1: Prepare Your Google Sheets Data
Before transferring your data to Power BI, ensure that your Google Sheets document is well-structured and organized. Clean up your data by removing any unnecessary rows or columns, fixing formatting inconsistencies, and ensuring that column headers are descriptive and consistent.
Step 2: Share Your Google Sheets Document
To access your Google Sheets data from Power BI, you will need to share your document with the appropriate permissions. Open your Google Sheets document, click on the "Share" button, and set the visibility to "Anyone with the link" or "Public," depending on your organization's privacy policies. Make sure that "View" access is granted to anyone with the link.
Step 3: Generate the Google Sheets URL
Once your Google Sheets document is shared, you will need to generate a URL that Power BI can use to access the data. Open your Google Sheets document, copy the URL from the address bar of your browser, and save it for later use.
Step 4: Connect to Google Sheets in Power BI
Now, it is time to switch to Power BI and connect to your Google Sheets data. Open Power BI Desktop or Power BI Service, depending on your preference. In Power BI Desktop, click on "Get Data" in the Home tab, select "Web" from the list of data sources, and paste the Google Sheets URL you copied earlier into the URL field. Click "OK" to proceed.
Step 5: Select Data to Import
Power BI will load the data from your Google Sheets document and display a navigator window with a preview of the available sheets. Select the sheets containing the data you want to import into Power BI and click "Load" to import the selected data into Power BI.
Once the data is imported into Power BI, you may need to perform additional transformations or cleaning steps to prepare it for analysis. Use Power BI's built-in data transformation tools to reshape, filter, or combine data from multiple sources as needed.
Step 6: Create Visualizations and Reports
With your data successfully imported into Power BI, you can now start creating visualizations and reports to gain insights into your data. Use Power BI's drag-and-drop interface to create interactive visualizations such as charts, graphs, and maps, and arrange them into insightful dashboards for easy consumption.
To ensure that your Power BI reports always reflect the latest data from your Google Sheets document, you can schedule automatic data refreshes. In Power BI Service, navigate to the dataset settings, and configure a refresh schedule that suits your needs. Power BI will automatically retrieve updated data from Google Sheets according to the specified schedule.
Step 7: Share and Collaborate
Once your reports and dashboards are ready, you can share them with your colleagues or stakeholders for collaboration and decision-making. Publish your Power BI reports to the Power BI Service and use sharing options to grant access to specific users or groups within your organization.
Step 8: Monitor and Iterate
Finally, continuously monitor the performance and effectiveness of your Power BI reports and dashboards. Gather feedback from users, analyze usage metrics, and iterate on your reports to improve insights and usability over time. Power BI's robust monitoring and analytics capabilities make it easy to track the impact of your data analysis efforts and drive continuous improvement.
By following these Eight simple steps, you can seamlessly transfer data from Google Sheets to Power BI, unlocking powerful insights and driving data-driven decision-making within your organization. Whether you are a business analyst, data scientist, or decision-maker, mastering the art of data integration with Power BI opens a world of possibilities for extracting value from your data and driving business success.
0 notes
Text
Qué es una hoja de cálculo y para qué sirve (Definición)

¿Qué es una hoja de cálculo o cómo se define? Una hoja de cálculo es una herramienta informática que permite organizar, calcular y analizar datos en una tabla compuesta por filas y columnas. Se usa comúnmente en programas como Microsoft Excel o Google Sheets para hacer presupuestos, listas, operaciones matemáticas, gráficas, entre otros.
Qué es una hoja de cálculo y para qué sirve
Las hojas de cálculo son herramientas digitales fundamentales en la organización y análisis de datos. Ya sea en el ámbito académico, profesional o personal, nos permiten realizar cálculos, ordenar información y visualizar resultados en gráficos con facilidad. ¿Qué es una hoja de cálculo? Una hoja de cálculo es un documento digital compuesto por filas (horizontales) y columnas (verticales), que forman celdas donde se ingresan datos como números, texto o fórmulas. Estos documentos se manejan en programas como: - Microsoft Excel - Google Sheets - LibreOffice Calc Cada celda puede contener una fórmula, como =A1+B1, lo que permite realizar operaciones automáticas y evitar errores de cálculo. Principales usos de una hoja de cálculo Las hojas de cálculo tienen múltiples aplicaciones, entre las que destacan: - Presupuestos personales o empresariales - Control de gastos e ingresos - Seguimiento de asistencia o calificaciones - Análisis de datos y estadísticas - Generación de gráficos - Organización de listas o inventarios Además, con sus funciones predefinidas, puedes hacer promedios, búsquedas, filtros y más, ahorrando tiempo y aumentando la precisión del trabajo. Beneficios de aprender a usar hojas de cálculo Aprender a manejar una hoja de cálculo ofrece ventajas clave en distintos contextos: - Mejora la productividad - Facilita la toma de decisiones basada en datos - Permite automatizar tareas repetitivas - Reduce errores humanos - Abre oportunidades laborales y académicas Dominar esta herramienta no solo es útil, sino necesario en la era digital actual. 1. Definición sencilla (para estudiantes de secundaria o nivel básico): Una hoja de cálculo es una tabla en la computadora donde puedes escribir datos, hacer cuentas y crear gráficas. Se usa para organizar información como listas o presupuestos. 2. Definición intermedia (para nivel medio superior): Una hoja de cálculo es un archivo digital formado por filas y columnas, que permite almacenar datos, realizar operaciones matemáticas y generar gráficos. Se utiliza mucho en administración, matemáticas y análisis de información. 3. Definición técnica (para nivel profesional): Una hoja de cálculo es una aplicación informática que permite manipular datos numéricos o alfanuméricos dispuestos en celdas organizadas en filas y columnas. Permite aplicar fórmulas, funciones, automatizar cálculos y representar datos mediante gráficos. Read the full article
#análisisdedatos#aprendizajedeExcel#automatización#cálculosenExcel#celdas#controldegastos#datosentablas#definicióndehojadecálculo#educacióndigital#ejemplosdehojadecálculo#Excel#Excelbásico.#filasycolumnas#formatodehojadecálculo#fórmulas#funciones#funcionesdehojadecálculo#funcionesmatemáticas#gestióndeinformación#GoogleSheets#gráficosenhojadecálculo#habilidadesdigitales#HerramientasdeOficina#herramientasinformáticas#hojadecálculo#LibreOfficeCalc#paraquésirveunahojadecálculo#productividadconexcel#quéesunahojadecálculo#tecnologíaeducativa
0 notes
Text
How to Group Data by Week in Google Sheets (sheetscheat.com)
0 notes
Text
Simplifying Design in Google Slides: Efficient Deletion of Unnecessary Text Boxes
High-quality professional Google Slides design: Expert Q&A Insights
1.How do I categorize data in Google Sheets?
To categorize data in Google Sheets, use the following steps:
1. Select the data range.
2. Click on "Data" in the menu.
3. Choose "Sort range" or "Create a filter" to organize your data.
4. For more advanced categorization, use functions like `FILTER`, `SORT`, or `QUERY` to group and display data based on specific criteria.
2. What format are Google Slides?
Google Slides are primarily in a web-based format, allowing users to create, edit, and share presentations online. The files are stored in Google Drive and use the slides format. Presentations can also be exported in various formats, such as Microsoft PowerPoint (.pptx), PDF, or as images. They are accessible across devices with an internet connection.
3. How do I add a column to a table in Google Slides?
To add a column to a table in Google Slides, right-click on the table where you want the new column, select "Insert column left" or "Insert column right" from the menu. You can also use the table options in the top menu by clicking on "Table," then choosing the appropriate insert column option.
4. How do I add columns in a text box in Google Slides?
To add columns in a text box in Google Slides, you can't directly format the text box into columns. Instead, you can create multiple text boxes and align them side by side to simulate columns. Alternatively, use a table for more structured content, which you can insert by selecting "Insert" > "Table" and choosing the desired number of rows and columns.
5. How do I delete a text box in Google Slides?
To delete a text box in Google Slides, click on the text box to select it. Then, press the "Delete" or "Backspace" key on your keyboard. Alternatively, you can right-click on the selected text box and choose "Delete" from the context menu. This will remove the text box from your slide.

Visit: VS Website See: VS Portfolio
0 notes