#Matlab Discrete project Help
Explore tagged Tumblr posts
Visit Tumblr Blog
Explore Tumblr blogs with no restrictions, modern design and the best experience.
Last Seen Tumblr Blogs


Fun Fact
BuzzFeed published a report claiming that Tumblr was utilized as a distribution channel for Russian agents to influence American voting habits during the 2016 presidential election in Feb 2018.
Note
hi there! i’m a high schooler and i’m seriously considering majoring in computer science when the time comes. do you think you could maybe talk a little bit about what it’s like studying comp sci? if you can. i hope you’re having a great day
hope you’re having a great day too!
What my first year of studying computer science was like
obligatory preface that courses differ between universities and colleges. i study in australia.
The biggest challenge I faced per se going into comp sci was how nothing I did at school prepared me for it. The kind of content I’ve learnt wasn’t similiar to school and the assignments have been very different. No analytical essays and scientific reports for me (there has been essays and reports tho). In my school IT class I learnt basic HTML and CSS which was the only programming knowledge I went into comp sci with. (Id also gotten pretty far on khan academy’s JavaScript course in like year ten but I’ve forgotten all of that now lol).
I have four units a semester and have completed my first year (of 3, although I’m taking less units this year so I’ll finish in 3.5 years).
What I actually did in my first year:
Semester 1 (pre-major picking, two of these were for the other major option)
Learnt general computer hardware and how it functions. The assignment was using a raspberry pi to do something that used hardware (the pi), software (basic code) and the internet (I used twitter). My project is on Twitter at SunsetIFB102
Group project app design stages. Like drawing the layouts, getting feedback, then digital sketches then semi fancy looking sketches (not comp sci major)
Python! I really liked this. Taught the basics of python and in general programming. It was kind of intimidating how many people had coded before so I had to focus on ignoring them and learning for myself. Also really salty I was 1% off a high distinction for the whole unit AGH
Databases and SQL. This would’ve been a useful unit if the lecturer was, how do I put this kindly, good at his job. (Not comp sci major, although definitely use databases later on)
Semester two (all comp sci major)
C# , basics of object oriented programming principles. Which is a fancy way of saying it taught how you should write your code so it’s laid out effectively.
C, how to program microprocessors. Basically how to program hardware machines. C is mostly used for machines like ATMs, a fridge perhaps, probably a roomba and other single purpose kind of things. Also from this I can program arduinos and read arduino code easier since arduino code is a C/C++ hybrid. (This and the previous unit had high fail rates and were honestly Tough)
Information security (apart of network security minor) This unit talked about processes of protecting information in organisations and on a single person level. Basics of cryptography was discussed and hashes and how ways information is kept secure when transferring between objects (like over the internet)
Computation mathematics (apart of intelligent systems minor). This was a weird unit to me and was mostly math majors. It taught all these different equations which allow you to make approximations. Honestly confused how it’s used for computers but we learnt MATLAB and it’s a pre requisite for an intro to robotics unit I’m taking this year :)
So yeah, that’s an account of what I actually studied. Reading over it it seems way more impressive than it probably was. Computer science isn’t easy (well, unless you want to scrape a pass each time) but it isn’t horribly difficult. It’s how different it is to high school work that can trip you up. I can’t make aesthetic studyblr notes on paper because its all on my computer and can’t turn it off when studying because I need it.
My assignments are typically big coding projects, exams (multiple choice if a coding unit) and essays if it deals with theory (like info sec did).
This coming semester I’m learning Java and GUI’s (graphical user interfaces), JavaScript and HTML and whatever else for web applications, and discrete maths which seems to be for notation used later on... it looks very strange.
Hope this helps! If you have any more questions feel free to DM me!
Also if anyone else wants to add their experiences, feel free to reblog with your tips.
#computer science#software engineering#engineering#comp sci#studyblr#study tips#tips#help#stem#stem studyblr#stemblr#women in stem#women in tech#women in science#university#college
107 notes
·
View notes
Text
Matlab Discrete Assignment Homework Help
https://www.matlabhomeworkexperts.com/matlab-in-discrete-time-signal-operations.php
Simulink models can process both discrete-time and continuous-time signals. Models built with DSP System Toolbox software are often intended to process discrete-time signals only. A Discrete-Time Signal is a sequence of values that correspond to particular instants in time. Our services are available 24×7 that helps the students of universities and colleges in order to make Discrete Time Signal Operations assignments. We provide Matlab Discrete Time Signal Operations solutions which are of high quality and it can be provided to the students of colleges, universities, or PhD. Discrete Time Signal Operations in MATLAB deals with basic concepts in mathematics and Discrete Time Signal Operations such as matrix and vector algebra, convolution, iterated operations, etc.
We at www.matlabhomeworkexperts.com have talented pool of Discrete Time Signal Operations homework experts, Discrete Time Signal Operations assignment tutors, Discrete Time Signal Operations professionals, Discrete Time Signal Operations Solvers and Discrete Time Signal Operations Helpers can cater to your entire needs in the area of Discrete Time Signal Operations such as MATLAB Discrete Time Signal Operations Homework Help, MATLAB Discrete Time Signal Operations Assignment Help, MATLAB Discrete Time Signal Operations Project Paper Help, MATLAB Discrete Time Signal Operations Tutoring help and MATLAB Discrete Time Signal Operations Exam Preparation Help.
#Matlab Discrete Assignment Homework Help#Matlab Discrete Assignment Help#Matlab Discrete project Help#Matlab Discrete Assignment Experts#Online Matlab Discrete Assignment Homework Help#Matlab Discrete Assignment Homework Online Help#Matlab Discrete Help
0 notes
Text
Osirix md stanford


Projects include applying machine learning for the improved quantitation of MRS and MRI data for the treatment monitoring of brain tumors and measuring brain metabolism under hypothermic conditions. You will be joining a multidisciplinary research team with expertise spanning physics, electrical engineering, biochemistry, and clinical sciences, to help develop novel data acquisition and processing tools for assessing critical in vivo processes. Title/Project: Magnetic resonance methods for measuring brain energy metabolism and oxidative stress.īeyond anatomy, magnetic resonance imaging (MRI) and spectroscopy (MRS) provide unique opportunities for assessing metabolism within the body.

Familiarity with Python, Matlab, or C++ programming languages. Suitable for students with EE, BioE, Physics, CS, or similar backgrounds. Seeking highly motivated students enthusiastic about research. A remote option will be available, regardless of project. Possible lab projects include developing advanced CT acquisition methods or evaluating a novel dual-layer x-ray detector. Possible computational projects include the use of AI to improve COVID detection in chest x-ray images, to optimize CT for radiation dose and image quality, to improve breast tumor detection in breast CT, or to improve spectral CT imaging. The REU project will be customized to the student’s skills and interests, and a lab mentor will be identified accordingly. We develop these technologies with advanced computational tools, in the Zeego Lab (a robotic C-arm that supports interventional imaging, animal studies, and more), and in the Tabletop X-Ray CT Lab (for prototyping novel systems, custom geometries, and phantom experiments). My group develops technologies for advanced x-ray and CT imaging, including artificial intelligence (AI) methods, novel system designs, and spectral CT imaging. colleges/University may apply (visa restrictions may apply). International students who are matriculated at U.S. rising juniors or seniors) and have not graduated by the beginning of the program. Undergraduate students from other institutions who have 2 years of college experience (i.e. Housing is not provided, although additional funds for on-campus summer housing will be offered to accepted interns (Stanford students only). Stanford undergrads must have been enrolled full-time for a minimum of 2 quarters in the 2020-2021 academic year and will need to use their Flex Time for the summer quarter. Stanford Undergrads who will not have graduated by the beginning of the program. Selected students will receive a stipend of $5,000 for the 10-week (40 hours per week) summer session of full-time research work. Students are also required to present their research at the final presentation/poster session and complete a program questionnaire.įor summer 2021, the RSL REU program will feature a flexible hybrid format (remote and/or on-site). Students are expected to participate for the duration of the program (exceptions may be granted at the discretion of the faculty mentor). This is a 10-week program starting June 21 to Aug(40 hours per week). Check back with us next year! Program Requirements: This software may not be redistributed, sold or commercially used in any other way without prior approval of the author.May update: All applications are closed. If you do use this software for scientific research please give appropriate credit in publications. Any other use is entirely at the discretion and risk of the user. YOU CAN ONLY USE OSIRIX AS A REVIEWING AND SCIENTIFIC SOFTWARE, NOT FOR PRIMARY DIAGNOSTIC.ĬERTIFIED VERSION OF OSIRIX IS AVAILABLE HERE: OSIRIX MDĪll calculations, measurements and images provided by this software are intended only for scientific research. THIS VERSION OF OSIRIX IS NOT CERTIFIED AS A MEDICAL DEVICE FOR PRIMARY DIAGNOSIS. THIS SOFTWARE IS NOT INTENDED FOR PRIMARY DIAGNOSTIC, ONLY FOR SCIENTIFIC USAGE. YOU MAY HAVE ADDITIONAL RIGHTS AND SOME OF THESE LIMITATIONS MAY NOT APPLY TO YOU. THESE EXCLUSIONS AND LIMITATIONS MAY NOT APPLY IN ALL JURISDICTIONS. UNDER NO CIRCUMSTANCES SHALL THE AUTHORS BE LIABLE FOR DIRECT, INDIRECT, SPECIAL, INCIDENTAL, OR CONSEQUENTIAL DAMAGES RESULTING FROM THE USE, MISUSE, OR INABILITY TO USE THE SOFTWARE, EVEN IF THE AUTHOR HAS BEEN ADVISED OF THE POSSIBILITY OF SUCH DAMAGES. NO ORAL OR WRITTEN COMMUNICATION FROM OR INFORMATION PROVIDED BY THE AUTHORS SHALL CREATE A WARRANTY. THE AUTHORS MAKE NO WARRANTIES AS TO PERFORMANCE OR FITNESS FOR A PARTICULAR PURPOSE, OR ANY OTHER WARRANTIES WHETHER EXPRESSED OR IMPLIED. OSIRIX (“THE SOFTWARE”) IS PROVIDED AS IS.
0 notes
Text
Why Choose All Homework Assignments For the Data mining Assignment Help?
About Data Mining
Data Mining Project is one of the most important and most interesting subjects to the students of data mining. Today, when the technology is at its boom, data analysis and the data mining are the two most prevalent options for the job seeker to learn. Below are some of the key concepts that are used in data mining in a nutshell:
Definition :Data mining is the subject in which the patterns of the important data are mined from the raw data source that is given to you. There are millions of files residing on the different servers around the globe. The technique of bringing the data that is useful for the users is known as data mining.
Application of data mining: Today is the world of digitization and data mining plays a major role in giving the relevant information to the users all over the internet. However, it’s not just the internet, but there are many application of data mining in the different fields like business in knowing the customer relationship, market basket analysis, and so on. The applications of data mining stretches to the field of science, medicine, human rights, games and many more.
Tools used for data mining: Agent mining, anomaly detection, Bayesian networks, classifications, decision trees, genetic algorithm, machine learning, time series analysis, neural networks, and so on are the different techniques involved while people do data mining. More emphasis is given to the machine learning these days as it is one of the booming areas of the time. There are many open source tools available in the market that helps in data mining. R and MATLAB along with many other important language are there that help in data mining at https://www.allhomeworkassignments.com/
Different assignment topics: Other than the introductory aspects of the data mining different important aspects are supposed to be learned by the students. Hence when the student seeks Data Mining Assignment Help they find the topics like OLAP operations, Data preprocessing, Data Cleaning, Data Transformation, Data Reduction, Discretization and generating concept hierarchies, Weka 3 Data Mining System, filters, discretization, Data mining knowledge representation, Task-relevant data. Although the there is more if you dig into the advanced concept of the data mining, however, these are most common topics.
All these important points tell us that data mining is not only one of the important subjects but it is a vast subject as well. Hence if the students are finding some online/offline tool for their Data Mining Homework Help, then All Homework Assignments are there to assist them in.
Why Choose All Homework Assignments For The Data Mining Assignment Help?
Well, https://www.allhomeworkassignments.com/ have the experts that will help the student with the every topic related to the data mining. They will not just get them the exact answers, but they will also help them with the new ideas for their dissertations. The flexible tuition classes are provided so that the students can learn all the basics of data mining. Moreover, the editors that we have are highly capable of giving you a unique content without any plagiarism. A 24*7 customer support is also provided to you so that you can have the solution to all your queries within the time.
If you are wondering about of we be able to write the assignment in the format that you want, then rest assured because we are the global facility who will help you no matter from what education system you belong. https://www.bestassignmentsupport.com/ are obliged to deliver you the assignment in time and hence you should register with all assignment experts today.
#Data Mining Assignment Help#Data Mining Assignment Homework Help#Data Mining Homework Help#Data Mining Experts Help#Data Mining Project Help
0 notes
Text
Why do I receive different results when comparing a digital ?
Why do I receive different results when comparing a digital filter designed using the BUTTER and BILINEAR functions in the
Signal Processing
Toolbox?Using the following specifications:
Fs = 172800; Fc = 70000;
where "Fs" represents the sampling frequency and "Fc" represents the cutoff frequency, I created a digital filter in two different ways:
1. Using the BUTTER function.
[B ,A] = butter(4,Fc/(Fs/2));
2. Using the BILINEAR function to convert the analog filter designed using the BUTTER function into a digital filter through a bilinear transformation.
[Bs,As] = butter(4,Fc*2*pi,'s'); [Bz,Az] = bilinear(Bs,As,Fs);
I then used the FVTOOL function to compute the magnitude response and compared the two results:
fvtool(B,A,Bz,Az);
Notice that the results of the two magnitude responses are not the same even though I am using the same specifications.
ANSWER
Matlabsolutions.com provide latest MatLab Homework Help,MatLab Assignment Help for students, engineers and researchers in Multiple Branches like ECE, EEE, CSE, Mechanical, Civil with 100% output.Matlab Code for B.E, B.Tech,M.E,M.Tech, Ph.D. Scholars with 100% privacy guaranteed. Get MATLAB projects with source code for your learning and research.
This is the expected behavior for filter discretization in the
Signal Processing
Toolbox. The example above illustrates the nonlinear nature of the bilinear transformation. To counteract this nonlinearity, it is necessary to create analog domain filters with "prewarped" band edges, which map to the correct locations upon bilinear transformation. If you want to design the analog filter that will be equivalent to the design using the ‘s’ option in the BUTTER function, you need to prewarp the frequency as follows:
Wc = tan(pi/2*Fc/(Fs/2)); % Analog prewarped freq. rad/second
Note that this frequency is already in rad/second so the analog design is:
[Bs,As] = butter(4,Wc,'s');
Now the issue is what sampling frequency (Fs) to use with BILINEAR. In the prewarping method used to compute "Wc", we implicitly used the bilinear transformation that is most commonly seen in the literature:
s=(1-z^(-1))/(1+z^(-1)).
In the BILINEAR function documentation, the following transformation is used:
SEE COMPLETE ANSWER CLICK THE LINK
https://www.matlabsolutions.com/resources/why-do-i-receive-different-results-when-comparing-a-digital-.php
0 notes
Text
The 100 Most Popular Free Online Courses of 2019
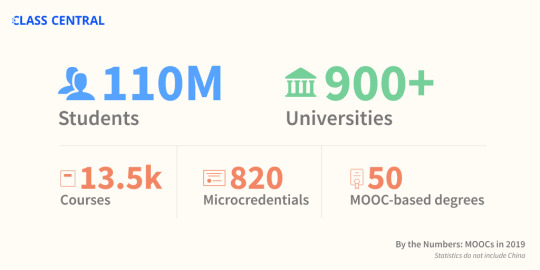
It’s been eight years since a few Stanford professors decided to offer their courses online for free. These courses are now known popularly as MOOCs or Massive Open Online Courses.
And since then, over 900 universities have launched 13,500 online courses. These courses have been taken by 110 million learners.
Not all of these courses are as free as they used to be. Some now charge for certifications or require you to pay to access the full course materials. But you can still audit them for free.
I’ve been keeping track of these courses the entire time over at Class Central - ever since free online courses rose to prominence. It's been 8 years since I founded Class Central, and have helped more than 20 million learners decide which online courses to take.
Methodology: How we determined the Top 100 Free Courses of 2019
In the first step, we went through Class Central’s database and made a list of all the courses that were offered for the first time ever in 2019. We found that 450 universities around the world have now launched more than 2,500 courses.
Then Suparn wrote scrapers to collect enrollment numbers for three different course providers: Coursera, edX, and Swayam. Each of these providers show how many students are enrolled on their course pages. These three providers alone registered around 5 million enrollments for courses launched in 2019.
Along with this, we also explored data from our users. Most importantly: how many times a course has been bookmarked on Class Central.
Using the provider's enrollment data and our own bookmarks data, we came up with a list of 100 most popular courses of 2019 - a wide assortment from 68 universities.
You can also find this list on Class Central which I built using Class Central’s Custom List feature. Not all the courses on this list might be available, but if you bookmark a course on Class Central, then we will let you know when it is offered next.
And now... 2019's Most Popular Online Courses
Here are the most popular free online university courses of 2019 (not ordered by popularity).
Understanding Multiple Sclerosis (MS) from University of Tasmania ★★★★★(246)
Differential Equations for Engineers from The Hong Kong University of Science and Technology ★★★★★(32)
Teaching English: How to Plan a Great Lesson from British Council ★★★★★(125)
Understanding IELTS: Speaking from British Council ★★★★★(26)
The Art of Structural Engineering: Vaults from Princeton University ★★★★★(17)
Improving Your Study Techniques from University of Groningen ★★★★★(20)
Mathematical Economics from Doon University, Dehradun ★★★★★(75)
Constitutional Interpretation from Princeton University ★★★★★(16)
Happier Employees and Return-On-Investment Course from The University of Texas at Austin ★★★★★(10)
Gender and Sexuality: Applications in Society from The University of British Columbia ★★★★★(48)
The IB Extended Essay: Managing your Research Project from University of Leeds ★★★★★(32)
Agile Leadership Principles from University System of Maryland ★★★★★(124)
ANIMATIONs from Banaras Hindu University ★★★★☆(61)
Python and Statistics for Financial Analysis from The Hong Kong University of Science and Technology ★★★★☆(58)
Unlocking Information Security: Part Ⅰ from Tel Aviv University ★★★★★(2)
Digital Security and Human Rights from Amnesty International ★★★★★(1)
Fundamentals of Statistics from Massachusetts Institute of Technology ★★★★★(1)
Herbal Medicine from University of Minnesota ★★★★★(1)
Ideas for a Better World: Leading Change Through Policymaking from British Council ★★★★★(1)
Ethical Hacking from Indian Institute of Technology, Kharagpur ★★★★★(1)
Data Analysis: A Practical Introduction for Absolute Beginners from Microsoft ★★★★☆(1)
The Tudors from University of Roehampton ★★★★☆(1)
C for Everyone: Programming Fundamentals from University of California, Santa Cruz ★★★★☆(1)
Hacking Exercise For Health. The surprising new science of fitness. from McMaster University ★★★★☆(2)
Python for Data Science and AI from IBM ★★★☆☆(1)
Critical thinking: reasoned decision making from Tecnológico de Monterrey ★★☆☆☆(1)
Brand Identity and Strategy from IE Business School
Weight Management: Beyond Balancing Calories from Emory University
Introduction to Artificial Intelligence (AI) from IBM
Introduction to TensorFlow for Artificial Intelligence, Machine Learning, and Deep Learning from deeplearning.ai
Applying Data Analytics in Marketing from University of Illinois at Urbana-Champaign
Getting Started with AWS Machine Learning from Amazon Web Services
The Language of Design: Form and Meaning from California Institute of the Arts
Developing a Systems Mindset from University of Colorado Boulder
Introduction to Android graphics from Imperial College London
The Neuromarketing Toolbox from Copenhagen Business School
Empowering Yourself in a Post-Truth World from State University of New York
Introduction to Self-Determination Theory: An approach to motivation, development and wellness from University of Rochester
Counseling Practice and Research from Seoul National University
China’s Political and Intellectual Foundations: From Sage Kings to Confucius from Harvard University
Blockchain and FinTech: Basics, Applications, and Limitations from The University of Hong Kong
[email protected]: Basic Job Interview Skills from Hong Kong Polytechnic University
Child Protection: Children’s Rights in Theory and Practice from Harvard University
Freedom of Expression and Information in the Time of Globalization: Foundational Course from Columbia University
CS50 for Lawyers from Harvard University
Women Making History: Ten Objects, Many Stories from Harvard University
Advanced Android with Kotlin from Google
The New World of Arnold Schönberg’s Piano Music from Stanford University
Exploring GraphQL: A Query Language for APIs from Linux Foundation
Rhetoric: The Art of Persuasive Writing and Public Speaking from Harvard University
The Future of Work: Preparing for Disruption from The World Bank
Research and Development in Discrete Industries
Backyard Meteorology: The Science of Weather from Harvard University
Academic writing for clarity and meaning from University of the Witwatersrand
The Health Effects of Climate Change from Harvard University
Mindfulness and Resilience to Stress at Work from University of California, Berkeley
Machine Learning with Python: from Linear Models to Deep Learning from Massachusetts Institute of Technology
Inclusive Education: Essential Knowledge for Success from Queensland University of Technology
Data Analysis for Decision Making from University System of Maryland
Introduction to Encryption and Cryptography from Raspberry Pi Foundation
Introduction to Self-Driving Cars from University of Toronto
Cannabis, Mental Health, and Brain Disorders from University of Colorado Boulder
Managing ADHD, Autism, Learning Disabilities, and Concussion in School from University of Colorado System
Applying Data Analytics in Finance from University of Illinois at Urbana-Champaign
Introduction to Applied Machine Learning from Alberta Machine Intelligence Institute
Introduction to Climate Change and Health from Yale University
Python and Machine Learning for Asset Management from EDHEC Business School
Negotiation skills: Negotiate and resolve conflict from Macquarie University
Foundational Skills for Communicating About Health from University of Michigan
Hypothesis-Driven Development from University of Virginia
Exploring Renewable Energy Schemes from University of Pennsylvania
Improving Your Statistical Questions from Eindhoven University of Technology
Exploratory Data Analysis with MATLAB from MathWorks
Machine Learning from The University of Texas at Austin
Personal growth basics (for people with limited health abilities) from Ural Federal University
Financial Development and Financial Inclusion from International Monetary Fund
Steps in Japanese for Beginners1 Part1 from Waseda University
GMBA824 Know your customers from Macquarie University
Nutrition: Eating to Live Well from Tapei Medical University
Food and Mood: Improving Mental Health Through Diet and Nutrition from Deakin University
An Introduction to Programming through C++ from Indian Institute of Technology Bombay
Artificial Intelligence Search Methods For Problem Solving from Indian Institute of Technology Madras
Programming in Java from Indian Institute of Technology, Kharagpur
Joy of computing using Python from Indian Institute of Technology, Ropar
Introduction to Machine Learning (IITM) from Indian Institute of Technology Madras
Programming, Data Structures And Algorithms Using Python from Chennai Mathematical Institute
Python for Data Science from Indian Institute of Technology Madras
Developing Soft Skills and Personality from Indian Institute of Technology Kanpur
Caring for Children Moving Alone: Protecting Unaccompanied and Separated Children from University of Strathclyde
Managing People: Understanding Individual Differences from University of Reading
Digital Transformation in the Classroom from Norwegian University of Science and Technology
From data base to big data from Université Côte d’Azur
Diplomacy in the 21st Century from The Open University
Understanding Gender Inequality from University of Exeter
Successful Negotiation: Essential Strategies and Skills from University of Michigan
Science Communication and Public Engagement from EIT Food
English Pronunciation in a Global World from University of Amsterdam
America’s Opioid Epidemic: From Evidence to Impact from Johns Hopkins University
Understanding ADHD: Current Research and Practice from King’s College London
End of Life Care: Challenges and Innovation from University of Glasgow
via freeCodeCamp.org https://ift.tt/2LY9YRd
1 note
·
View note
Text
Week 2
August 15, 2017
Today, we are taught of some of the things that we can do on Matlab. I brought my laptop since I have already installed there the application. When logging in on my account, I encountered a problem on typing in my password because some of the letters in the keyboard do not work. So I somehow panicked and asked for help. And the good thing here is that there is an onscreen keyboard that can be used in this type of emergency. It is not that quick to use like a real keyboard but I still thank God there are solutions to every problem.
So my classmates and I opened the Matlab application on our computers as told by our instructor. Sir Arboleda showed us the Matlab lecture projected on the board. He introduced to us the command codes that we can type on the command window such as plot, stem and grid on. Plot (n, x) is used to plot the given points of n and x like a line graph. Stem (n, x) plots the function through separate vertical lines with circle as a default tip which shows that the function is discrete or not continuous. The graph shown can be modified by changing the colors of the lines and changing the shapes of the tip through the command stem (n, x, ‘r+’). We can also customize the graph by giving title using the Title () command and put labels for x an y using xlabel('n') and ylabel('n'). To show accuracy of the plotted points, the command grid on can be used. Sir Arboleda let us type the codes projected on the screen so we can see the results and explore the use of commands by letting other values, colors or shapes on the graph.
We also learned how to create M-Files using the M-File editor and save it on a current folder. Furthermore, we are also taught about the types of sequences: unit sample sequence, unit step sequence, and unit ramp sequence; and the even and odd functions. Unit means one, so the unit sample pertains to a function that shows one sample of a value. Unit step sequence shows a series of values which depends on the limits given. On the other hand, unit ramp signal is a signal that increases as n increases. From the term itself “ramp”, it shows a series of separate values but in the form of increasing slope. There are two different methods on how to make the given type of signals: through the M-file method, where obviously it uses M-file to make codes; and the direct method with only uses the command window with a different set of codes. We practiced executing the different methods of the various types of signals by copying the codes given in front of us. We are given a time to change and try other values for another results so we can be trained on doing our own codes and get used to it for the purpose of learning Matlab well.
About quarter to 10 in the morning, we are given a drill problem which will be our practical exam for the day. When we are already working on it, Sir Arboleda realized that we only have few minutes left in the class so he told us to do the exam on our homes. He then proceeded on discussing the remaining lesson for the day which is about even and odd functions. Before we end our class, he gave us an assignment in which we will go the library, find a Digital Signal Processing book and solve the exercises given using the M-file method and the direct method through the Matlab.
1 note
·
View note
Text
We provide test banks and solution manuals to allow students to prepare for their exams ,( Immediate delivery , at Suitable prices ). For contact: [email protected]
Managerial Accounting 11 edition by Ray H Garrison
Biology: The Essentials 2nd Edition by Mariëlle Hoefnagels Business Mathematics in Canada by F. Ernest Jerome Discrete Mathematics and Its Applications 8th Edition by Kenneth Rosen Sociology: A Brief Introduction 6th Edition by Richard T. Schaefer Pharmacology: An Introduction 7th Edition by Henry Hitner Fundamentals of Financial Accounting 6th Edition by Fred Phillips iGenetics: A Molecular Approach 3rd Edition by Peter J. Russell Business Communication: A Problem-Solving Approach 1st Edition by Kathryn Rentz Math for Business and Finance An Algebraic Approach 2nd Edition by Jeffrey Slater Abnormal Child Psychology 7th Edition by Eric J Mash Business Statistics in Practice: Using Data, Modeling, and Analytics 8th Edition by Bruce L Bowerman Workbook for Anatomy, Physiology, & Disease 2nd Edition by Deborah Roiger Operations Management in the Supply Chain 7th Edition by Roger G Schroeder Selling 10th Edition by Stephen B Castleberry Personal Finance 7 edition by Jack R. Kapoor M: Information Systems 4th Edition by Paige Baltzan Conceptual Physical Science, 6th Edition by Paul G. Hewitt Operations and Supply Chain Management: The Core 4th Edition by F. Robert Jacobs Human Resource Management 15th Edition by Robert L. Mathis Human Relations: The Art and Science of Building Effective Relationships 2nd Edition by Vivian McCann Adolescence and Emerging Adulthood A Cultural Approach 6th Edition by Jeffrey Jensen Arnett Auditing: A Practical Approach, 3rd Canadian Edition by Robyn Moroney Starting Out with Java From Control Structures through Objects, 7th Edition by Tony Gaddis Building Your Dream Canadian 10th Edition by Walter Good Business Foundations: A Changing World 11th Edition by O. C. Ferrell Strategic Compensation in Canada, 6th Edition by Richard Long Theory and Practice of Group Counseling 9th Edition by Gerald Corey Counseling Research: Quantitative, Qualitative, and Mixed Methods 2nd Edition by Carl J. Sheperis Management: Leading & Collaborating in a Competitive World 13th Edition by Thomas S Bateman Integrated Marketing Communications Strategic Planning Perspectives, 5E by Keith J. Tuckwell Essentials of Organizational Behaviour, First Canadian Edition by Stephen P. Robbins Behavior Modification: Principles and Procedures 6th Edition by Raymond G. Miltenberger Management, 3rd Canadian Edition by John R. Schermerhorn Life Span Development: A Topical Approach 3rd Edition by Robert S. Feldman Database Systems: Design, Implementation, & Management 13th Edition by Carlos Coronel Quantitative Analysis for Management 13th Edition by Barry Render Psychology: From Inquiry to Understanding, Third Canadian Edition by Steven J Lynn Investments: An Introduction 12th Edition by Herbert B. Mayo Business: A Changing World 6 edition by O. C. Ferrell Managerial Economics & Business Strategy 9th Edition by Michael Baye Small Business Management: An Entrepreneur's Guidebook 8th Edition by Mary Jane Byrd Becoming a Helper 7th Edition by Marianne Schneider Introduction to Management Science: A Modeling and Case Studies Approach with Spreadsheets 6th Edition Operations and Supply Chain Management 15th Edition by F. Robert Jacobs Human Anatomy & Physiology 11th Edition by Elaine N. Marieb Principles of Auditing & Other Assurance Services 21st Edition by Ray Whittington Business: Strategy, Development, Application 2 edition by Gary Bissonette Business Ethics Now 5th Edition by Andrew W. Ghillyer Health & Physical Assessment In Nursing 3rd Edition by Donita T D'Amico Business Data Communications and Networking, 13th Edition by Jerry FitzGerald Network+ Guide to Networks 8th Edition by Jill West Project Management: Achieving Competitive Advantage 4th Edition by Jeffrey K. Pinto Auditing & Assurance Services: A Systematic Approach 11th ed. Edition by William F Messier The Art of Watching Films 9th Edition by Dennis W. Petrie Accounting Principles, Volume 1+2, 7th Canadian Edition by Jerry J. Weygandt Core Concepts of Accounting Information Systems, 14th Edition by Mark G. Simkin Canadian Tax Principles, 2018-2019 Edition, Volume 1 by Clarence Byrd Advertising and Promotion: An Integrated Marketing Communications Perspective 11th Edition by George Belch Contemporary Human Geography 4th Edition by James M. Rubenstein Organizational Behavior 18th Edition by Stephen P. Robbins Essentials of Oceanography 12th Edition by Alan P. Trujillo Foundations of Microeconomics 8th Edition by Robin Bade Human Physiology: From Cells to Systems 9th Edition by Lauralee Sherwood Social Psychology 14th Edition by Nyla R. Branscombe Marketing Management 3rd Edition by Greg W. Marshall Supply Chain Management: Strategy, Planning, and Operation 7th Edition Applied Numerical Methods with MATLAB for Engineers and Scientists 4th Edition by Steven C. Chapra Research Methods For Business: A Skill Building Approach, 7th Edition by Uma Sekaran Fundamentals of Advanced Accounting 7th Edition by Joe Ben Hoyle Managerial Economics: Applications, Strategies and Tactics 13th Edition by James R. McGuigan Criminalistics: An Introduction to Forensic Science 12th Edition by Richard Saferstein Close Relations An Introduction to the Sociology of Families, 6E by Susan A. McDaniel M: Advertising 3rd Edition by William Arens Vander's Human Physiology 15th Edition by Eric Widmaier Medical Law and Ethics 5th Edition by Bonnie F. Fremgen Principles of Macroeconomics 12th Edition by Karl E. Case Environmental Geology 11th Edition by Carla W Montgomery Chemical Principles 8th Edition by Steven S. Zumdahl Principles of Managerial Finance, Brief, 8th Edition by Chad J. Zutter Understanding Financial Statements, 11th Edition by Lyn M. Fraser Exploring Macroeconomics by Robert Sexton Operations Management 6th Edition by William J Stevenson Communicating in Groups: Applications and Skills 10th Edition by Katherine L. Adams Essentials of Marketing Research 4th Edition by Joseph F. Hair Operations Management, 1st Edition by Gerard Cachon Legal and Ethical Aspects of Health Information Management 4th Edition by Dana C. McWay Managing Organizational Change: A Multiple Perspectives Approach 3rd Edition by Ian Palmer Marketing The Core 5th Canadian Edition by Roger Kerin SELL 5th Edition by Thomas N. Ingram Anatomy & Physiology: An Integrative Approach 3rd Edition by Michael McKinley Intermediate Accounting, Volume 1, 12th Canadian Edition by: Donald E. Kieso Price = $28.66 Introduction to Geographic Information Systems 9th Edition by Kang-tsung Chang HR 4th Edition by Angelo DeNisi Understanding Canadian Business by William G Nickels TG Business Driven Information Systems 6th Edition by Paige Baltzan Price = $27.88 Strategic Management: Concepts 4th Edition by Frank Rothaermel Price = $27.91 Essentials of Contemporary Management 5 edition by Gareth R Jones Price = $26.55 Environmental Science 15th Edition by Eldon Enger Price = $27.89 Employee Training & Development 7th Edition by Raymond Andrew Noe Price = $26.66 Financial Accounting, 10th Edition by Jerry J. Weygandt Price= $26.79 Physical Geology 16th Edition by Charles (Carlos) C Plummer price =$27.77 Principles of Microeconomics, 7th Edition by N. Gregory Mankiw Price = $26.98 Marketing 4 edition by Dhruv Grewal Price = $27.69 Auditing & Assurance Services 7th Edition by Timothy J Louwers Price = $27.78 Communication Principles for a Lifetime, Books a la Carte Edition 6th Edition by Steven A. Beebe Price = $25.95 Microeconomics Theory and Applications with Calculus, 4th Edition by Jeffrey M. Perloff Price = $26.77 Business and Society: Stakeholders, Ethics, Public Policy 15th Edition by Anne T. Lawrence Price = $26.65 Essentials of Negotiation 3rd Canadian Edition by Roy Lewicki Price = $27.89 Medical Dosage Calculations 11th Edition by June L. Olsen Price = $25.95 Exceptional Students: Preparing Teachers for the 21st Century 3rd Edition by Ronald L. Taylor Price = $26.66 Intermediate Accounting 10th Edition by David Spiceland Price = $27.93 Fundamentals of Corporate Finance, 4th Edition by: Robert Parrino Leadership: Research Findings, Practice, and Skills 8th Edition by Andrew J. DuBrin America: Past and Present, Combined Volume 10th Edition by Robert A. Divine Price = $25.55 Exploring Physical Geography 2nd Edition by Stephen Reynolds Price = $26.91 Concepts of Genetics 12th Edition by William S. Klug Services Marketing: Integrating Customer Focus Across the Firm 7th Edition by Valarie A. Zeithaml Price = $26.53 Human Resource Management 11Th Edition by Raymond Andrew Noe Price = $27.62 Natural Disasters 10th Edition by Patrick Leon Abbott Price = $26.55 MKTG 12th Edition by Charles W. Lamb Medical Assisting Review: Passing The CMA, RMA, and CCMA Exams 6th Edition By Jahangir Moini Price = $25.76 Global Business Today 5th edition by Charles W. L. Hill Dr Human Relations in Organizations: Applications and Skill Building 11th Edition by Robert Lussier Price = $26.75 Technology: At Your Service 1st Edition by Ralph De Arazoza ( only 6 chapters) not pub Fundamentals of Taxation 2016 Edition 9th Edition by Ana M. Cruz Managing Performance through Training and Development , 8th Edition by Alan Saks Price = $27.89 Life Span: Human Development for Helping Professionals, 5th Edition by Patricia C. Broderick Price = $26.97 Ethical Dilemmas and Decisions in Criminal Justice 10th Edition by Joycelyn M. Pollock Price = $27.77 Foundations of Financial Management 10 edition Canadian Edition by Stanley B. Block M: Marketing 6th Edition by Dhruv Grewal Price = $27.76 Campbell Biology 11th Edition by Lisa A. Urry Price = $26.64 The Family Dynamic Canadian Perspectives, 7th Edition by Marc Belanger Price = $27.88 Genetics: Analysis and Principles 6th Edition by Robert Brooker Price = $26.93 Test Bank for Macroeconomics, Fifth Canadian Edition (5th Edition) by Stephen D. Williamson Price = $27.63 M: Organizational Behavior 4th Edition by Steven McShane Price = $27.62 Organizational Behavior 8th Edition by Steven McShane Price = $26.71 Discovering the Lifespan, Second Canadian Edition 2E by Robert S. Feldman Price = $25.97 Calculus: Early Transcendental Functions 7th Edition by Ron Larson Price = $27.98 Macroeconomics 21st Edition by Campbell McConnell Price = $27.91 Macroeconomics 11th Edition by David Colander Price = $28.59 Java Foundations: Introduction to Program Design and Data Structures 4th Edition by John Lewis Price = $26.55 Psychology Themes and Variations , 5th Edition Price = $26.79 Using Sage 50 Accounting 2017 Plus Student DVD by Mary Purbhoo Price = $27.71 Auditing An International Approach 8th Edition © 2019 by Wally Smieliauskas Price = $27.89 Marketing for Hospitality and Tourism 7th Edition by Philip T. Kotler Price = $25.97 Crisis Assessment, Intervention, and Prevention, 3rd Edition by Lisa R. Jackson-Cherry Price = $23.94 Using Sage 50 Accounting 2018 by Mary Purbhoo Price = $26.98 Natural Hazards: Earth's Processes as Hazards, Disasters and Catastrophes, Third Canadian Edition by John J. Clague Price = $25.52 Labor Relations: Striking a Balance 5th Edition by John W. Budd Price = $25.57 Practical Research: Planning and Design 12th Edition by Paul D. Leedy Price = $24.65 Essentials of Meteorology: An Invitation to the Atmosphere 8th Edition by C. Donald Ahrens Price = $25.95 Intermediate Accounting, Volume 2, 12th Canadian Edition by Donald E. Kieso Price = $28.66 Recruitment and Selection in Canada 7th Edition © 2019 by Victor M. Catano Price = $23.97 MKTG, 4th Edition Canadian Edition By Charles W. Lamb Shearer Price = $26.91 Strategic Compensation in Canada , 6th Edition by Richard Long Price = $25.55 Management of Occupational Health and Safety , 7th Edition by Kevin Kelloway Price = $24.92 Human Anatomy & Physiology Laboratory Manual, Fetal Pig Version 13th Edition by Elaine N. Marieb Price = $28.76 Chemistry: Atoms First 3rd Edition by Julia Burdge Price = $26.55 International Business, 2nd Edition by Klaus Meyer Price = $25.98 Abnormal Psychology An Integrative Approach , 5th Edition by David H. Barlow Price = $25.95 Using Intuit QuickBooks Premier 2017 for Windows by Christine A. Heaney Price = $28.96 Investigating Oceanography 2nd Edition by Keith A Sverdrup Price = $24.96 Natural Disasters 11th Edition By Patrick Leon Abbott Price = $25.95 Natural Disasters Canadian 4th Edition by Patrick Leon Abbott Price = $27.62 Personality Psychology: Domains of Knowledge About Human Nature 6th Edition by Randy J. Larsen Price = $24.76 Corporate Finance 5th Edition By Jonathan Berk Price = $28.93 Financial Accounting, 2nd Canadian Edition by Christopher D. Burnley Price = $23.91 Organic Chemistry 8th Edition by Paula Yurkanis Bruice Price = $27.61 Psychological Consultation and Collaboration in School and Community Settings, 6th Edition by A. Michael Dougherty Price = $23.91 McGraw-Hill's Taxation of Individuals and Business Entities 2020 Edition 11th Edition by Brian C. Spilker Price = $27.65 McGraw-Hill's Taxation of Business Entities 2020 Edition 11th Edition by Brian C. Spilker Professor Price = $27.65 McGraw-Hill's Taxation of Individuals 2020 Edition 11th Edition by Brian C. Spilker Price = $27.65 Wardlaw's Contemporary Nutrition A Functional Approach 5th Edition by Anne M Smith Price = $26.51 Contemporary Marketing 18th Edition by Louis E. Boone Price = $27.65 Managing Human Resources 11th Edition by Wayne Cascio Price = $26.69 Children and Their Development, Fourth Canadian Edition, 4th Edition By Robert V. Kail Price = $26.99 Labor Economics 8th Edition by George J Borjas Price = $27.66 International Economics 17th Edition by Thomas Pugel Price = $27.63 International Economics 17th Edition by Robert Carbaugh Price = $26.99 Strategic Management and Competitive Advantage: Concepts and Cases 6th Edition by Jay B. Barney Price = $27.53 Perspectives on Personality, Books a la Carte 8th Edition by Charles S. Carver Price = $25.56 MATH AND DOSAGE CALCULATIONS FOR HEALTHCARE PROFESSIONALS 5th Edition by Kathryn A. Booth Price = $28.45 Medical Assisting: Administrative and Clinical Procedures 6th Edition by Kathryn Booth Price = $26.84 Exploring Social Psychology 8th Edition by David Myers Price = $25.59 Macroeconomics 7th Edition by R. Glenn Hubbard Price = $27.86 MIS 9th Edition by Hossein Bidgoli Price = $25.55 Core Concepts in Health 3rd Edition By Jennifer Irwin Price = $25.55 The Science of Psychology: An Appreciative 4th Edition by Laura A. King Price = $26.55 Intro to Python for Computer Science and Data Science Learning to Program with AI, Big Data and The Cloud Paul J. Deitel The Good Earth: Introduction to Earth Science 4th Edition by David McConnell Price = $25.95 Introduction to Physical Education, Exercise Science, and Sport 10th Edition by Angela Lumpkin Price = $25.92 QuickBooks Desktop 2018: A Complete Course 17th Edition by Janet Horne Price = $29.81 Introduction to Biotechnology 4th Edition by William J. Thieman Price = $26.97 Operations Management: Processes and Supply Chains 12th Edition by Lee J. Krajewski Price = $27.69
0 notes
Text
MATLAB In Discrete Time Signal Operations Homework Assignment Help
A Discrete-Time Signal is a sequence of values that correspond to particular instants in time. Our services are available 24×7 that helps the students of universities and colleges in order to make Discrete Time Signal Operations assignments. We at MatlabHomeworkExperts.com have talented pool of Discrete Time Signal Operations homework experts, Discrete Time Signal Operations assignment tutors, Discrete Time Signal Operations professionals, Discrete Time Signal Operations Solvers and Discrete Time Signal Operations Helpers can cater to your entire needs in the area of Discrete Time Signal Operations. We provide Matlab Discrete Time Signal Operations solutions which are of high quality and it can be provided to the students of colleges, universities, or PhD. Discrete Time Signal Operations in MATLAB deals with basic concepts in mathematics and Discrete Time Signal Operations such as matrix and vector algebra, convolution, iterated operations, etc.
0 notes
Link
Digital Signal Processing, as the name suggests, is a branch of Signal Processing, which deals with signals encoded in the form of AC/DC discrete/continuous time-based pulse signals. Digital Signal Processing is one of the key rudimentary courses taught at the undergraduate level.DSP System Assignment Help
For any guidance regarding MATLAB Digital Signal Processing Assignment, MATLAB Digital Signal Processing Homework, MATLAB Digital Signal Processing Projects, etc. feel free to get in touch with our MATLAB tutors.
0 notes
Text
MATLAB DSP System Assignment Help
www.answersportals.com is the best online MATLAB DSP System Assignment Help service provider. Students can be rest assured after submitting their MATLAB DSP System homework to us. Our expert put their 100 % and our work has always helped students to score good grades. In case you have any MATLAB DSP System Assignment or projects feel free to contact us either through email or live chat at www.answersportals.com. Our expert will do his best and you can receive a highest quality, plagiarism free and accurately done assignment in your inbox within the mentioned deadline. We would like to discuss few topics under MATLAB DSP System:
Analyze the stability of systems
Digital Filter Structures
Digital Signal Processing
Discrete-Time Fourier analysis
Discrete-Time Signals and Systems
Filter Design Using MatLab
Finite impulse response system
find the system transfer function
finite impulse response digital filters
Introduction to MatLab and SimuLink
Optimal Equal- Ripple Design Techniques
Sampling/reconstruction of continuous time signals
The Z-Transform
Two-dimensional signals and introductory image
0 notes
Text
Rumba Workstation
NASDAQ Workstation
Are you tired of obtaining to deal with the space hogging nature of computers, monitors, scanners, DVDs, printers and cables sprawling out of handle? The U.S. Division of Education’s (USDE) gainful employment regulations require disclosure of particular system information for programs that lead to certificates or diplomas and are monetary aid eligible. (Not necessarily an issue if you plan on possessing it tucked away, though you’ll definitely notice it if you engage in some of that aforementioned schlepping.) It also appears much less black than it does on Apple’s internet site – far more like the “Space Gray” that it really is. As it happens, that case is easy to unlock and slip off, on the rare occasion that you want to replace the RAM, storage or a single of the GPUs. Users can run 3D simulations and edit 8K video in true time with up to 56 processing cores and up to three TB of primary memory, 3x the capacity of its predecessor4.

If your perform atmosphere does not let you to break up your work day with periodic stretching sessions, you ought to definitely take into account purchasing an ergonomic seat cushion to give middle and reduce back assistance and relieve you of pressure points. As the cherry on best, the Asrock Rack EP2C602 server motherboard we picked up for putting this build with each other fees about the identical quantity as a high-end X99 motherboard, $300 brand new So the two Xeons and the dual-socket motherboard came to a total of just $500, less than the asking price tag of a single hexa-core 6850K. For less income you can get a much better performing consumer card and devote that cash on an SSD or ECC board and RAM. – To steer clear of any possibility of a skipper and therefore loss of income, the hotel will typically ask for an advance payment or deposit at the time of check-in.

youtube
GSA’s Federal clientele get between $1.five and $two billion each year in computer systems and telecommunicaions hardware, software and solutions from over 1,000 firms with Multiple Award Schedules. Combining the truth that Intel Core processor family does not help multi-CPU. LIMS is utilized to connect analytical instruments in the laboratory to one particular or a number of individual computers or workstations. This configuration came with an Intel Xeon 1535M (7th gen), 32GB RAM, and 512GB HP Z Turbo drive. Cloud-based solutions are shortening the technologies gap between little and massive companies as it enables customers to leverage enterprise grade solutions at tiny company costs. Selecting the quantity of processing cores in your AutoCAD workstation is essential.
Our desks are available in a range of designs and shapes from rectangular or wave to ergonomic, and in tough supplies, such as wood, steel or glass. By contrast, Parallels Workstation (offered as a totally free beta) is stated to supply “close to native” overall performance, which may possibly be adequate for users who require to run Visio, Project, or one particular of the many other Windows-only productivity apps – though gamers will most likely nonetheless want to use Boot Camp and maintain just one particular OS operating at a time. Ususally I run the simulations in series (tuning model and manage parameters, etc.) despite the fact that at times they could run in parallel for Monte-Carlo-sort simulations, should MATLAB permit so (Parallel Processing Toolbox?). Dell Precision Xeon Dual Core Workstation.
In this article, you are going to understand more about ergonomic workplace furniture and what an critical function it plays in your organization. Correct-Height Workstations are height adjustable industrial workstations that offer ergonomic options to manufacturing industries that need men and women to function in a single location for a period of time and execute a particular task or tasks. This higher stylish,simplicity and sensible desk is a best workstation for either the house href=”https://kelsusit.com/refurbished-computer-workstations/”> click for source study or office workplace. Intel’s integrated Iris graphics are good sufficient for numerous who use a lot more fundamental computer software and programs. • Sets up workstations for out-stationed workers and maintains network upgrades for non-connected gear. In present society space is a huge concern, specially in the urban regions, for practically everyone and the furnishing offices provides the most outstanding support on this certain situation.
Comparing a CAD Workstation to a personal Computer is a bit like comparing a sports automobile with a common household saloon i.e. they each have a 2. litre engine, they both have suspension, they both have 4 wheels and of course four tyres and brakes, so it is simple to assume they are the exact same. HP and NVIDIA have produced advised configurations to support the overall performance requirements of VR content creators. These net applications assistance, streamline and generally facilitate an array of organization processes relating to finance, human resources and academics. This TAO unit is born of the Web – designed in 1997, a time when not even two percent of the world’s population had Net access and no one had however thought of Facebook, YouTube or Twitter. The R3092D is the next generation of ClearCube R-Series Blade PCs and gives functions new to R-Series blades and chassis.
The lack of a quad-core processor indicates it could lag in demanding multi-threading applications, its motherboard is fundamental, it doesn’t have a discrete video card, and the solid state drive’s capacity is restricted. It includes a energy cord and runs utilizing a 200W external energy provide that is 89% efficient and operates using 100-240 VAC at 50-60 Hz. Although the installed operating technique is Windows 7 Specialist (64-bit), a Windows ten Skilled (64-bit) license and media is integrated. Made for engineers, architects, builders and construction specialists for workplace and home use, the CAD Workstations fairly effectively serve the purpose of becoming very carefully assembled machines. When you are looking for a workstation desk, there are several aspects of furniture that you need to hold in mind.
Primarily based on desktop workstations memory capacity as of June 14, 2017. Some styles are meant to be placed centered in a space, although corner laptop desks are excellent for tucking away on one particular side. Appropriate now, no particular hardware is needed for most CAD computer software. I am not a fan of OSx but the one issue I have missed every time I’ve utilized a Windows primarily based laptop is the extraordinary touchpad on the MacBook Pro. Browse our massive selection of residence and workplace desks for just the appear you need. You may possibly be able to substantially boost the efficiency of any video that is stored in memory. What’s been truly acquiring at me though is if the dual xeon is really going to give me THAT Considerably MORE” functionality than the single setup.
GX Power of Chaos MOD ), Although I was playing I notices that the CPU ( Gaden ) playing with only 1 card deck plan, He just use it each and every time even if the CPU LEVEL stars going UP. CAD systems also provide “zoom” characteristics analogous to a camera lens, whereby a designer can magnify certain components of a model to facilitate inspection. eight, 2011 – To address the needs of an evolving workforce that demands anytime, anyplace access to organization applications and information, Dell right now announced 24 new enterprise computing solutions and form factors, like laptops, tablets, desktops and workstation computer systems in one of the largest-ever introductions in the company’s history and component of 39 new solutions launching in the subsequent year. There are not numerous desks created particularly for gaming (such as the Atlantic Gaming Desk above).
With a range of efficiency, capabilities and value points, there is a proper Quadro to go with the desktop workstation of your selection. The content material index server cannot update or access its database, due to the fact the version retailer has insufficient sources. Although the scientist need to have believed it absolutely was a inventive notion at the time, the human wrist was not created for a laptop mouse. Do not underestimate these laptop workstations, as they will make your operate dazzle like never before providing you the custom options, even though offering the greatest-in-class functionality. Our primary objective is to provide wonderful value, high-quality server and storage solutions, we recognize that every single firm has diverse needs and as such are able to provide un-equaled flexibility in designing custom server and storage options to meet our clients’ needs.
from KelsusIT.com – Refurbished laptops, desktop computers , servers http://bit.ly/2CaSUEt via IFTTT
0 notes
Text
Top 10 Data Mining Algorithms, Explained
New Post has been published on http://dasuma.es/es/top-10-data-mining-algorithms-explained/
Top 10 Data Mining Algorithms, Explained
Today, I’m going to explain in plain English the top 10 most influential data mining algorithms as voted on by 3 separate panels in this survey paper.
Once you know what they are, how they work, what they do and where you can find them, my hope is you’ll have this blog post as a springboard to learn even more about data mining.
What are we waiting for? Let’s get started!
Here are the algorithms:
1. C4.5
2. k-means
3. Support vector machines
4. Apriori
5. EM
6. PageRank
7. AdaBoost
8. kNN
9. Naive Bayes
10. CART
We also provide interesting resources at the end.
1. C4.5
What does it do? C4.5 constructs a classifier in the form of a decision tree. In order to do this, C4.5 is given a set of data representing things that are already classified.
Wait, what’s a classifier? A classifier is a tool in data mining that takes a bunch of data representing things we want to classify and attempts to predict which class the new data belongs to.
What’s an example of this? Sure, suppose a dataset contains a bunch of patients. We know various things about each patient like age, pulse, blood pressure, VO2max, family history, etc. These are called attributes.
Now:
Given these attributes, we want to predict whether the patient will get cancer. The patient can fall into 1 of 2 classes: will get cancer or won’t get cancer. C4.5 is told the class for each patient.
And here’s the deal:
Using a set of patient attributes and the patient’s corresponding class, C4.5 constructs a decision tree that can predict the class for new patients based on their attributes.
Cool, so what’s a decision tree? Decision tree learning creates something similar to a flowchart to classify new data. Using the same patient example, one particular path in the flowchart could be:
Patient has a history of cancer
Patient is expressing a gene highly correlated with cancer patients
Patient has tumors
Patient’s tumor size is greater than 5cm
The bottom line is:
At each point in the flowchart is a question about the value of some attribute, and depending on those values, he or she gets classified. You can find lots of examples of decision trees.
Is this supervised or unsupervised? This is supervised learning, since the training dataset is labeled with classes. Using the patient example, C4.5 doesn’t learn on its own that a patient will get cancer or won’t get cancer. We told it first, it generated a decision tree, and now it uses the decision tree to classify.
You might be wondering how C4.5 is different than other decision tree systems?
First, C4.5 uses information gain when generating the decision tree.
Second, although other systems also incorporate pruning, C4.5 uses a single-pass pruning process to mitigate over-fitting. Pruning results in many improvements.
Third, C4.5 can work with both continuous and discrete data. My understanding is it does this by specifying ranges or thresholds for continuous data thus turning continuous data into discrete data.
Finally, incomplete data is dealt with in its own ways.
Why use C4.5? Arguably, the best selling point of decision trees is their ease of interpretation and explanation. They are also quite fast, quite popular and the output is human readable.
Where is it used? A popular open-source Java implementation can be found over at OpenTox. Orange, an open-source data visualization and analysis tool for data mining, implements C4.5 in their decision tree classifier.
Classifiers are great, but make sure to checkout the next algorithm about clustering…
2. k-means
What does it do? k-means creates k groups from a set of objects so that the members of a group are more similar. It’s a popular cluster analysis technique for exploring a dataset.
Hang on, what’s cluster analysis? Cluster analysis is a family of algorithms designed to form groups such that the group members are more similar versus non-group members. Clusters and groups are synonymous in the world of cluster analysis.
Is there an example of this? Definitely, suppose we have a dataset of patients. In cluster analysis, these would be called observations. We know various things about each patient like age, pulse, blood pressure, VO2max, cholesterol, etc. This is a vector representing the patient.
Look:
You can basically think of a vector as a list of numbers we know about the patient. This list can also be interpreted as coordinates in multi-dimensional space. Pulse can be one dimension, blood pressure another dimension and so forth.
You might be wondering:
Given this set of vectors, how do we cluster together patients that have similar age, pulse, blood pressure, etc?
Want to know the best part?
You tell k-means how many clusters you want. K-means takes care of the rest.
How does k-means take care of the rest? k-means has lots of variations to optimize for certain types of data.
At a high level, they all do something like this:
k-means picks points in multi-dimensional space to represent each of the k clusters. These are called centroids.
Every patient will be closest to 1 of these k centroids. They hopefully won’t all be closest to the same one, so they’ll form a cluster around their nearest centroid.
What we have are k clusters, and each patient is now a member of a cluster.
k-means then finds the center for each of the k clusters based on its cluster members (yep, using the patient vectors!).
This center becomes the new centroid for the cluster.
Since the centroid is in a different place now, patients might now be closer to other centroids. In other words, they may change cluster membership.
Steps 2-6 are repeated until the centroids no longer change, and the cluster memberships stabilize. This is called convergence.
Is this supervised or unsupervised? It depends, but most would classify k-means as unsupervised. Other than specifying the number of clusters, k-means “learns” the clusters on its own without any information about which cluster an observation belongs to. k-means can be semi-supervised.
Why use k-means? I don’t think many will have an issue with this:
The key selling point of k-means is its simplicity. Its simplicity means it’s generally faster and more efficient than other algorithms, especially over large datasets.
It gets better:
k-means can be used to pre-cluster a massive dataset followed by a more expensive cluster analysis on the sub-clusters. k-means can also be used to rapidly “play” with k and explore whether there are overlooked patterns or relationships in the dataset.
It’s not all smooth sailing:
Two key weaknesses of k-means are its sensitivity to outliers, and its sensitivity to the initial choice of centroids. One final thing to keep in mind is k-means is designed to operate on continuous data — you’ll need to do some tricks to get it to work on discrete data.
Where is it used? A ton of implementations for k-means clustering are available online:
Apache Mahout
Julia
R
SciPy
Weka
MATLAB
SAS
If decision trees and clustering didn’t impress you, you’re going to love the next algorithm.
3. Support vector machines
What does it do? Support vector machine (SVM) learns a hyperplane to classify data into 2 classes. At a high-level, SVM performs a similar task like C4.5 except SVM doesn’t use decision trees at all.
Whoa, a hyper-what? A hyperplane is a function like the equation for a line, y = mx + b. In fact, for a simple classification task with just 2 features, the hyperplane can be a line.
As it turns out…
SVM can perform a trick to project your data into higher dimensions. Once projected into higher dimensions…
…SVM figures out the best hyperplane which separates your data into the 2 classes.
Do you have an example? Absolutely, the simplest example I found starts with a bunch of red and blue balls on a table. If the balls aren’t too mixed together, you could take a stick and without moving the balls, separate them with the stick.
You see:
When a new ball is added on the table, by knowing which side of the stick the ball is on, you can predict its color.
What do the balls, table and stick represent? The balls represent data points, and the red and blue color represent 2 classes. The stick represents the simplest hyperplane which is a line.
And the coolest part?
SVM figures out the function for the hyperplane.
What if things get more complicated? Right, they frequently do. If the balls are mixed together, a straight stick won’t work.
Here’s the work-around:
Quickly lift up the table throwing the balls in the air. While the balls are in the air and thrown up in just the right way, you use a large sheet of paper to divide the balls in the air.
You might be wondering if this is cheating:
Nope, lifting up the table is the equivalent of mapping your data into higher dimensions. In this case, we go from the 2 dimensional table surface to the 3 dimensional balls in the air.
How does SVM do this? By using a kernel we have a nice way to operate in higher dimensions. The large sheet of paper is still called a hyperplane, but it is now a function for a plane rather than a line. Note from Yuval that once we’re in 3 dimensions, the hyperplane must be a plane rather than a line.
I found this visualization super helpful:
youtube
Reddit also has 2 great threads on this in the ELI5 and ML subreddits.
How do balls on a table or in the air map to real-life data? A ball on a table has a location that we can specify using coordinates. For example, a ball could be 20cm from the left edge and 50cm from the bottom edge. Another way to describe the ball is as (x, y) coordinates or (20, 50). x and y are 2 dimensions of the ball.
Here’s the deal:
If we had a patient dataset, each patient could be described by various measurements like pulse, cholesterol level, blood pressure, etc. Each of these measurements is a dimension.
The bottom line is:
SVM does its thing, maps them into a higher dimension and then finds the hyperplane to separate the classes.
Margins are often associated with SVM? What are they? The margin is the distance between the hyperplane and the 2 closest data points from each respective class. In the ball and table example, the distance between the stick and the closest red and blue ball is the margin.
The key is:
SVM attempts to maximize the margin, so that the hyperplane is just as far away from red ball as the blue ball. In this way, it decreases the chance of misclassification.
Where does SVM get its name from? Using the ball and table example, the hyperplane is equidistant from a red ball and a blue ball. These balls or data points are called support vectors, because they support the hyperplane.
Is this supervised or unsupervised? This is a supervised learning, since a dataset is used to first teach the SVM about the classes. Only then is the SVM capable of classifying new data.
Why use SVM? SVM along with C4.5 are generally the 2 classifiers to try first. No classifier will be the best in all cases due to the No Free Lunch Theorem. In addition, kernel selection and interpretability are some weaknesses.
Where is it used? There are many implementations of SVM. A few of the popular ones are scikit-learn, MATLAB and of course libsvm.
The next algorithm is one of my favorites…
4. Apriori
What does it do? The Apriori algorithm learns association rules and is applied to a database containing a large number of transactions.
What are association rules? Association rule learning is a data mining technique for learning correlations and relations among variables in a database.
What’s an example of Apriori? Let’s say we have a database full of supermarket transactions. You can think of a database as a giant spreadsheet where each row is a customer transaction and every column represents a different grocery item.
Here’s the best part:
By applying the Apriori algorithm, we can learn the grocery items that are purchased together a.k.a association rules.
The power of this is:
You can find those items that tend to be purchased together more frequently than other items — the ultimate goal being to get shoppers to buy more. Together, these items are called itemsets.
For example:
You can probably quickly see that chips + dip and chips + soda seem to frequently occur together. These are called 2-itemsets. With a large enough dataset, it will be much harder to “see” the relationships especially when you’re dealing with 3-itemsets or more. That’s precisely what Apriori helps with!
You might be wondering how Apriori works? Before getting into the nitty-gritty of algorithm, you’ll need to define 3 things:
The first is the size of your itemset. Do you want to see patterns for a 2-itemset, 3-itemset, etc.?
The second is your support or the number of transactions containing the itemset divided by the total number of transactions. An itemset that meets the support is called a frequent itemset.
The third is your confidence or the conditional probability of some item given you have certain other items in your itemset. A good example is given chips in your itemset, there is a 67% confidence of having soda also in the itemset.
The basic Apriori algorithm is a 3 step approach:
Join. Scan the whole database for how frequent 1-itemsets are.
Prune. Those itemsets that satisfy the support and confidence move onto the next round for 2-itemsets.
Repeat. This is repeated for each itemset level until we reach our previously defined size.
Is this supervised or unsupervised? Apriori is generally considered an unsupervised learning approach, since it’s often used to discover or mine for interesting patterns and relationships.
But wait, there’s more…
Apriori can also be modified to do classification based on labelled data.
Why use Apriori? Apriori is well understood, easy to implement and has many derivatives.
On the other hand…
The algorithm can be quite memory, space and time intensive when generating itemsets.
Where is it used? Plenty of implementations of Apriori are available. Some popular ones are the ARtool, Weka, and Orange.
The next algorithm was the most difficult for me to understand, look at the next algorithm…
5. EM
What does it do? In data mining, expectation-maximization (EM) is generally used as a clustering algorithm (like k-means) for knowledge discovery.
In statistics, the EM algorithm iterates and optimizes the likelihood of seeing observed data while estimating the parameters of a statistical model with unobserved variables.
OK, hang on while I explain…
I’m not a statistician, so hopefully my simplification is both correct and helps with understanding.
Here are a few concepts that will make this way easier…
What’s a statistical model? I see a model as something that describes how observed data is generated. For example, the grades for an exam could fit a bell curve, so the assumption that the grades are generated via a bell curve (a.k.a. normal distribution) is the model.
Wait, what’s a distribution? A distribution represents the probabilities for all measurable outcomes. For example, the grades for an exam could fit a normal distribution. This normal distribution represents all the probabilities of a grade.
In other words, given a grade, you can use the distribution to determine how many exam takers are expected to get that grade.
Cool, what are the parameters of a model? A parameter describes a distribution which is part of a model. For example, a bell curve can be described by its mean and variance.
Using the exam scenario, the distribution of grades on an exam (the measurable outcomes) followed a bell curve (this is the distribution). The mean was 85 and the variance was 100.
So, all you need to describe a normal distribution are 2 parameters:
The mean
The variance
And likelihood? Going back to our previous bell curve example… suppose we have a bunch of grades and are told the grades follow a bell curve. However, we’re not given all the grades… only a sample.
Here’s the deal:
We don’t know the mean or variance of all the grades, but we can estimate them using the sample. The likelihood is the probability that the bell curve with estimated mean and variance results in those bunch of grades.
In other words, given a set of measurable outcomes, let’s estimate the parameters. Using these estimated parameters, the hypothetical probability of the outcomes is called likelihood.
Remember, it’s the hypothetical probability of the existing grades, not the probability of a future grade.
You’re probably wondering, what’s probability then?
Using the bell curve example, suppose we know the mean and variance. Then we’re told the grades follow a bell curve. The chance that we observe certain grades and how often they are observed is the probability.
In more general terms, given the parameters, let’s estimate what outcomes should be observed. That’s what probability does for us.
Great! Now, what’s the difference between observed and unobserved data? Observed data is the data that you saw or recorded. Unobserved data is data that is missing. There a number of reasons that the data could be missing (not recorded, ignored, etc.).
Here’s the kicker:
For data mining and clustering, what’s important to us is looking at the class of a data point as missing data. We don’t know the class, so interpreting missing data this way is crucial for applying EM to the task of clustering.
Once again: The EM algorithm iterates and optimizes the likelihood of seeing observed data while estimating the parameters of a statistical model with unobserved variables. Hopefully, this is way more understandable now.
The best part is…
By optimizing the likelihood, EM generates an awesome model that assigns class labels to data points — sounds like clustering to me!
How does EM help with clustering? EM begins by making a guess at the model parameters.
Then it follows an iterative 3-step process:
E-step: Based on the model parameters, it calculates the probabilities for assignments of each data point to a cluster.
M-step: Update the model parameters based on the cluster assignments from the E-step.
Repeat until the model parameters and cluster assignments stabilize (a.k.a. convergence).
Is this supervised or unsupervised? Since we do not provide labeled class information, this is unsupervised learning.
Why use EM? A key selling point of EM is it’s simple and straight-forward to implement. In addition, not only can it optimize for model parameters, it can also iteratively make guesses about missing data.
This makes it great for clustering and generating a model with parameters. Knowing the clusters and model parameters, it’s possible to reason about what the clusters have in common and which cluster new data belongs to.
EM is not without weaknesses though…
First, EM is fast in the early iterations, but slow in the later iterations.
Second, EM doesn’t always find the optimal parameters and gets stuck in local optima rather than global optima.
Where is it used? The EM algorithm is available in Weka. R has an implementation in the mclust package. scikit-learn also has an implementation in its gmm module.
What data mining does Google do? Take a look…
6. PageRank
What does it do? PageRank is a link analysis algorithm designed to determine the relative importance of some object linked within a network of objects.
Yikes.. what’s link analysis? It’s a type of network analysis looking to explore the associations (a.k.a. links) among objects.
Here’s an example: The most prevalent example of PageRank is Google’s search engine. Although their search engine doesn’t solely rely on PageRank, it’s one of the measures Google uses to determine a web page’s importance.
Let me explain:
Web pages on the World Wide Web link to each other. If rayli.net links to a web page on CNN, a vote is added for the CNN page indicating rayli.net finds the CNN web page relevant.
And it doesn’t stop there…
rayli.net’s votes are in turn weighted by rayli.net’s importance and relevance. In other words, any web page that’s voted for rayli.net increases rayli.net’s relevance.
The bottom line?
This concept of voting and relevance is PageRank. rayli.net’s vote for CNN increases CNN’s PageRank, and the strength of rayli.net’s PageRank influences how much its vote affects CNN’s PageRank.
What does a PageRank of 0, 1, 2, 3, etc. mean? Although the precise meaning of a PageRank number isn’t disclosed by Google, we can get a sense of its relative meaning.
And here’s how:
You see?
It’s a bit like a popularity contest. We all have a sense of which websites are relevant and popular in our minds. PageRank is just an uber elegant way to define it.
What other applications are there of PageRank? PageRank was specifically designed for the World Wide Web.
Think about it:
At its core, PageRank is really just a super effective way to do link analysis.The objects being linked don’t have to be web pages.
Here are 3 innovative applications of PageRank:
Dr Stefano Allesina, from the University of Chicago, applied PageRank to ecology to determine which species are critical for sustaining ecosystems.
Twitter developed WTF (Who-to-Follow) which is a personalized PageRank recommendation engine about who to follow.
Bin Jiang, from The Hong Kong Polytechnic University, used a variant of PageRank to predict human movement rates based on topographical metrics in London.
Is this supervised or unsupervised? PageRank is generally considered an unsupervised learning approach, since it’s often used to discover the importance or relevance of a web page.
Why use PageRank? Arguably, the main selling point of PageRank is its robustness due to the difficulty of getting a relevant incoming link.
Simply stated:
If you have a graph or network and want to understand relative importance, priority, ranking or relevance, give PageRank a try.
Where is it used? The PageRank trademark is owned by Google. However, the PageRank algorithm is actually patented by Stanford University.
You might be wondering if you can use PageRank:
I’m not a lawyer, so best to check with an actual lawyer, but you can probably use the algorithm as long as it doesn’t commercially compete against Google/Stanford.
Here are 3 implementations of PageRank:
C++ OpenSource PageRank Implementation
Python PageRank Implementation
igraph – The network analysis package (R)
With our powers combined, we are…
7. AdaBoost
What does it do? AdaBoost is a boosting algorithm which constructs a classifier.
As you probably remember, a classifier takes a bunch of data and attempts to predict or classify which class a new data element belongs to.
But what’s boosting? Boosting is an ensemble learning algorithm which takes multiple learning algorithms (e.g. decision trees) and combines them. The goal is to take an ensemble or group of weak learners and combine them to create a single strong learner.
What’s the difference between a strong and weak learner? A weak learner classifies with accuracy barely above chance. A popular example of a weak learner is the decision stump which is a one-level decision tree.
Alternatively…
A strong learner has much higher accuracy, and an often used example of a strong learner is SVM.
What’s an example of AdaBoost? Let’s start with 3 weak learners. We’re going to train them in 10 rounds on a training dataset containing patient data. The dataset contains details about the patient’s medical records.
The question is…
How can we predict whether the patient will get cancer?
Here’s how AdaBoost answers the question…
In round 1: AdaBoost takes a sample of the training dataset and tests to see how accurate each learner is. The end result is we find the best learner.
In addition, samples that are misclassified are given a heavier weight, so that they have a higher chance of being picked in the next round.
One more thing, the best learner is also given a weight depending on its accuracy and incorporated into the ensemble of learners (right now there’s just 1 learner).
In round 2: AdaBoost again attempts to look for the best learner.
And here’s the kicker:
The sample of patient training data is now influenced by the more heavily misclassified weights. In other words, previously misclassified patients have a higher chance of showing up in the sample.
Why?
It’s like getting to the second level of a video game and not having to start all over again when your character is killed. Instead, you start at level 2 and focus all your efforts on getting to level 3.
Likewise, the first learner likely classified some patients correctly. Instead of trying to classify them again, let’s focus all the efforts on getting the misclassified patients.
The best learner is again weighted and incorporated into the ensemble, misclassified patients are weighted so they have a higher chance of being picked and we rinse and repeat.
At the end of the 10 rounds: We’re left with an ensemble of weighted learners trained and then repeatedly retrained on misclassified data from the previous rounds.
Is this supervised or unsupervised? This is supervised learning, since each iteration trains the weaker learners with the labelled dataset.
Why use AdaBoost? AdaBoost is simple. The algorithm is relatively straight-forward to program.
In addition, it’s fast! Weak learners are generally simpler than strong learners. Being simpler means they’ll likely execute faster.
Another thing…
It’s a super elegant way to auto-tune a classifier, since each successive AdaBoost round refines the weights for each of the best learners. All you need to specify is the number of rounds.
Finally, it’s flexible and versatile. AdaBoost can incorporate any learning algorithm, and it can work with a large variety of data.
Where is it used? AdaBoost has a ton of implementations and variants. Here are a few:
scikit-learn
ICSIBoost
gbm: Generalized Boosted Regression Models
If you like Mr. Rogers, you’ll like the next algorithm…
8. kNN
What does it do? kNN, or k-Nearest Neighbors, is a classification algorithm. However, it differs from the classifiers previously described because it’s a lazy learner.
What’s a lazy learner? A lazy learner doesn’t do much during the training process other than store the training data. Only when new unlabeled data is input does this type of learner look to classify.
On the other hand, an eager learner builds a classification model during training. When new unlabeled data is input, this type of learner feeds the data into the classification model.
How does C4.5, SVM and AdaBoost fit into this? Unlike kNN, they are all eager learners.
Here’s why:
C4.5 builds a decision tree classification model during training.
SVM builds a hyperplane classification model during training.
AdaBoost builds an ensemble classification model during training.
So what does kNN do? kNN builds no such classification model. Instead, it just stores the labeled training data.
When new unlabeled data comes in, kNN operates in 2 basic steps:
First, it looks at the closest labeled training data points — in other words, the k-nearest neighbors.
Second, using the neighbors’ classes, kNN gets a better idea of how the new data should be classified.
You might be wondering…
How does kNN figure out what’s closer? For continuous data, kNN uses a distance metric like Euclidean distance. The choice of distance metric largely depends on the data. Some even suggest learning a distance metric based on the training data. There’s tons more details and papers on kNN distance metrics.
For discrete data, the idea is transform discrete data into continuous data. 2 examples of this are:
Using Hamming distance as a metric for the “closeness” of 2 text strings.
Transforming discrete data into binary features.
These 2 Stack Overflow threads have some more suggestions on dealing with discrete data:
KNN classification with categorical data
Using k-NN in R with categorical values
How does kNN classify new data when neighbors disagree? kNN has an easy time when all neighbors are the same class. The intuition is if all the neighbors agree, then the new data point likely falls in the same class.
I’ll bet you can guess where things get hairy…
How does kNN decide the class when neighbors don’t have the same class?
2 common techniques for dealing with this are:
Take a simple majority vote from the neighbors. Whichever class has the greatest number of votes becomes the class for the new data point.
Take a similar vote except give a heavier weight to those neighbors that are closer. A simple way to do this is to use reciprocal distance e.g. if the neighbor is 5 units away, then weight its vote 1/5. As the neighbor gets further away, the reciprocal distance gets smaller and smaller… exactly what we want!
Is this supervised or unsupervised? This is supervised learning, since kNN is provided a labeled training dataset.
Why use kNN? Ease of understanding and implementing are 2 of the key reasons to use kNN. Depending on the distance metric, kNN can be quite accurate.
But that’s just part of the story…
Here are 5 things to watch out for:
kNN can get very computationally expensive when trying to determine the nearest neighbors on a large dataset.
Noisy data can throw off kNN classifications.
Features with a larger range of values can dominate the distance metric relative to features that have a smaller range, so feature scaling is important.
Since data processing is deferred, kNN generally requires greater storage requirements than eager classifiers.
Selecting a good distance metric is crucial to kNN’s accuracy.
Where is it used? A number of kNN implementations exist:
MATLAB k-nearest neighbor classification
scikit-learn KNeighborsClassifier
k-Nearest Neighbour Classification in R
Spam? Fuhgeddaboudit! Read ahead to learn about the next algorithm…
9. Naive Bayes
What does it do? Naive Bayes is not a single algorithm, but a family of classification algorithms that share one common assumption:
Every feature of the data being classified is independent of all other features given the class.
What does independent mean? 2 features are independent when the value of one feature has no effect on the value of another feature.
For example:
Let’s say you have a patient dataset containing features like pulse, cholesterol level, weight, height and zip code. All features would be independent if the value of all features have no effect on each other. For this dataset, it’s reasonable to assume that the patient’s height and zip code are independent, since a patient’s height has little to do with their zip code.
But let’s not stop there, are the other features independent?
Sadly, the answer is no. Here are 3 feature relationships which are not independent:
If height increases, weight likely increases.
If cholesterol level increases, weight likely increases.
If cholesterol level increases, pulse likely increases as well.
In my experience, the features of a dataset are generally not all independent.
And that ties in with the next question…
Why is it called naive? The assumption that all features of a dataset are independent is precisely why it’s called naive — it’s generally not the case that all features are independent.
What’s Bayes? Thomas Bayes was an English statistician for which Bayes’ Theorem is named after. You can click on the link to find about more about Bayes’ Theorem.
In a nutshell, the theorem allows us to predict the class given a set of features using probability.
The simplified equation for classification looks something like this:
Let’s dig deeper into this…
What does the equation mean? The equation finds the probability of Class A given Features 1 and 2. In other words, if you see Features 1 and 2, this is the probability the data is Class A.
The equation reads: The probability of Class A given Features 1 and 2 is a fraction.
The fraction’s numerator is the probability of Feature 1 given Class A multiplied by the probability of Feature 2 given Class A multiplied by the probability of Class A.
The fraction’s denominator is the probability of Feature 1 multiplied by the probability of Feature 2.
What is an example of Naive Bayes? Below is a great example taken from a Stack Overflow thread.
Here’s the deal:
We have a training dataset of 1,000 fruits.
The fruit can be a Banana, Orange or Other (these are the classes).
The fruit can be Long, Sweet or Yellow (these are the features).
What do you see in this training dataset?
Out of 500 bananas, 400 are long, 350 are sweet and 450 are yellow.
Out of 300 oranges, none are long, 150 are sweet and 300 are yellow.
Out of the remaining 200 fruit, 100 are long, 150 are sweet and 50 are yellow.
If we are given the length, sweetness and color of a fruit (without knowing its class), we can now calculate the probability of it being a banana, orange or other fruit.
Suppose we are told the unknown fruit is long, sweet and yellow.
Here’s how we calculate all the probabilities in 4 steps:
Step 1: To calculate the probability the fruit is a banana, let’s first recognize that this looks familiar. It’s the probability of the class Banana given the features Long, Sweet and Yellow or more succinctly:
This is exactly like the equation discussed earlier.
Step 2: Starting with the numerator, let’s plug everything in.
Multiplying everything together (as in the equation), we get:
Step 3: Ignore the denominator, since it’ll be the same for all the other calculations.
Step 4: Do a similar calculation for the other classes:
Since the is greater than , Naive Bayes would classify this long, sweet and yellow fruit as a banana.
Is this supervised or unsupervised? This is supervised learning, since Naive Bayes is provided a labeled training dataset in order to construct the tables.
Why use Naive Bayes? As you could see in the example above, Naive Bayes involves simple arithmetic. It’s just tallying up counts, multiplying and dividing.
Once the frequency tables are calculated, classifying an unknown fruit just involves calculating the probabilities for all the classes, and then choosing the highest probability.
Despite its simplicity, Naive Bayes can be surprisingly accurate. For example, it’s been found to be effective for spam filtering.
Where is it used? Implementations of Naive Bayes can be found in Orange, scikit-learn, Weka and R.
Finally, check out the 10th algorithm…
10. CART
What does it do? CART stands for classification and regression trees. It is a decision tree learning technique that outputs either classification or regression trees. Like C4.5, CART is a classifier.
Is a classification tree like a decision tree? A classification tree is a type of decision tree. The output of a classification tree is a class.
For example, given a patient dataset, you might attempt to predict whether the patient will get cancer. The class would either be “will get cancer” or “won’t get cancer.”
What’s a regression tree? Unlike a classification tree which predicts a class, regression trees predict a numeric or continuous value e.g. a patient’s length of stay or the price of a smartphone.
Here’s an easy way to remember…
Classification trees output classes, regression trees output numbers.
Since we’ve already covered how decision trees are used to classify data, let’s jump right into things…
How does this compare with C4.5?
C4.5 CART Uses information gain to segment data during decision tree generation. Uses Gini impurity (not to be confused with Gini coefficient). A good discussion of the differences between the impurity and coefficient is available on Stack Overflow. Uses a single-pass pruning process to mitigate over-fitting. Uses the cost-complexity method of pruning. Starting at the bottom of the tree, CART evaluates the misclassification cost with the node vs. without the node. If the cost doesn’t meet a threshold, it is pruned away. The decision nodes can have 2 or more branches. The decision nodes have exactly 2 branches. Probabilistically distributes missing values to children. Uses surrogates to distribute the missing values to children.
Is this supervised or unsupervised? CART is a supervised learning technique, since it is provided a labeled training dataset in order to construct the classification or regression tree model.
Why use CART? Many of the reasons you’d use C4.5 also apply to CART, since they are both decision tree learning techniques. Things like ease of interpretation and explanation also apply to CART as well.
Like C4.5, they are also quite fast, quite popular and the output is human readable.
Where is it used? scikit-learn implements CART in their decision tree classifier. R’s tree package has an implementation of CART. Weka and MATLAB also have implementations.
Interesting Resources
Apriori algorithm for Data Mining – made simple
What Is Google PageRank and How Is It Earned and Transferred?
2 main differences between classification and regression trees
AdaBoost Tutorial
Ton of References
Now it’s your turn…
Now that I’ve shared my thoughts and research around these data mining algorithms, I want to turn it over to you.
Are you going to give data mining a try?
Which data mining algorithms have you heard of but weren’t on the list?
Or maybe you have a question about an algorithm?
Let me know what you think by leaving a comment.
Original.
Bio: Raymond Li is a software engineer and data enthusiast who has been blogging at rayli.net for over a decade. He loves to learn, teach and grow. You’ll usually find him wrangling data, programming and lifehacking. Like what you’ve read? If so, subscribe via email to get started now!
By Raymond Li.
Original post here
#Algorithms#Apriori#Bayesian#Boosting#C4.5#CART#data mining#Explained#K-means#Nearest Neighbor#Page Rank#Support Vector Machines#Top 10
0 notes
Text
Why are analog signals still being used in communication?
We provide latest MatLab Homework Help, MatLab Assignment Help for students, engineers and researchers in Multiple Branches like ECE, EEE, CSE, Mechanical, Civil with 100% output. Matlab Code for B.E, B.Tech,M.E,M.Tech, Ph.D. Scholars with 100% privacy guaranteed. Get MATLAB projects with source code for your learning and research.
This is a very often misunderstood concept. Here is the most important thing to understand: The communication SIGNAL is ANALOG, but the MODULATION is DIGITAL.
Why is the signal analog?
A) Our world is analog. Signals are electromagnetic waves which are inherently analog. This can’t be changed.
2. What is modulation and why do we need it?
A) Modulation is embedding a message signal onto a CARRIER signal.
B) In the early days, the ‘message’ was voice. If everyone is trying to transmit their signal, we couldn’t hear it due to interference with every other message…. like being in a crowded room with everyone talking at once and trying to listen to a conversation across the room.
C) The ‘message’ is placed onto a CARRIER signal. The carrier is a signal (sinusoid) at a given frequency (channel) and the information is MODULATED onto the carrier. This keeps everyone’s signal from interfering if each conversation is on a separate channel.
3. What is analog vs. digital modulation?
A) Analog modulation was used first because it was easy. We had an analog signal and on the other end we wanted an analog signal. The most simplistic approach was to use AMPLITUDE MODULATION (AM). The voice message was used to change the amplitude of the carrier signal.
B) Digital modulation uses BINARY format to change the PHASE or FREQUENCY of the carrier in discrete steps (1 or 0 as in the binary number representation). That is, the frequency of the carrier will be changed by +/- some small frequency offset based on the binary message. In reality the phase is modulated but frequency may be easier to visualize and is very close.
4. Why is everything going to digital modulation over analog modulation?
A) Digital modulation is more robust. If the signal is AM modulated, then any interference or noise is added directly to the signal… so it sounds like it has ‘static’ in it.
B) Then systems went to FM instead of AM. FM = Frequency Modulation. This is still an analog modulation, but interference is far less likely to create frequency errors than amplitude errors. The FM signal can still sound like there is ‘static’ but not nearly as likely. That’s why FM sounds better than AM.
C) Digital modulation only has to be accurate enough to decode the message into a 1 or 0. High or low. So, the digital modulation is extremely robust to noise and interference… but when it breaks, it is a brick wall. It sounds great until it breaks. This can be seen if you have watched an HDTV broadcast over the air. It looks awesome until the signal degrades (storm, bad antenna, etc.) and then you see large ‘pixelation’ and it flashes in and out completely as you begin to see the pixelation.
#signal processing#simulation#programming#Image processing#My projects#promo code#assignment help#matlab assignment help#coding#coder#matlabsolutions
0 notes
Text
MATLAB In Discrete Time Signal Operations Assignment Help
Simulink models can process both discrete-time and continuous-time signals. A Discrete-Time Signal is a sequence of values that correspond to particular instants in time. We at MatlabHomeworkExperts.com have talented pool of Discrete Time Signal Operations homework experts, Discrete Time Signal Operations assignment tutors, Discrete Time Signal Operations professionals, Discrete Time Signal Operations Solvers and Discrete Time Signal Operations Helpers can cater to your entire needs in the area of Discrete Time Signal Operations. We provide Matlab Discrete Time Signal Operations solutions which are of high quality and it can be provided to the students of colleges, universities, or PhD.
0 notes
Text
What’s the reason that every signal have a noise?
We provide latest MatLab Homework Help, MatLab Assignment Help for students, engineers and researchers in Multiple Branches like ECE, EEE, CSE, Mechanical, Civil with 100% output. Matlab Code for B.E, B.Tech,M.E,M.Tech, Ph.D. Scholars with 100% privacy guaranteed. Get MATLAB projects with source code for your learning and research.
Noise itself is a “signal” but instead of being deterministic and predictable (like x(t)=sin(ωt)x(t)=sin(ωt)) it only can be defined and characterized through statistical parameters, such as average, variance, covariance and correlation. In signal processing, the noise is usually called a stochastic process. The most “famous” noise is white noise, which is characterized by a constant power spectrum (in the frequency domain) or, equivalently, by an autocovariance and autocorrelation equal to an impulse — δ(t)δ(t) in continuous noise, δ[n]δ[n] in discrete-time noise.
As others already said, in practice everything above absolute zero has intrinsic thermal noise; semiconductors have other types of noise (shot noise, popcorn noise, 1/f noise, …) and there is also the noise associated to electromagnetic interference from antennas, electrical appliances, etc…
So, noise is really pervasive; in practice, almost all engineering endeavors include some ways of dealing with (and be resilient and robust again) noise, or else the devices wouldn’t work properly.
#education#Electrical Engineering#assignment help#matlab assignment help#programming#Image processing#My projects#signal processing#promo code
0 notes