#Matlab Discrete Help
Explore tagged Tumblr posts
Visit Tumblr Blog
Explore Tumblr blogs with no restrictions, modern design and the best experience.
Last Seen Tumblr Blogs


Fun Fact
Tumblr Inc. has $15.1M in annual revenue.
Text
Model-Based Design with Simulink: Revolutionizing Engineering Development
In today’s fast-paced and increasingly complex engineering landscape, traditional development methods are being replaced by more efficient and integrated solutions. One such groundbreaking approach is Model-Based Design (MBD), particularly through Simulink, a powerful simulation and model-based environment from MathWorks. MBD with Simulink streamlines the design, testing, and implementation of dynamic systems, providing engineers with a comprehensive framework that enhances innovation, collaboration, and product quality.
What is Model-Based Design?
Model-Based Design is a systematic approach to engineering that uses models as an integral part of the development process. Instead of writing code or building prototypes early on, engineers create system-level models to simulate, analyze, and validate behavior. These models serve as executable specifications and help bridge the gap between theoretical design and practical implementation.
The core advantages of MBD include:
Accelerated development cycles
Improved accuracy and reliability
Seamless verification and validation
Enhanced communication between multidisciplinary teams
Why Simulink?
Simulink, a product of MathWorks, is a visual programming environment that enables engineers to model, simulate, and analyze multidomain dynamic systems. It’s integrated tightly with MATLAB and provides libraries of predefined blocks for continuous and discrete systems, signal processing, controls, communication, and more.
With Simulink, users can design complex systems using block diagrams instead of traditional code. This makes it easier to visualize system behavior and quickly iterate designs through simulation.
Key Features of Simulink in Model-Based Design
1. Graphical Modeling
Simulink allows you to build models using intuitive block diagrams, enabling engineers to visually assemble system components and logic. This approach improves collaboration, especially in multidisciplinary teams, by offering a clear view of system behavior.
2. Simulation and Analysis
One of Simulink’s most powerful features is its ability to simulate system dynamics. Engineers can test various conditions, input signals, and fault scenarios without building physical prototypes, reducing development time and costs.
3. Automatic Code Generation
With Simulink Coder, Embedded Coder, and HDL Coder, engineers can automatically generate production-quality C, C++, and HDL code directly from their models. This ensures that the final implementation is aligned with the tested model, reducing integration errors.
4. Verification and Validation
Simulink includes tools for formal verification, testing, and validation such as Simulink Test, Simulink Coverage, and Simulink Design Verifier. These tools help ensure the system meets specifications and regulatory requirements throughout development.
5. Integration with Hardware
Simulink models can be deployed to hardware for real-time simulation and testing. It supports hardware-in-the-loop (HIL) and processor-in-the-loop (PIL) testing, allowing for seamless transition from design to deployment.
Applications of Model-Based Design with Simulink
Model-Based Design using Simulink is widely applied across industries:
Automotive
In the automotive sector, MBD is used for developing control systems such as powertrain, braking, steering, and advanced driver-assistance systems (ADAS). Simulink allows engineers to simulate vehicle dynamics, test control algorithms, and generate production-ready embedded code.
Aerospace and Defense
Simulink supports the design of flight control systems, navigation, and communication systems. It ensures safety and reliability through rigorous simulation, code verification, and compliance with industry standards like DO-178C.
Industrial Automation
Engineers in industrial automation use Simulink to develop and validate control strategies for manufacturing processes, robotics, and instrumentation. It integrates with PLCs and other industrial hardware to streamline deployment.
Medical Devices
In medical technology, Simulink enables the design and testing of life-critical systems such as infusion pumps, ventilators, and diagnostic devices. The visual modeling approach supports compliance with regulatory standards like ISO 13485 and IEC 62304.
Benefits of Using Simulink for Model-Based Design
1. Reduced Development Time
Simulink enables rapid prototyping and iterative testing through simulation, allowing teams to identify and resolve issues early in the development cycle.
2. Improved Design Quality
Modeling and simulating complex systems ensure that designs are thoroughly analyzed and optimized before deployment, leading to higher performance and reliability.
3. Cost Efficiency
By minimizing physical prototyping and reducing time-to-market, MBD with Simulink helps companies save on development costs and resource allocation.
4. Cross-Functional Collaboration
The visual nature of Simulink models makes it easier for engineers from different domains (mechanical, electrical, software) to collaborate and contribute to a unified system design.
5. Traceability and Documentation
Simulink supports documentation and traceability throughout the development process, which is essential for safety-critical industries and compliance with standards.
Challenges and Considerations
While Simulink and MBD offer numerous advantages, successful implementation requires:
Proper training and expertise in Simulink and MBD principles
Well-defined modeling guidelines and version control
Integration with existing workflows and tools
Clear communication across engineering teams
Organizations must also ensure that they have the necessary infrastructure and toolchain to fully benefit from model-based practices.
Conclusion
Model-Based Design servotechinc with Simulink is transforming the way engineering teams develop complex systems. By emphasizing modeling, simulation, and automated code generation, Simulink enables faster development, higher quality, and a smoother path from concept to deployment.
Whether you're working in automotive, aerospace, medical devices, or industrial automation, leveraging Simulink for MBD offers a robust, scalable, and future-ready approach to engineering innovation. As industries continue to demand smarter and safer systems, Model-Based Design with Simulink stands out as a vital tool in the modern engineer’s toolkit.
0 notes
Text
📚 Attention Students! Need Academic Support? We've Got You Covered! 🎓 Struggling with: ✏ Assignments 📝 Research & Papers 📖 Review & Synopses 📊 Case Studies 💻 Programming Need help with assignments, research papers, capstones, exams or tests? Our qualified tutors can assist you in a wide range of disciplines! Get personalized support in: ➡ Math: Discrete Math, Algebra, Calculus, Linear Algebra ➡ Sciences: Physics, Chemistry, Biology, Pharmacy ➡ Computer Science: Databases, Python, Matlab ➡ Business: Marketing, Accounting, Management ➡ Social Sciences: Psychology, Sociology And SO much more! Nursing, Statistics, Economics, Health Sciences, History, Philosophy, Cookery - you name it! 📐 Quizzes Get the help you need to succeed this semester! BONUS: Enjoy 30% OFF full semester bookings! Message us 24/7 via Text, Call or WhatsApp at +8801772432396 and take your grades to the next level with us!
Kindly Contact us vai, Whatsapp/Telegram:+8801772432396 Email 1:[email protected] Email 2:[email protected]
instagram
#assignments#projects#exams#quizz#lab#academiccourseworkservices#thesis#dissertation#reports#finalyearprojects#coursework#proposalWriting#Instagram
0 notes
Text
Alpha 17 Gaming Laptop Display Technology

The Best AMD Gaming Laptop
Hello everyone, today we’ll discuss why our new Alpha 17 is the greatest AMD gaming laptop. It has good keyboard, cooling, performance, connection, and upgradability. After discussing those benefits on Alpha 17, we’ll provide some user recommendations to improve your experience.
Let’s start with the Alpha 17’s best gaming laptop features. Alpha 17’s performance is its biggest benefit. It has the most powerful AMD mobile CPU, the 16-core, 32-thread Ryzen 9 7945HX, which delivers excellent single-core performance for gaming and multi-core performance for multi-threaded applications.
It has full-powered NVIDIA RTX 4070 or 4060 graphics. Along with DLSS 3 and frame generation technology, games may enhance FPS for buttery-smooth gameplay with super graphics.
Alpha 17’s newest Cooler Boost 5 innovation, with two fans and 6 heat pipes, promises reduced temperatures during competitive gaming. The CPU and GPU share two pipes, making the thermal more dynamic for CPU or GPU-intensive applications like rendering or testing.
The Alpha 17 leads performance benchmarks because to its robust cooling. Compared to the 6900HX processor, it can give 24% greater single-core and 2.25x higher multi-core CPU performance. Alpha 17 guarantees FPS above 60 or 144 with QHD resolution and extreme graphics settings in most AAA games with the newest RTX 40 series graphics.
It’s the most versatile AMD gaming laptop, with considerable performance gains in 3D rendering and video editing.
Alpha 17’s keyboard is another highlight. Per-key RGB lighting and adequate travel gave it a nice keypress sensation and interesting light effects. STEM or office workers will like the numpad, which is helpful when using MATLAB or Excel.
Alpha 17 has all the connections consumers need. The left side has a USB Type-A, USB Type-C with DP output and PD charging, and audio combo jack. The right side has two more USB Type-A connectors. We also relocated power-in, HDMI, RJ-45 Lan, and miniDP ports with stout cables to the rear.
Alpha 17 is the first gaming laptop with WIFI 7. Alpha 17 has 5.8 Gbps bandwidth, 2 ms latency, and 6Hz spectrum for more isolated network traffic, resulting in the lowest network ping.
Long-lasting laptops need decent upgradability, which Alpha 17 does. With twin memory slots and M.2 slots, it supports 64GB of DDR5 memory and 4TB of PCIe gen4 SSD. These will be turned into a powerful, long-lasting laptop for immersive gaming and multitasking.
Now that you know why Alpha 17 is the finest AMD gaming laptop, let us give some advice to help you explore this gorgeous and powerful laptop.
Alpha 17 supports the MUX switch, separate graphics mode. It’s been shown that discrete graphics mode improves gaming performance and compatibility. To switch between graphics modes, start the MSI Centre, locate Features, and click GPU Switch. For greater battery life when doing lightweight chores, switch to MS Hybrid or integrated graphics mode.
Alpha 17 supports PD charging through the left USB-C connector. There are various things to know before utilising it. First, you need a PD charger with PD 3.0 protocol that can give at least 100W of power to charge your laptop while it’s on.
If you simply charge it while it’s off or in sleep mode, you only need a 65W charger. Check your Type-C cable for 65W or 100W power transmission. If everything is ready, you may enjoy PD charging.
To easily access a succession of functions, we have included several shortcuts to function keys row
For instance, press Fn + F7 to switch to Extreme Performance for more raw performance or Balanced for balancing performance and noise; press Fn + F8 to launch the Cooler Boost, which will increase the fan speed to the highest, cooling the laptop as quickly as possible; To change keyboard backlight colour, press Fn + F9 to swap illumination profiles.
The new Alpha 17 has powerful performance, cooling, a wonderful keyboard, diverse connections, and reasonable upgradability. The new Alpha 17 is the greatest AMD gaming laptop with a superb keyboard and reasonable upgradability.
1 note
·
View note
Note
hey! i wanted to know more about cs or it major.
how much mathematics is required for it? basically how much of what is taught in the entire course? i am trying to figure if i should go for it or not. thanks in advance!
hello! okay, so it’s going to vary a lot between university and country, but I’ll tell you what it was like for me...
some background: my university is in australia, i take four units in a semester, and my degree is 3 years full time.
every semester I had at least one (if not 2-3) programming-centred unit(s). in order I learnt: python (my fav), sql, C#, C, Java, JavaScript, etc. another notable mention is MATLAB.
there wasn’t a lot of maths in my degree, but it wasn’t absent either. my university focuses a lot more on the practical side of computer science - as in programming - rather than the theoretical (math) side. that being said, i actually loved the theoretical math stuff I did as it was very logic based and different to anything i ever did in school (I did not take the highest math available in school). i’d really recommend not being afraid of studying CS because of the possibility of math because in university they often teach things right from the basics, and offer lots of additional support options to help if you’re struggling.
some of my favourite things i learnt studying CS was python, basic react web app creation, a lil data science, discrete structures (fun math), beginner robotics and machine learning! this list is quite broad which means ive been able to explore the plethora of compsci related avenues available to me to decide where to go next.
hope this helped!
6 notes
·
View notes
Text
[HIRE A TUTOR] TAKE MY ONLINE CLASS | ONLINE CLASS TAKER | DO MY HOMEWORK FOR ME | CHEAT ONLINE PROCTOR | TAKE MY EXAM | WRITE MY ESSAY | CLASS TAKER TUMBLR | PAID HOMEWORK SERVICE TUMBLR | DO MY EXAM REDDIT | DO MY ASSIGNMENT TUMBLR | PAY, SOMEONE TO DO YOUR HOMEWORK
I can take your Class | I can take your Exam | I can write your Essay!
Contact me by Text or DM me.
Phone: +1(929) 443-0515
(Text or Call for a quick response)
Email: [email protected]
Discord: UnemployedProfessor#4746
I help with:
Essay Writing: Term Paper Writing | College Writer | Annotated Bibliography | Literature Review | Dissertation | Thesis | Research Paper | Discussion posts and Replies | Analysis | Professional business letters | Website content | Product Reviews | SEO | Blog writer | Summary | Editing
Statistics: AP Statistics | Biostatistics | Business Statistics | Elementary Statistics | Intro to Statistics | Psychology Statistics | Social Science Statistics | Statistics & Probability | Statistical Methods | Statistical & Probability Models
Math: Advanced Functions | Algebra | Calculus 1, 2, 3 (and 4 in some schools) | Vector Calculus | Differential Calculus | Integral Calculus | Multivariable Calculus | Differential Equations | Discrete Math | Discrete Structures | Finite Mathematics | Functions | Geometry | Linear Algebra | Precalculus | Probability | Real Analysis | Statistics | Trigonometry | Quantitative Methods & Reasoning
Science: Anatomy & Physiology | Astronomy | Biochemistry | Biology | Chemistry (General, Inorganic & Organic) | Dental / Pre-Dental | Earth Science | Engineering (Almost All Types) | Environmental Science | Epidemiology | Fluid & Mechanics | Geology | Geophysics | Medicine / Pre-Med | Microbiology | Neuroscience | Physics | Physical Science
Business: Accounting | Auditing | Banking | Business Administration | Business Law | Corporate Finance | Cost Accounting | Econometrics | Economics | Finance | Financial Institutions |Financial Reporting | Global Economics | Governance | International Economics | Macroeconomics | Management | Marketing | MBA Courses | Mergers and Acquisitions | Microeconomics | Operations Management | Principles of Accounting | Real Estate | Taxation
English: Business Writing | Creative Writing | Critical Reading | Digital Media | Eastern Literature | English Literature | Essays | Expository & Persuasive Writing | Fiction Writing | Greek and Roman Philosophy | Grammar | Poetry
Humanities & Social Sciences: Architecture | Anthropology | Art History | Communication | Criminal Justice | Forestry | Ethnic Studies | Film | History | Law | Pre-Law | Music | Philosophy | Political Science | Psychology | Psychiatry | Religious Studies | Sociology | Theology | Women Studies
Computer Science & Programming: Android | AWS | Azure | Blockchain | Cryptocurrency | Smart Contracts | C | C# | C++ | Cloud | Computer Organization and Assembly Languages | CSS | Data Science | Data Structures and Algorithms | Deep Learning | Design Patterns | Game Design and Development | iOS | Java | Javascript | Machine Learning | MATLAB | MySQL | Networking | NoSQL| Object Oriented Programming | Operating Systems | PHP | Principles of Computer Science | Programming for Virtual Reality | Programming Languages | Python | R | Robotics | Ruby | Software Engineering | SQL | Swift | Web Development
PROCTORED EXAMS: PROCTOR U | EXAMPLIFY | EXAMSOFT | PROCTORU | LOCKDOWN BROWSER | RESPONDUS | TEAS | NLN | HESI | ATI | GRE | LSAT | EXAM SOFT | EXAMITY | PEARSON VUE ONVUE | PROCTORIO | PROCTORTRACK | CLEP | ACCUPLACER | PROPROCTOR
#students#assignments#chemistry#coursework#do my homework#do your homework#education#homework business#homework help#homeworkhelp#studentshelp#university#teachers#universities#school#programs#college#college student#college essay#college life#studyblr#university studyblr#examination
5 notes
·
View notes
Text
Bonus post: Stats 101 - testing data for normality & significance tests for categorical and continuous variables.
Understanding and analysing data can be a tremendously daunting task, so I thought I would put together a simple go-to guide on how to approach your data, whether it be numerical or categorical. 📈📊
This post will cover:
Types of data
Contingency tables and significance tests for categorical data
Testing for normality in continuous data
Significance tests for continuous variables
NB: Remember to keep your data organised, especially if you are using software packages like ‘R’, MATLAB, etc.
Before I move on, I would like to thank the University of Sheffield core bioinformatics group for most of the content below. 💡
Types of data

There are two main types:
Numerical - data that is measurable, such as time, height, weight, amount, and so on. You can identify numerical data by seeing if you can average or order the data in either ascending or descending order.
Continuous numerical data has an infinite number of possible values, which can be represented as whole numbers or fractions e.g. temperature, age.
Discrete numerical data is based on counts. Only a finite number of values is possible, and the values cannot be subdivided e.g. number of red blood cells in a sample, number of flowers in a field.
Categorical - represents types of data that may be divided into groups e.g. race, sex, age group, educational level.
Nominal categorical data is used to label variables without providing any quantitative value e.g smoker or non smoker.
Ordinal categorical data has variables that exist in naturally occurring ordered categories and the distances between the categories is not known e.g. heat level of a chilli pepper, movie ratings, anything involving a Likert scale.
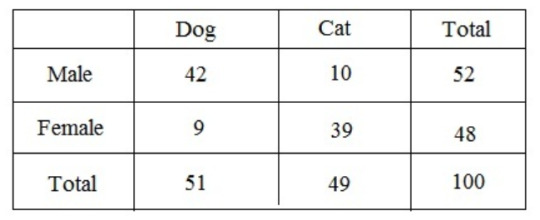
Contingency tables & significance tests for categorical variables
Contingency tables (also called crosstabs or two-way tables) are used in statistics to summarise the relationship between several categorical variables.
An example of a contingency table:
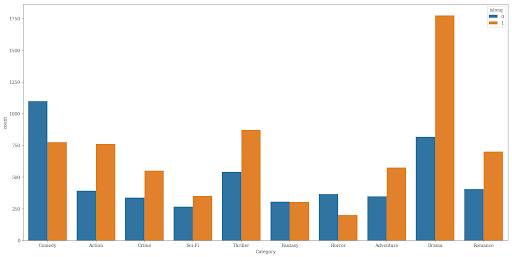
A great way to visualise categorical data is to use a bar plot/chart, which looks something like this:
There are two main hypothesis tests for categorical data:
Chi-squared test
Fisher exact test
Chi-squared test:
Compares the distribution of two categorical variables in a contingency table to see if they are related e.g. smoking and prevalence of lung cancer.
Measures difference between what is actually observed in the data and what would be expected if there was truly no relationship between the variables.
Fisher exact test:
Is used instead of Chi-squared when >20% of cells have expected values of <5, or any cell has a count of <1.
If you want to compare several contingency tables for repeated tests of independence i.e. when you have data that you've repeated at different times or locations, you can use the Cochran-Mantel-Haenszel test.
More detail:
In this situation, there are three nominal categorical variables: the two variables of the contingency test of independence, and the third nominal variable that identifies the repeats (such as different times, different locations, or different studies). For example, you conduct an experiment in winter to see whether legwarmers reduce arthritis. With just one set of people, you'd have two nominal variables (legwarmers vs. control, reduced pain vs. same level of pain), each with two values. If you repeated the same experiment in spring, with a new group, and then again in summer, you would have an added variable: different seasons and groups. You could just add the data together and do a Fisher's exact test, but it would be better to keep each of the three experiments separate. Maybe legwarmers work in the winter but not in the summer, or maybe your first set of volunteers had worse arthritis than your second and third sets etc. In addition, combining different studies together can show a "significant" difference in proportions when there isn't one, or even show the opposite of a true difference. This is known as Simpson's paradox. To avoid this, it's better to use the Cochran-Mantel-Haenszel for this type of data.
Testing for normality in continuous data
The first thing you should do before you do ANYTHING else with your continuous data, is determine whether it is or isn’t normally distributed, this will in turn help you choose the correct significance test to analyse your data.
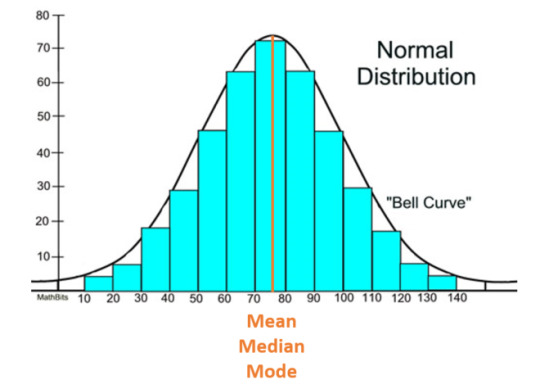
A normal (also known as parametric) distribution is a symmetric distribution where most of the observations cluster around the central peak and the probabilities for values further away from the mean taper off equally in both directions. If plotted, this will look like a symmetrical bell-shaped graph:
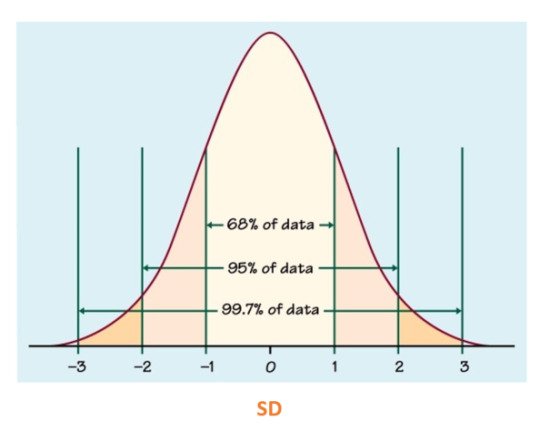
A standard deviation (SD) can be calculated to measure the amount of variation or dispersion of a set of values from the mean. The main and most important purpose of this is to understand how spread out a data set is; a high SD implies that, on average, data points are all pretty far from the average. The opposite is true for a low SD means most points are very close to the average. Generally, smaller variability is better because it represents more precise measurements and yields more accurate analyses..
In a normal distribution, SD will look something like this:
In a normal distribution, skewness (measure of assymetry) and kurtosis (the sharpness of the peak) should be equal to or close to 0, otherwise it becomes a variable distribution.

Testing for normality
Various graphical methods are available to assess the normality of a distribution. The main ones are:
A histogram, which will look something like this:
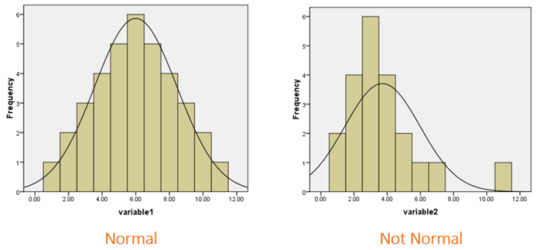
Histograms help visually identify whether the data is normally distributed based on the aforementioned skewness and kurtosis.
A Q-Q plot:
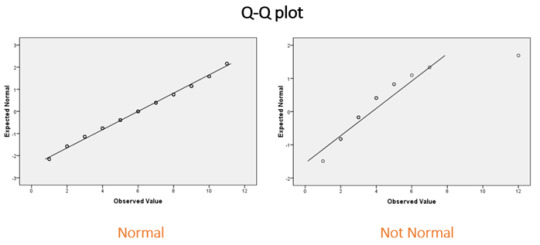
Q-Q plots allow to compare the quantiles of a data set against a theoretical normal distribution. If the majority of points lie on the diagonal line then the data are approximately normal.
and...
A box plot:
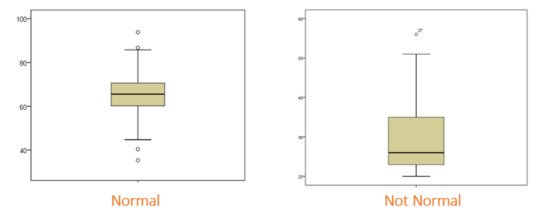
A box plot is an excellent way of displaying continuous data when you are interested in the spread of your data. The thick horizontal bar indicates the median, the top and bottom of the box indicate the interquartile range, and the whiskers represent the spread of data outside of this interquartile range. The dots beyond the whiskers represent outliers, which represent observations that are distant from other observations.
A disadvantage of the box plot is that you don’t see the exact data points. However, box plots are very useful in large datasets where plotting all of the data may give an unclear picture of the shape of your data.
A violin plot is sometimes used in conjunction with the box plot to show density information.
Keep in mind that for real-life data, the results are unlikely to give a perfect plot, so some degree of judgement and prior experience with the data type are required.
Significance tests
Aside from graphical methods, there are also significance tests, which are used to test for normality. These tests compare data to a normal distribution, whereby if the result is significant the distribution is NOT normal.
The three most common tests are:
Shapiro-Wilk Test (sample size <5000)
Anderson-Darling Test (sample size > or = 20)
Kolmogorov-Smirnov Test (sample size > or = 1000)
Significance tests for continuous variables
A quick guide for choosing the appropriate test for your data set:

t-test - normally distributed (parametric) data
There are three types of t-test
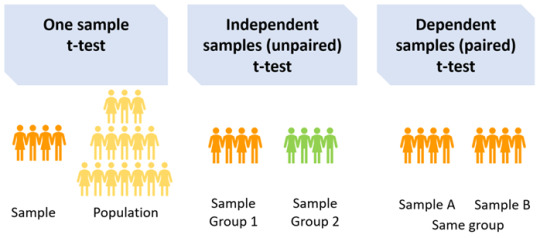
One sample t-test: Compares the mean of the sample with a pre-specified value (population mean) e.g. if the average score of medical students in UK universities is 72 and you want to test whether the average score of medical students in your university is higher/lower, you would need to specify the population mean, in this case 72, when running your t-test.��
A two-sample t-test: Should be used if you want to compare the measurements of two populations. There are two types of the two-sample t-test: paired (dependent) and independent (unpaired). To make the correct choice, you need to understand your underlying data.
Dependent samples t-test (paired): Compares the mean between two dependent groups e.g. comparing the average score of medical students at the University of Sheffield before and after attending a revision course, or comparing the mean blood pressure of patients before and after treatment. Independent samples t-test (unpaired): Compares the mean between two independent groups e.g. average score of medical students between University of Sheffield and the University of Leeds, or comparing the mean response of two groups of patients to treatment vs. control in a clinical trial.
There are several assumptions for the independent (unpaired) t-test:
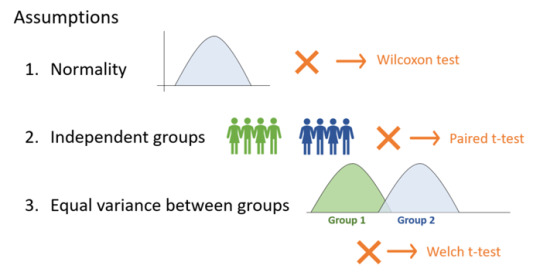
The t-test assumes that the data has equal variance and relies on the data to be normally-distributed. If there isn’t sufficient confidence in this assumption, there are different statistical tests that can be applied. Rather than calculating and comparing the means and variances of different groups they are rank-based methods. However, they still come with a set of assumptions and involve the generation of test statistics and p-values.
Welch t-test, for instance, assumes differences in variance.
Wilcoxon test (also commonly known as the Mann-Whitney U test) can be used when the data is not normally distributed. This test should not be confused with the Wilcoxon signed rank test (which is used for paired tests).
The assumptions of the Wilcoxon/Mann-Whitney U test are as follows:
The dependent variable is ordinal or continuous.
The data consist of a randomly selected sample of independent observations from two independent groups.
The dependent variables for the two independent groups share a similar shape.
Summary of the above:

ANOVA - normally distributed (parametric) data
Like the t-test, there are several types of ANOVA tests:
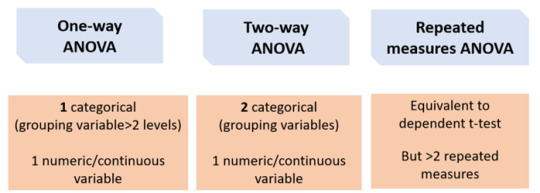
One-way ANOVA:
Equivalent to the independent t-test but for > 2 groups. If you want to compare more than two groups, a one-way ANOVA can be used to simultaneously compare all groups, rather than carrying out several individual two-sample t-tests e.g. to compare the mean of average scores of medical students between the University of Sheffield, the University of Leeds, and the University of Manchester.
The main advantage of doing this is that it reduces the number of tests being carried out, meaning that the type I error rate is also reduced.
Two-way ANOVA: 2 categorical (grouping variables) e.g. comparing the average score of medical students between the University of Sheffield, the University of Leeds, and the University of Manchester AND between males and females.
Repeated measures ANOVA
Equivalent to a paired t-test but for >2 repeated measures e.g. comparing the average score of medical students at University of Sheffield for mid-terms, terms, and finals.
If any of the above ANOVA tests produce a significant result, you also need to carry out a Post-Hoc test.
Post-Hoc test e.g. Tukey HSD
A significant ANOVA result it tells us that there is at least on difference in the groups. However, it does not tell us which group is different. For this, we can apply a post-hoc test such as the Tukey HSD (honest significant difference) test, which is a statistical tool used to determine which sets of data produced a statistically significant result...
For example, for the average scores of medical students between the University of Sheffield, the University of Leeds, and the University of Manchester, the Tukey HSD output may look something like this:
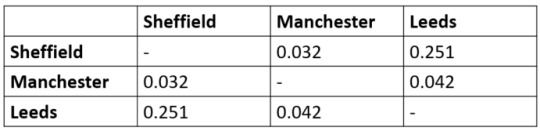
This shows a significant difference between medical students in Manchester and Sheffield and between Leeds and Manchester but not Leeds and Sheffield.
Kruskal Wallis and Friedman tests
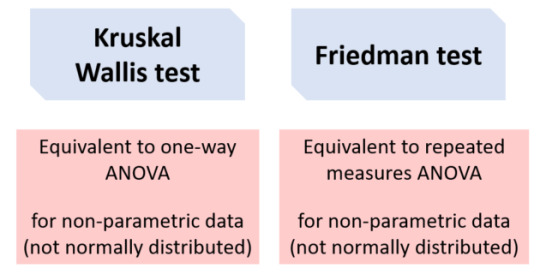
Data that does not meet the assumptions of ANOVA (e.g. normality) can be tested using a non-parametric alternative. The Kruskal-Wallis test is derived from the one-way ANOVA, but uses ranks rather than actual observations. It is also the extension of the Mann-Whitney U test to greater than two groups. Like the one-way ANOVA, this will only tell us that at least one group is different and not specifically which group(s). The Post-Hoc Dunn test is recommended, which also performs a multiple testing correction. For the Friedman test, you can use the Wilcoxon signed-ranks Post-Hoc test. And that is your go-to guide to on how to approach your data! I really hope you find it useful; it definitely helps clarify things for me. ✨
GOOD LUCK!

#diary of a phd student#phd life#phd#bonus post#data analysis#guide#categorical#numerical#data#testing for normality#normal distribution#parametric#non parametric#skewness#kurtosis#science#engineering#ANOVA#t-test#types of data#continuous#discrete#nominal#ordinal#contingency table#chi squared#post hoc tests#kruskal wallis#studyblr#shapiro wilk
88 notes
·
View notes
Text
Matlab Discrete Assignment Homework Help
https://www.matlabhomeworkexperts.com/matlab-in-discrete-time-signal-operations.php
Simulink models can process both discrete-time and continuous-time signals. Models built with DSP System Toolbox software are often intended to process discrete-time signals only. A Discrete-Time Signal is a sequence of values that correspond to particular instants in time. Our services are available 24×7 that helps the students of universities and colleges in order to make Discrete Time Signal Operations assignments. We provide Matlab Discrete Time Signal Operations solutions which are of high quality and it can be provided to the students of colleges, universities, or PhD. Discrete Time Signal Operations in MATLAB deals with basic concepts in mathematics and Discrete Time Signal Operations such as matrix and vector algebra, convolution, iterated operations, etc.
We at www.matlabhomeworkexperts.com have talented pool of Discrete Time Signal Operations homework experts, Discrete Time Signal Operations assignment tutors, Discrete Time Signal Operations professionals, Discrete Time Signal Operations Solvers and Discrete Time Signal Operations Helpers can cater to your entire needs in the area of Discrete Time Signal Operations such as MATLAB Discrete Time Signal Operations Homework Help, MATLAB Discrete Time Signal Operations Assignment Help, MATLAB Discrete Time Signal Operations Project Paper Help, MATLAB Discrete Time Signal Operations Tutoring help and MATLAB Discrete Time Signal Operations Exam Preparation Help.
#Matlab Discrete Assignment Homework Help#Matlab Discrete Assignment Help#Matlab Discrete project Help#Matlab Discrete Assignment Experts#Online Matlab Discrete Assignment Homework Help#Matlab Discrete Assignment Homework Online Help#Matlab Discrete Help
0 notes
Text
Osirix md stanford


Projects include applying machine learning for the improved quantitation of MRS and MRI data for the treatment monitoring of brain tumors and measuring brain metabolism under hypothermic conditions. You will be joining a multidisciplinary research team with expertise spanning physics, electrical engineering, biochemistry, and clinical sciences, to help develop novel data acquisition and processing tools for assessing critical in vivo processes. Title/Project: Magnetic resonance methods for measuring brain energy metabolism and oxidative stress.īeyond anatomy, magnetic resonance imaging (MRI) and spectroscopy (MRS) provide unique opportunities for assessing metabolism within the body.

Familiarity with Python, Matlab, or C++ programming languages. Suitable for students with EE, BioE, Physics, CS, or similar backgrounds. Seeking highly motivated students enthusiastic about research. A remote option will be available, regardless of project. Possible lab projects include developing advanced CT acquisition methods or evaluating a novel dual-layer x-ray detector. Possible computational projects include the use of AI to improve COVID detection in chest x-ray images, to optimize CT for radiation dose and image quality, to improve breast tumor detection in breast CT, or to improve spectral CT imaging. The REU project will be customized to the student’s skills and interests, and a lab mentor will be identified accordingly. We develop these technologies with advanced computational tools, in the Zeego Lab (a robotic C-arm that supports interventional imaging, animal studies, and more), and in the Tabletop X-Ray CT Lab (for prototyping novel systems, custom geometries, and phantom experiments). My group develops technologies for advanced x-ray and CT imaging, including artificial intelligence (AI) methods, novel system designs, and spectral CT imaging. colleges/University may apply (visa restrictions may apply). International students who are matriculated at U.S. rising juniors or seniors) and have not graduated by the beginning of the program. Undergraduate students from other institutions who have 2 years of college experience (i.e. Housing is not provided, although additional funds for on-campus summer housing will be offered to accepted interns (Stanford students only). Stanford undergrads must have been enrolled full-time for a minimum of 2 quarters in the 2020-2021 academic year and will need to use their Flex Time for the summer quarter. Stanford Undergrads who will not have graduated by the beginning of the program. Selected students will receive a stipend of $5,000 for the 10-week (40 hours per week) summer session of full-time research work. Students are also required to present their research at the final presentation/poster session and complete a program questionnaire.įor summer 2021, the RSL REU program will feature a flexible hybrid format (remote and/or on-site). Students are expected to participate for the duration of the program (exceptions may be granted at the discretion of the faculty mentor). This is a 10-week program starting June 21 to Aug(40 hours per week). Check back with us next year! Program Requirements: This software may not be redistributed, sold or commercially used in any other way without prior approval of the author.May update: All applications are closed. If you do use this software for scientific research please give appropriate credit in publications. Any other use is entirely at the discretion and risk of the user. YOU CAN ONLY USE OSIRIX AS A REVIEWING AND SCIENTIFIC SOFTWARE, NOT FOR PRIMARY DIAGNOSTIC.ĬERTIFIED VERSION OF OSIRIX IS AVAILABLE HERE: OSIRIX MDĪll calculations, measurements and images provided by this software are intended only for scientific research. THIS VERSION OF OSIRIX IS NOT CERTIFIED AS A MEDICAL DEVICE FOR PRIMARY DIAGNOSIS. THIS SOFTWARE IS NOT INTENDED FOR PRIMARY DIAGNOSTIC, ONLY FOR SCIENTIFIC USAGE. YOU MAY HAVE ADDITIONAL RIGHTS AND SOME OF THESE LIMITATIONS MAY NOT APPLY TO YOU. THESE EXCLUSIONS AND LIMITATIONS MAY NOT APPLY IN ALL JURISDICTIONS. UNDER NO CIRCUMSTANCES SHALL THE AUTHORS BE LIABLE FOR DIRECT, INDIRECT, SPECIAL, INCIDENTAL, OR CONSEQUENTIAL DAMAGES RESULTING FROM THE USE, MISUSE, OR INABILITY TO USE THE SOFTWARE, EVEN IF THE AUTHOR HAS BEEN ADVISED OF THE POSSIBILITY OF SUCH DAMAGES. NO ORAL OR WRITTEN COMMUNICATION FROM OR INFORMATION PROVIDED BY THE AUTHORS SHALL CREATE A WARRANTY. THE AUTHORS MAKE NO WARRANTIES AS TO PERFORMANCE OR FITNESS FOR A PARTICULAR PURPOSE, OR ANY OTHER WARRANTIES WHETHER EXPRESSED OR IMPLIED. OSIRIX (“THE SOFTWARE”) IS PROVIDED AS IS.
0 notes
Note
hi there! i’m a high schooler and i’m seriously considering majoring in computer science when the time comes. do you think you could maybe talk a little bit about what it’s like studying comp sci? if you can. i hope you’re having a great day
hope you’re having a great day too!
What my first year of studying computer science was like
obligatory preface that courses differ between universities and colleges. i study in australia.
The biggest challenge I faced per se going into comp sci was how nothing I did at school prepared me for it. The kind of content I’ve learnt wasn’t similiar to school and the assignments have been very different. No analytical essays and scientific reports for me (there has been essays and reports tho). In my school IT class I learnt basic HTML and CSS which was the only programming knowledge I went into comp sci with. (Id also gotten pretty far on khan academy’s JavaScript course in like year ten but I’ve forgotten all of that now lol).
I have four units a semester and have completed my first year (of 3, although I’m taking less units this year so I’ll finish in 3.5 years).
What I actually did in my first year:
Semester 1 (pre-major picking, two of these were for the other major option)
Learnt general computer hardware and how it functions. The assignment was using a raspberry pi to do something that used hardware (the pi), software (basic code) and the internet (I used twitter). My project is on Twitter at SunsetIFB102
Group project app design stages. Like drawing the layouts, getting feedback, then digital sketches then semi fancy looking sketches (not comp sci major)
Python! I really liked this. Taught the basics of python and in general programming. It was kind of intimidating how many people had coded before so I had to focus on ignoring them and learning for myself. Also really salty I was 1% off a high distinction for the whole unit AGH
Databases and SQL. This would’ve been a useful unit if the lecturer was, how do I put this kindly, good at his job. (Not comp sci major, although definitely use databases later on)
Semester two (all comp sci major)
C# , basics of object oriented programming principles. Which is a fancy way of saying it taught how you should write your code so it’s laid out effectively.
C, how to program microprocessors. Basically how to program hardware machines. C is mostly used for machines like ATMs, a fridge perhaps, probably a roomba and other single purpose kind of things. Also from this I can program arduinos and read arduino code easier since arduino code is a C/C++ hybrid. (This and the previous unit had high fail rates and were honestly Tough)
Information security (apart of network security minor) This unit talked about processes of protecting information in organisations and on a single person level. Basics of cryptography was discussed and hashes and how ways information is kept secure when transferring between objects (like over the internet)
Computation mathematics (apart of intelligent systems minor). This was a weird unit to me and was mostly math majors. It taught all these different equations which allow you to make approximations. Honestly confused how it’s used for computers but we learnt MATLAB and it’s a pre requisite for an intro to robotics unit I’m taking this year :)
So yeah, that’s an account of what I actually studied. Reading over it it seems way more impressive than it probably was. Computer science isn’t easy (well, unless you want to scrape a pass each time) but it isn’t horribly difficult. It’s how different it is to high school work that can trip you up. I can’t make aesthetic studyblr notes on paper because its all on my computer and can’t turn it off when studying because I need it.
My assignments are typically big coding projects, exams (multiple choice if a coding unit) and essays if it deals with theory (like info sec did).
This coming semester I’m learning Java and GUI’s (graphical user interfaces), JavaScript and HTML and whatever else for web applications, and discrete maths which seems to be for notation used later on... it looks very strange.
Hope this helps! If you have any more questions feel free to DM me!
Also if anyone else wants to add their experiences, feel free to reblog with your tips.
#computer science#software engineering#engineering#comp sci#studyblr#study tips#tips#help#stem#stem studyblr#stemblr#women in stem#women in tech#women in science#university#college
107 notes
·
View notes
Text
Why Choose All Homework Assignments For the Data mining Assignment Help?
About Data Mining
Data Mining Project is one of the most important and most interesting subjects to the students of data mining. Today, when the technology is at its boom, data analysis and the data mining are the two most prevalent options for the job seeker to learn. Below are some of the key concepts that are used in data mining in a nutshell:
Definition :Data mining is the subject in which the patterns of the important data are mined from the raw data source that is given to you. There are millions of files residing on the different servers around the globe. The technique of bringing the data that is useful for the users is known as data mining.
Application of data mining: Today is the world of digitization and data mining plays a major role in giving the relevant information to the users all over the internet. However, it’s not just the internet, but there are many application of data mining in the different fields like business in knowing the customer relationship, market basket analysis, and so on. The applications of data mining stretches to the field of science, medicine, human rights, games and many more.
Tools used for data mining: Agent mining, anomaly detection, Bayesian networks, classifications, decision trees, genetic algorithm, machine learning, time series analysis, neural networks, and so on are the different techniques involved while people do data mining. More emphasis is given to the machine learning these days as it is one of the booming areas of the time. There are many open source tools available in the market that helps in data mining. R and MATLAB along with many other important language are there that help in data mining at https://www.allhomeworkassignments.com/
Different assignment topics: Other than the introductory aspects of the data mining different important aspects are supposed to be learned by the students. Hence when the student seeks Data Mining Assignment Help they find the topics like OLAP operations, Data preprocessing, Data Cleaning, Data Transformation, Data Reduction, Discretization and generating concept hierarchies, Weka 3 Data Mining System, filters, discretization, Data mining knowledge representation, Task-relevant data. Although the there is more if you dig into the advanced concept of the data mining, however, these are most common topics.
All these important points tell us that data mining is not only one of the important subjects but it is a vast subject as well. Hence if the students are finding some online/offline tool for their Data Mining Homework Help, then All Homework Assignments are there to assist them in.
Why Choose All Homework Assignments For The Data Mining Assignment Help?
Well, https://www.allhomeworkassignments.com/ have the experts that will help the student with the every topic related to the data mining. They will not just get them the exact answers, but they will also help them with the new ideas for their dissertations. The flexible tuition classes are provided so that the students can learn all the basics of data mining. Moreover, the editors that we have are highly capable of giving you a unique content without any plagiarism. A 24*7 customer support is also provided to you so that you can have the solution to all your queries within the time.
If you are wondering about of we be able to write the assignment in the format that you want, then rest assured because we are the global facility who will help you no matter from what education system you belong. https://www.bestassignmentsupport.com/ are obliged to deliver you the assignment in time and hence you should register with all assignment experts today.
#Data Mining Assignment Help#Data Mining Assignment Homework Help#Data Mining Homework Help#Data Mining Experts Help#Data Mining Project Help
0 notes
Text
Why do I receive different results when comparing a digital ?
Why do I receive different results when comparing a digital filter designed using the BUTTER and BILINEAR functions in the
Signal Processing
Toolbox?Using the following specifications:
Fs = 172800; Fc = 70000;
where "Fs" represents the sampling frequency and "Fc" represents the cutoff frequency, I created a digital filter in two different ways:
1. Using the BUTTER function.
[B ,A] = butter(4,Fc/(Fs/2));
2. Using the BILINEAR function to convert the analog filter designed using the BUTTER function into a digital filter through a bilinear transformation.
[Bs,As] = butter(4,Fc*2*pi,'s'); [Bz,Az] = bilinear(Bs,As,Fs);
I then used the FVTOOL function to compute the magnitude response and compared the two results:
fvtool(B,A,Bz,Az);
Notice that the results of the two magnitude responses are not the same even though I am using the same specifications.
ANSWER
Matlabsolutions.com provide latest MatLab Homework Help,MatLab Assignment Help for students, engineers and researchers in Multiple Branches like ECE, EEE, CSE, Mechanical, Civil with 100% output.Matlab Code for B.E, B.Tech,M.E,M.Tech, Ph.D. Scholars with 100% privacy guaranteed. Get MATLAB projects with source code for your learning and research.
This is the expected behavior for filter discretization in the
Signal Processing
Toolbox. The example above illustrates the nonlinear nature of the bilinear transformation. To counteract this nonlinearity, it is necessary to create analog domain filters with "prewarped" band edges, which map to the correct locations upon bilinear transformation. If you want to design the analog filter that will be equivalent to the design using the ‘s’ option in the BUTTER function, you need to prewarp the frequency as follows:
Wc = tan(pi/2*Fc/(Fs/2)); % Analog prewarped freq. rad/second
Note that this frequency is already in rad/second so the analog design is:
[Bs,As] = butter(4,Wc,'s');
Now the issue is what sampling frequency (Fs) to use with BILINEAR. In the prewarping method used to compute "Wc", we implicitly used the bilinear transformation that is most commonly seen in the literature:
s=(1-z^(-1))/(1+z^(-1)).
In the BILINEAR function documentation, the following transformation is used:
SEE COMPLETE ANSWER CLICK THE LINK
https://www.matlabsolutions.com/resources/why-do-i-receive-different-results-when-comparing-a-digital-.php
0 notes
Text
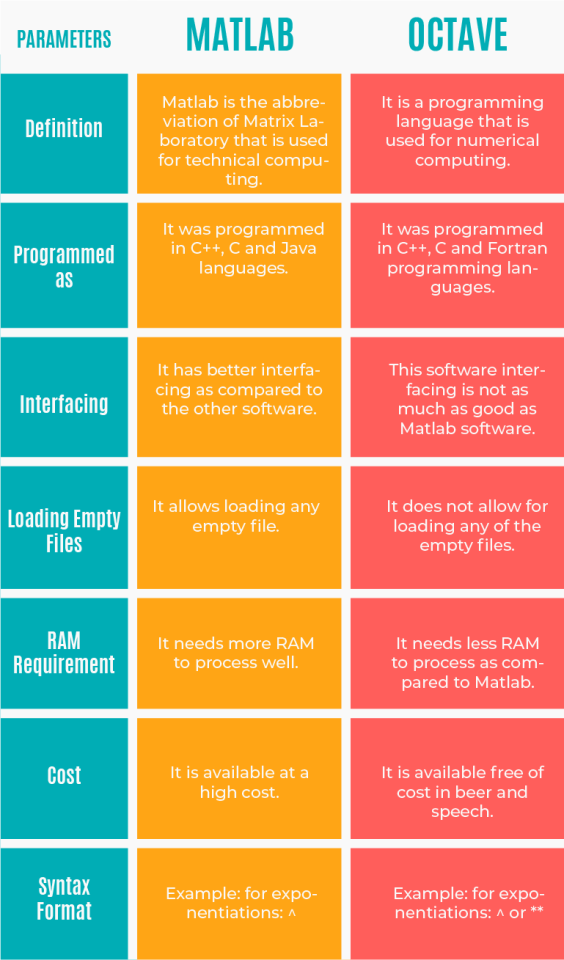
What is the difference between matlab and octave ?

In this technological era, people have a variety of programming languages in which they can select any one or more of them and get in-depth knowledge of that particular language. In this article, we are going to discuss two computer programming languages used by engineers as well as by scientists, and the two languages are Matlab and Octave. Along with the details of Matlab vs Octave, we want to mention that our expert’s team provide a Matlab Assignment Help that is assisted by the latest Matlab software such as:
MathWorks.
Matlab&Simulink.
GNU Octave and much more.
As Octave is an alternative for Matlab, individual get confused with these two languages, and they get stuck in the following questions:
What are Matlab and Octave?
Where can these be used?
What is the purpose of Matlab and Octave?
The critical question: What is the difference between Matlab and Octave?
Therefore, to get you out of these kinds of questions, we will discuss all the points that will help you to understand these two languages. We will also give the head to head difference table by which you can easily recognize the dissimilarity of these programming languages.
The basic overview of Matlab vs Octave
Octave is also called GNU Octave, which is accessible in 19 languages. This programming language is used to solve the numerical problems of linear and nonlinear. This language is one of the most compatible languages with Matlab. Octave also refers to a structural programming language that supports a common library of C standards, Unix system cells, and the functions of C languages.
Matlab stands as Matrix Laboratory. This language is a high-level programming language that is used for technical Computations. It was drafted by Cleve Moler and developed by MathWorks. Matlab is a multi-exemplar programming language that supports imperative, functional, and object-oriented language.
Besides this difference table, various other syntax differences are discussed below. If you find any difficulty implementing these syntaxes in your programming, then you can take the help of our experts who are available for any Matlab Assignment Help.
To initiate a comment: Matlab uses ‘%’ sign and Octave use both ‘%’ and ‘#’ sign that is interchangeable too.
To write a string delimiter: Matlab old version uses ‘; but the new version of Matlab uses both ‘ or “ with a slight overlapping functionality difference. Octave use ‘ or “.
To write exponentiations: Matlab needs ^, Octave needs either ^ or ** for exponentiations.
For hexadecimal notation: Matlab needs the hex2dec function as “hex2dec(‘F0’)’), whereas Octave can support the style of C language; therefore, you can write the hexadecimal notation as “0xF0”.
To block the ends: Matlab needs ‘end’ whereas Octave needs ‘end’ or the block specification with ‘endif,’ endfor,...
For searching a file: If a networking distributor like Netlab requires a function name as fcnjdg, then make a file named as fcnjdg.m by using the content that is shown below and place it where Octave can easily find it:
function f = fcnjdg (y, n)
f= y;
End
For bilinear transformation: Discuss an example of a2d with an analog parameter X:
discrete= a2d(X,0.8,’trustin’); // Matlab
discrete= a2d(X,0.8,’bi’); // GNU Octave
For a linear programming function: For more indulgent, Matlab requires “a” and “b” inputs for either column or row vector. Whereas, Octave requires them as a column vector.
For error(meg) function: if a message is empty, then Matlab shows no-op, but Octave will result as an error.
For plot function: Matlab requires only legend function, whereas Octave requires label or legends function for the plot-specific function.
plot(x,y, ‘;label;’) //octave
plot(x,y); legend(‘label’) //Matlab/octave
For logical operator ‘NOT’: Matlab is more similar to C, Java programming, therefore, it uses a syntax ! with the boolean values, whereas Octave users can use both ~ as well as ! with boolean values. For a not equal comparison, Matlab needs ‘~=’ and Octave needs either '~=' or '!='.
For assignment: Matlab supports individual functioning:
A = B + 1
C = A
Whereas, Octave can define a function in a single row:
C = A = B + 1
For line continuation: In Matlab users need ‘......’ for a continuation of the line whereas Octave does not need this.
Matlab: rand(1, …..
2)
Octave: rand(1,
2)
For whitespace: Matlab requires the transpose operator for allowing the whitespace whereas, octave treats it as an operator like C, C++.
[0 1]’ // work for both Matlab and Octave.
[0 1] ‘ // work for Octave.
For print function: Matlab uses the fprintf command for printing, Octave uses both printf and fprintf command for printing the result.
foo= 2;
fprintf(‘My outcome is: %d\n’, foo) //Matlab and Octave.
foo = 2;
printf ('My outcome is: %d\n', foo) // Octave only
For C-Style Assignment operator and Auto increments: Matlab is not allowed any of the C style assignment operators, but Octave allows them such as i + +, i+=2, ++i, etc.
For the products of boolean: Matlab responds individually while computing any of the boolean values:
A = ones(3,3) ; prod(size(A)==1)
Result: Matlab: The product is merely backed for floating input value.
Octave: ans = 0
For nargin: Basically, nargin returns the value of the input arguments for a function. Matlab is not supporting this command, but octave returns as:
Function MyLife = myfun ©
if (nargin == 2)
nargin = 3;
Else
nargin = 4
end
For the file startup.m: Matlab can execute the file name ‘startup.m’ from the command line into its directory, but the old version of Octave was not supporting this command. But from the version Octave 4.2.0, it starts working similar to Matlab.
if ( exist ('startup.m', 'file') )
source ('startup.m') // load startup.m
endif
Conclusion:
Matlab and Octave programming language is used to a similar purpose; the only difference in both of them is of their syntax and in other features. Matlab has its specialized toolbox that is not present in Octave. Both of the programming languages are not fully compatible, which means in Matlab, you can execute the code of the Octave and vice-versa.
The main objective of the Octave programming is to offer freedom to the programmer to select the software to execute the algorithms. It has compatibility with Matlab and octave uses the written command within a buffer. By doing this, you can recall or re-edit any of the commands within the buffer. It consists of the limited support for managing the data in a particular structure.
If you want to take the help of our experts who are working for the Matlab Assignment Help, then you can submit your queries on Matlab, and they will provide you the best Solutions. Our customer support executive is available to you 24*7, and they can provide you the data as per the guidelines of your college. So, whenever you find any difficulty with Matlab Assignments, Matlab Assignment Help is ready to help you out.
0 notes
Text
The 100 Most Popular Free Online Courses of 2019
It’s been eight years since a few Stanford professors decided to offer their courses online for free. These courses are now known popularly as MOOCs or Massive Open Online Courses.
And since then, over 900 universities have launched 13,500 online courses. These courses have been taken by 110 million learners.
Not all of these courses are as free as they used to be. Some now charge for certifications or require you to pay to access the full course materials. But you can still audit them for free.
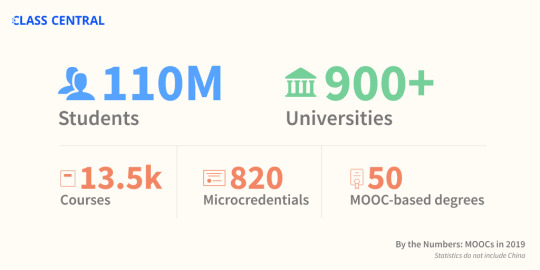
I’ve been keeping track of these courses the entire time over at Class Central - ever since free online courses rose to prominence. It's been 8 years since I founded Class Central, and have helped more than 20 million learners decide which online courses to take.
Methodology: How we determined the Top 100 Free Courses of 2019
In the first step, we went through Class Central’s database and made a list of all the courses that were offered for the first time ever in 2019. We found that 450 universities around the world have now launched more than 2,500 courses.
Then Suparn wrote scrapers to collect enrollment numbers for three different course providers: Coursera, edX, and Swayam. Each of these providers show how many students are enrolled on their course pages. These three providers alone registered around 5 million enrollments for courses launched in 2019.
Along with this, we also explored data from our users. Most importantly: how many times a course has been bookmarked on Class Central.
Using the provider's enrollment data and our own bookmarks data, we came up with a list of 100 most popular courses of 2019 - a wide assortment from 68 universities.
You can also find this list on Class Central which I built using Class Central’s Custom List feature. Not all the courses on this list might be available, but if you bookmark a course on Class Central, then we will let you know when it is offered next.
And now... 2019's Most Popular Online Courses
Here are the most popular free online university courses of 2019 (not ordered by popularity).
Understanding Multiple Sclerosis (MS) from University of Tasmania ★★★★★(246)
Differential Equations for Engineers from The Hong Kong University of Science and Technology ★★★★★(32)
Teaching English: How to Plan a Great Lesson from British Council ★★★★★(125)
Understanding IELTS: Speaking from British Council ★★★★★(26)
The Art of Structural Engineering: Vaults from Princeton University ★★★★★(17)
Improving Your Study Techniques from University of Groningen ★★★★★(20)
Mathematical Economics from Doon University, Dehradun ★★★★★(75)
Constitutional Interpretation from Princeton University ★★★★★(16)
Happier Employees and Return-On-Investment Course from The University of Texas at Austin ★★★★★(10)
Gender and Sexuality: Applications in Society from The University of British Columbia ★★★★★(48)
The IB Extended Essay: Managing your Research Project from University of Leeds ★★★★★(32)
Agile Leadership Principles from University System of Maryland ★★★★★(124)
ANIMATIONs from Banaras Hindu University ★★★★☆(61)
Python and Statistics for Financial Analysis from The Hong Kong University of Science and Technology ★★★★☆(58)
Unlocking Information Security: Part Ⅰ from Tel Aviv University ★★★★★(2)
Digital Security and Human Rights from Amnesty International ★★★★★(1)
Fundamentals of Statistics from Massachusetts Institute of Technology ★★★★★(1)
Herbal Medicine from University of Minnesota ★★★★★(1)
Ideas for a Better World: Leading Change Through Policymaking from British Council ★★★★★(1)
Ethical Hacking from Indian Institute of Technology, Kharagpur ★★★★★(1)
Data Analysis: A Practical Introduction for Absolute Beginners from Microsoft ★★★★☆(1)
The Tudors from University of Roehampton ★★★★☆(1)
C for Everyone: Programming Fundamentals from University of California, Santa Cruz ★★★★☆(1)
Hacking Exercise For Health. The surprising new science of fitness. from McMaster University ★★★★☆(2)
Python for Data Science and AI from IBM ★★★☆☆(1)
Critical thinking: reasoned decision making from Tecnológico de Monterrey ★★☆☆☆(1)
Brand Identity and Strategy from IE Business School
Weight Management: Beyond Balancing Calories from Emory University
Introduction to Artificial Intelligence (AI) from IBM
Introduction to TensorFlow for Artificial Intelligence, Machine Learning, and Deep Learning from deeplearning.ai
Applying Data Analytics in Marketing from University of Illinois at Urbana-Champaign
Getting Started with AWS Machine Learning from Amazon Web Services
The Language of Design: Form and Meaning from California Institute of the Arts
Developing a Systems Mindset from University of Colorado Boulder
Introduction to Android graphics from Imperial College London
The Neuromarketing Toolbox from Copenhagen Business School
Empowering Yourself in a Post-Truth World from State University of New York
Introduction to Self-Determination Theory: An approach to motivation, development and wellness from University of Rochester
Counseling Practice and Research from Seoul National University
China’s Political and Intellectual Foundations: From Sage Kings to Confucius from Harvard University
Blockchain and FinTech: Basics, Applications, and Limitations from The University of Hong Kong
[email protected]: Basic Job Interview Skills from Hong Kong Polytechnic University
Child Protection: Children’s Rights in Theory and Practice from Harvard University
Freedom of Expression and Information in the Time of Globalization: Foundational Course from Columbia University
CS50 for Lawyers from Harvard University
Women Making History: Ten Objects, Many Stories from Harvard University
Advanced Android with Kotlin from Google
The New World of Arnold Schönberg’s Piano Music from Stanford University
Exploring GraphQL: A Query Language for APIs from Linux Foundation
Rhetoric: The Art of Persuasive Writing and Public Speaking from Harvard University
The Future of Work: Preparing for Disruption from The World Bank
Research and Development in Discrete Industries
Backyard Meteorology: The Science of Weather from Harvard University
Academic writing for clarity and meaning from University of the Witwatersrand
The Health Effects of Climate Change from Harvard University
Mindfulness and Resilience to Stress at Work from University of California, Berkeley
Machine Learning with Python: from Linear Models to Deep Learning from Massachusetts Institute of Technology
Inclusive Education: Essential Knowledge for Success from Queensland University of Technology
Data Analysis for Decision Making from University System of Maryland
Introduction to Encryption and Cryptography from Raspberry Pi Foundation
Introduction to Self-Driving Cars from University of Toronto
Cannabis, Mental Health, and Brain Disorders from University of Colorado Boulder
Managing ADHD, Autism, Learning Disabilities, and Concussion in School from University of Colorado System
Applying Data Analytics in Finance from University of Illinois at Urbana-Champaign
Introduction to Applied Machine Learning from Alberta Machine Intelligence Institute
Introduction to Climate Change and Health from Yale University
Python and Machine Learning for Asset Management from EDHEC Business School
Negotiation skills: Negotiate and resolve conflict from Macquarie University
Foundational Skills for Communicating About Health from University of Michigan
Hypothesis-Driven Development from University of Virginia
Exploring Renewable Energy Schemes from University of Pennsylvania
Improving Your Statistical Questions from Eindhoven University of Technology
Exploratory Data Analysis with MATLAB from MathWorks
Machine Learning from The University of Texas at Austin
Personal growth basics (for people with limited health abilities) from Ural Federal University
Financial Development and Financial Inclusion from International Monetary Fund
Steps in Japanese for Beginners1 Part1 from Waseda University
GMBA824 Know your customers from Macquarie University
Nutrition: Eating to Live Well from Tapei Medical University
Food and Mood: Improving Mental Health Through Diet and Nutrition from Deakin University
An Introduction to Programming through C++ from Indian Institute of Technology Bombay
Artificial Intelligence Search Methods For Problem Solving from Indian Institute of Technology Madras
Programming in Java from Indian Institute of Technology, Kharagpur
Joy of computing using Python from Indian Institute of Technology, Ropar
Introduction to Machine Learning (IITM) from Indian Institute of Technology Madras
Programming, Data Structures And Algorithms Using Python from Chennai Mathematical Institute
Python for Data Science from Indian Institute of Technology Madras
Developing Soft Skills and Personality from Indian Institute of Technology Kanpur
Caring for Children Moving Alone: Protecting Unaccompanied and Separated Children from University of Strathclyde
Managing People: Understanding Individual Differences from University of Reading
Digital Transformation in the Classroom from Norwegian University of Science and Technology
From data base to big data from Université Côte d’Azur
Diplomacy in the 21st Century from The Open University
Understanding Gender Inequality from University of Exeter
Successful Negotiation: Essential Strategies and Skills from University of Michigan
Science Communication and Public Engagement from EIT Food
English Pronunciation in a Global World from University of Amsterdam
America’s Opioid Epidemic: From Evidence to Impact from Johns Hopkins University
Understanding ADHD: Current Research and Practice from King’s College London
End of Life Care: Challenges and Innovation from University of Glasgow
via freeCodeCamp.org https://ift.tt/2LY9YRd
1 note
·
View note
Photo


August 15, 2017 Second day of laboratory in signals. We talked about discrete time signal. We also used the “Matlab” to do some program. Well, its my first time using this app. Before we start, we picked our respective computer and my computer did not turn on, so my classmate and I shared the computer and we help each other in program. Its been a great day!! 😄😄😄
2 notes
·
View notes
Text
Unlock Your Success in Linear System Modeling with Expert MATLAB Assignment Help
Are you struggling with your linear system modeling assignment? Wondering "can I get someone to do my linear system modeling assignment?" Look no further! At matlabassignmentexperts.com, we understand the challenges students face when it comes to completing assignments on time and with precision. That's why we're here to offer comprehensive assistance tailored to your needs.
1. Service Reliability: Our track record speaks for itself. With a team of dedicated professionals, we guarantee reliable service, ensuring that your assignments are delivered promptly without compromising on quality.

2. Expertise in Specific Subject Areas: When it comes to MATLAB assignments, expertise is paramount. Our team comprises specialists in various fields, ensuring that you receive assistance from experts who understand the intricacies of linear system modeling.
3. Affordable Pricing: We understand that budget constraints are a reality for students. That's why we offer competitive pricing without compromising on the quality of our services. With us, you can access top-notch assistance at prices that won't break the bank.
4. 24/7 Availability: Whether it's midnight or early morning, our team is here to assist you round the clock. We understand the urgency of assignments and strive to provide support whenever you need it.
5. Plagiarism-Free Work: Your academic integrity is important to us. Rest assured, all our assignments are crafted from scratch, guaranteeing originality and freedom from plagiarism. Your work will be uniquely tailored to meet your requirements.
6. Confidentiality: We prioritize your privacy and ensure that your personal information remains confidential. You can trust us to handle your assignments with the utmost discretion.
7. Revisions Policy: We believe in delivering perfection. If you're not satisfied with the initial draft, we offer a transparent revisions policy, allowing you to request modifications until you're fully content with the result.
8. Customer Support: Have questions or concerns? Our friendly customer support team is here to assist you every step of the way. Feel free to reach out to us with any queries, and we'll ensure prompt and helpful assistance.
Don't let your linear system modeling assignment stress you out. Trust matlabassignmentexperts.com to provide you with the expert assistance you need to excel academically. Contact us today and unlock your path to academic success!
0 notes
Text
Week 2
August 15, 2017
Today, we are taught of some of the things that we can do on Matlab. I brought my laptop since I have already installed there the application. When logging in on my account, I encountered a problem on typing in my password because some of the letters in the keyboard do not work. So I somehow panicked and asked for help. And the good thing here is that there is an onscreen keyboard that can be used in this type of emergency. It is not that quick to use like a real keyboard but I still thank God there are solutions to every problem.
So my classmates and I opened the Matlab application on our computers as told by our instructor. Sir Arboleda showed us the Matlab lecture projected on the board. He introduced to us the command codes that we can type on the command window such as plot, stem and grid on. Plot (n, x) is used to plot the given points of n and x like a line graph. Stem (n, x) plots the function through separate vertical lines with circle as a default tip which shows that the function is discrete or not continuous. The graph shown can be modified by changing the colors of the lines and changing the shapes of the tip through the command stem (n, x, ‘r+’). We can also customize the graph by giving title using the Title () command and put labels for x an y using xlabel('n') and ylabel('n'). To show accuracy of the plotted points, the command grid on can be used. Sir Arboleda let us type the codes projected on the screen so we can see the results and explore the use of commands by letting other values, colors or shapes on the graph.
We also learned how to create M-Files using the M-File editor and save it on a current folder. Furthermore, we are also taught about the types of sequences: unit sample sequence, unit step sequence, and unit ramp sequence; and the even and odd functions. Unit means one, so the unit sample pertains to a function that shows one sample of a value. Unit step sequence shows a series of values which depends on the limits given. On the other hand, unit ramp signal is a signal that increases as n increases. From the term itself “ramp”, it shows a series of separate values but in the form of increasing slope. There are two different methods on how to make the given type of signals: through the M-file method, where obviously it uses M-file to make codes; and the direct method with only uses the command window with a different set of codes. We practiced executing the different methods of the various types of signals by copying the codes given in front of us. We are given a time to change and try other values for another results so we can be trained on doing our own codes and get used to it for the purpose of learning Matlab well.
About quarter to 10 in the morning, we are given a drill problem which will be our practical exam for the day. When we are already working on it, Sir Arboleda realized that we only have few minutes left in the class so he told us to do the exam on our homes. He then proceeded on discussing the remaining lesson for the day which is about even and odd functions. Before we end our class, he gave us an assignment in which we will go the library, find a Digital Signal Processing book and solve the exercises given using the M-file method and the direct method through the Matlab.
1 note
·
View note