#MatplotLib
Explore tagged Tumblr posts
Visit Tumblr Blog
Explore Tumblr blogs with no restrictions, modern design and the best experience.
Last Seen Tumblr Blogs


Fun Fact
In 2020, 27% of US Tumblr users had an annual household income of over $100,000.
Text
Making a Digital Visual Timeline (in Python)
I have been on the hunt for a digital timeline I could easily use to store pivotal dates on and see the distance between them, as well as keep track of which events are in which story. And ultimately, I couldn't find a single website that satisfied me, so I made my own program. And swag bitches don't gatekeep, so I'm sharing how I made my timeline, in case anyone is running into the same struggles.
All you need to get started is any sort of program where you can write in Python (I use Thonny but anything that runs Python 3.10 works), and then import the Matplotlib library. If you use Thonny, this video tutorial is super short and straightforward. If you use something else, no doubt there are other video tutorials on how to import libraries on your given platform.
Then, copy in this code, making sure not to miss any indents or capitalization. I wanted to copy-paste the code directly into the text, but Tumblr doesn't register indents, so you have to copy from an image, sorry.
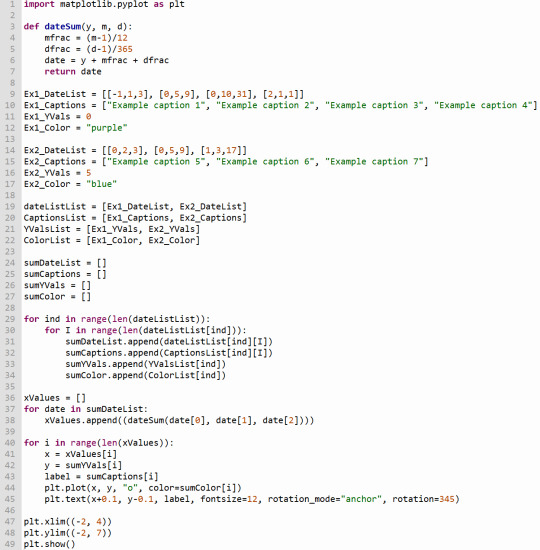
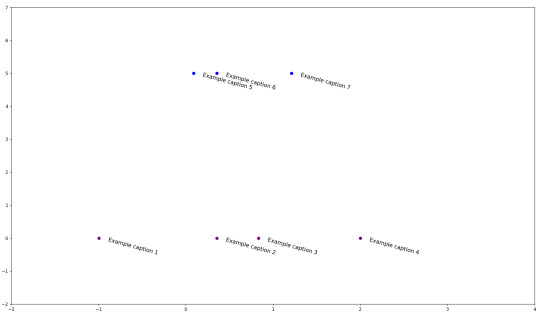
If you run this code as is, you should get this scatterplot.
Under the cut is further explanation of the parts you can and should change in order to make the timeline your own.
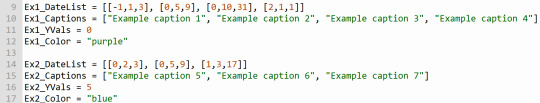
The Dates in the square brackets [] on lines 9 and 14 are formatted as Year/Month/Day. So if I wanted to make a point on September 2, 2009, I'd write it as [2009, 9, 2]. Each date must be enclosed in its own square bracket and separated by a comma.
The captions on lines 10 and 15 can be whatever you want, just keep them in quotations, and keep each quote separated by a comma. I like writing the date on the caption as well just for ease of reading.
Importantly, the number of Dates in any group's DateList line has to be equal to the number of Captions in the Captions line, but there can be a different number of Dates and Captions between groups. (So like, Ex1's DateList and Captions both have 4 items, but Ex2's DateList and Captions both have 3 instead.)
The YVals on lines 11 and 16 can be any number (though keeping the numbers relatively low, like from -5 to 5, is better). These just determine how high or low the dots appear on the timeline, if you want to keep different plots visually separate.
There is a LOT of freedom of choice for colors (lines 12 and 17) in Matplotlib. I recommend using the CSS colors, because you just have to write the name in quotations.
You can make more than 2 groups, and you can change the names of the groups. But if you do, you have to also adjust this part of the code below:
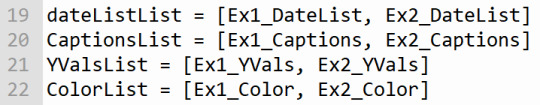
Whatever you name your Ex1 and Ex2 lists, put them into here. Additionally, you have to keep the lists consistent. If for example, dateListList was [Ex1_DateList, Ex2_DateList] and CaptionsList was [Ex2_Captions, Ex1_Captions], the code will either encounter an error or graph the wrong captions to the wrong dates.
Lastly, you can edit what parts of the graph appears using these 2 lines to control the X-axis and Y-axis of the plots respectively. You have to keep both pairs of parentheses for each line.
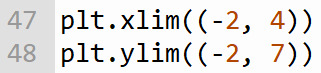
These numbers are relatively small because I chose small numbers as the example Dates. When I use this code for myself, I often switch between a view of (1950, 2050) to see roughly everything in the modern era, or (400, 2400) if I want to see some of the older historical events I've included as well.
These are just the parameters you HAVE to adjust to actually control your own timeline. You can ABSOLUTELY do more if you want to (just make sure to save backups :P). And if you have any questions, feel free to ask!
Happy timelineing!
#leah speaks :3#writblr#writerblr#timeline#timeline maker#writing resources#coding#compsci#python#matplotlib#i normally don't do heavy tags like this but SWAG BITCHES DON'T GATEKEEP! I wanna share this so nobody else has to struggle like I did!
10 notes
·
View notes
Text
I wish my Python code would make a "ding!" sound when it's done rendering. I want to be able to return to a machine learning model the same way that a housewife would return to the oven. I need an egg timer for when the computer is done thinking.
8 notes
·
View notes
Text
plotting
plot random mundane stuff its fun
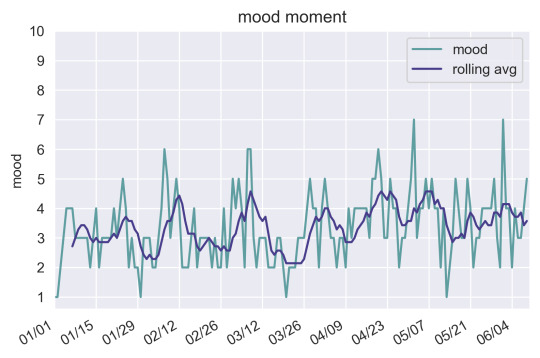
heres a plot of my mood rated 1-10 over time for the past half a year (rolling average with a window of 7 days)
always good to practice processing data and visualizing it
105 notes
·
View notes
Text

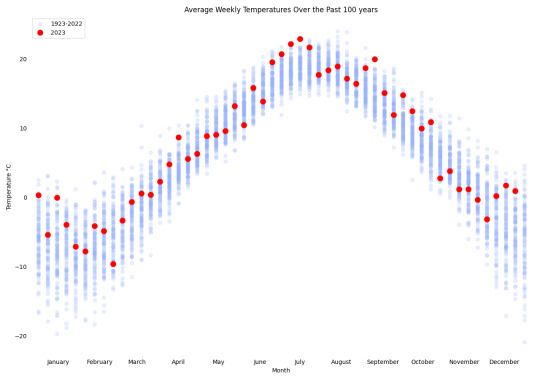

I've been thinking about climate data again. We have records here going back over 100 years. I thought I'd see how this past year compared to the previous 100. Interesting to see the different grouping intervals.
22 notes
·
View notes
Text
Python for Data Science: From Beginner to Expert – A Complete Guide!
Python has become the go-to language for data science, thanks to its flexibility, powerful libraries, and strong community support. In this video, we’ll explore why Python is the best choice for data scientists and how you can master it—from setting up your environment to advanced machine learning techniques.
🔹 What You'll Learn:
✅ Why Python is essential for data science
✅ Setting up Python and key libraries (NumPy, Pandas, Matplotlib) ✅ Data wrangling, visualization, and transformation
✅ Building machine learning models with Scikit-learn
✅ Best practices to enhance your data science workflow 🚀 Whether you're a beginner or looking to refine your skills, this guide will help you level up in data science with Python. 📌 Don’t forget to like, subscribe, and hit the notification bell for more data science and Python content!
youtube
#python#datascience#machinelearning#ai#bigdata#deeplearning#technology#programming#coding#developer#pythonprogramming#pandas#numpy#matplotlib#datavisualization#ml#analytics#automation#artificialintelligence#datascientist#dataanalytics#Youtube
3 notes
·
View notes
Text

Guys,
Does it look like a t-shirt pattern?
1 note
·
View note
Text

youtube
What is the Gray Scott model of reaction-diffusion?
The Gray-Scott system is a reaction-diffusion system. This means that it models a process that consists of a reaction and diffusion. In the case of the Gray-Scott model that reaction is a chemical reaction between two substances and , both of which diffuse over time. During the reaction gets used up, while is produced.
#Mathematics#bacteria#structures#the Gray-Scott reaction-diffusion model#Gray-Scott reaction-diffusion model#python#matplotlib#mlx#Gray Scott#Reaction Diffusion#maze#illusion#Research#Youtube
0 notes
Text
Jupyter Noteboook - xkcd font not found error & matplotlib.font_manager.__rebuild()
For anyone searching for these jupyter notebook errors as of Dec 8, 2024, for the: — infamous xkcd font not found and for the __rebuild() font cache errors: from matplotlib import font_manager — to rebuild font cache matplotlib.font_manager.__rebuild() which no longer works. Found this solution to rebuild the font cache…: import…
#addfont#Jupyter Notebook#matplotlib#matplotlib.font_manager.__rebuild()#plt rcparams#Xkcd font not found
0 notes
Text

taught myself to solve coupled differential equations with an actual library instead of hand writing the numerical methods like I had to do in my computational physics class last semester
#ramblings#lorenz attractor#lorenz#physics#computational physics#python#matplotlib#differential equations
0 notes
Text

📊 Elevate your data visualization game with Matplotlib! Create beautiful, customizable plots in Python and transform your data into insights.
Perfect for both beginners and pros! 🚀📈 Ready to bring your data to life? 🎨💡
Check the link below for more information: https://bit.ly/3G6cmnO
0 notes
Text

Python data science libraries like NumPy, Pandas, and Matplotlib facilitate data manipulation, analysis, and visualization for effective insights and decision-making.
1 note
·
View note
Text


0 notes
Text
spiking neural networks
writing up some code in rust and python to replicate basic eeg activity using spiking neural networks

it uses a lattice of leaky integrate and fire models to act as biological neurons
unlike a classical neural network, this system has a sense of time
on the right you can see the voltage of the membrane potential of each neuron change over time
on the left you can see the concentration of signaling neurotransmitters in each neuronal synapse that contribute to how the membrane potential changes over time
extremely basic modeling but it looks neat
(neuronal calcuations done in rust, visualization in python and matplotlib)
29 notes
·
View notes
Text

I was wondering about shutter speed and aperture combinations for my 4 lenses.
7 notes
·
View notes
Video
youtube
Top competitors of powerbi #datavisualization #dashboard #datanalytics #...
0 notes
Text
Best way to learn data analysis with python
The best way to learn data analysis with Python is to start with the basics and gradually build up your skills through practice and projects. Begin by learning the fundamentals of Python programming, which you can do through online courses, tutorials, or books. Once you are comfortable with the basics, focus on learning key data analysis libraries such as Pandas for data manipulation, NumPy for numerical operations, and Matplotlib or Seaborn for data visualization.
After you grasp the basics, apply your knowledge by working on real datasets. Platforms like Kaggle offer numerous datasets and competitions that can help you practice and improve your skills. Additionally, taking specialized data analysis courses online can provide structured learning and deeper insights. Consistently practicing, participating in communities like Stack Overflow or Reddit for support, and staying updated with the latest tools and techniques will help you become proficient in data analysis with Python.
#Dataanalysis#Pythonprogramming#Learnpython#Datascience#Pandas#NumPy#Datavisualization#Matplotlib#Seaborn#Kaggle#Pythoncourses#CodingforBeginners#DataPreparation#StatisticsWithPython#JupyterNotebooks#VSCode#OnlineLearning#TechSkills#ProgrammingTutorials#DataScienceCommunity
0 notes