#RadarChart
Explore tagged Tumblr posts
Text

Types of Charts & Graphs
Understanding the right type of chart can help you tell a better story with data.
🔹 Bar Chart – Compare categories easily 🔹 Line Chart – Track changes over time 🔹 Pie Chart – Visualize parts of a whole 🔹 Radar Chart – Compare multiple variables
🎓 Learn how to visualize data like a pro! ✅ Why Choose Us?
✔️ 100% practical training
✔️ Real-time projects & case studies
✔️ Expert mentors with industry experience
✔️ Certification & job assistance
✔️ Easy-to-understand Telugu + English mix classes
📍 Institute Address:
3rd Floor, Dr. Atmaram Estates, Metro Pillar No. A690, Beside Siri Pearls & Jewellery, near JNTU Metro Station, Hyder Nagar, Vasantha Nagar, Hyderabad, Telangana – 500072 📞 Contact: +91 9948801222 📧 Email: [email protected] 🌐 Website: https://dataanalyticsmasters.in
#DataVisualization#DataAnalytics#BarChart#LineChart#PieChart#RadarChart#ChartTypes#DataScienceTraining#AnalyticsCourse#LearnDataAnalytics#VisualizeData#DataDriven#DataAnalyticsMasters#BusinessIntelligence#UpskillWithAnalytics
0 notes
Text
(Just a heads up, this is a rather long post.)
The lower half of Kabru’s character page! It reads:
Profile:
Name: Unknown
Age: 22
Race / Sex: Tall-man / Male
Birthplace: The Western Continent, Utaya
Relatives: Foster mother (Milsiril)
Build: 5’7” (170 cm) / BMI 21
Likes: Tomatoes
Dislikes: Monsters, elf cakes
Radar Chart:
If narrowed specifically to combat against humans, his fighting skills are formidable. He lacks experience as an adventurer but compensates with his innate observational skills.
Observation: 5
Stamina: 5
Strength: 4
Magic: 3
Intelligence: 4

I added some extra context, but under the cut so that this post wouldn’t get too long. I usually try to keep my posts rather neutral, although I do clearly favor Kabru, but I couldn’t help but get carried away here!
Name: Even though he’s called Kabru, his mother had originally given him a different name. There are a few reasons as to why Kabru could have a different name from his birth name, but the exact reason is unknown. Since his original name is unknown, his name is marked as unknown here.
Age: Kabru was born on May 28th, 492. Since the story takes place from March to April of the year 514, Kabru would actually be 21 during the main storyline instead of 22.
Birthplace: Kabru’s mom fled to Utaya after Kabru was born, so Utaya likely wasn’t his birthplace. Perhaps this section was supposed to translate to hometown?
Build: Kabru is shorter than average for Tall-man males, but he’s exactly the average height of Tall-man females. BMI isn’t a very accurate measurement, but according to it, Kabru falls under the healthy category. Since Kabru is 170 cm and his BMI is 21, he weighs roughly 61 kilos/135 pounds.
Likes/Dislikes: These two sections specifically refer to food preferences, so Kabru’s favorite food is tomatoes and his least favorite foods are monsters and elf cakes. Kabru makes his dislike of monsters and elf cakes clear on several occasions, but this is the only time tomatoes are referenced.
Magic: Despite never being shown using magic anywhere, Kabru is said to have some basic magical abilities in several pieces of extra content.
20 January 2025. 20/1/25 or 1/20/25
Source: Adventurer’s Bible
Section: Character Page
Subsection: Profile + Radar Chart
Short: AB-CharacterPage-Profile&RadarChart
#daily kabru#kabru#kabru delicious in dungeon#kabru dungeon meshi#kabru dunmeshi#kabru of utaya#delicious in dungeon#dungeon meshi#long post
23 notes
·
View notes
Text
Radar charts
A complete guide How to create and when to create a Radar charts in MS excel
#excel #microsoft #charts #radarcharts #MS365 #excelcharts #microsoft365
Click here to learn more...
https://excelinexcel.in/ms-excel/articles/radar-charts-in-excel/
1 note
·
View note
Text
Radar charts
A complete guide How to create and when to create a Radar charts in MS excel
#excel #microsoft #charts #radarcharts #MS365 #excelcharts #microsoft365
Click here to learn more...
https://excelinexcel.in/ms-excel/articles/radar-charts-in-excel/
1 note
·
View note
Text
Radar charts
A complete guide How to create and when to create a Radar charts in MS excel
#excel #microsoft #charts #radarcharts #MS365 #excelcharts #microsoft365
Click here to learn more...
https://excelinexcel.in/ms-excel/articles/radar-charts-in-excel/
1 note
·
View note
Text
Create a Radar charts
A complete guide How to create and when to create a Radar charts in MS excel
#excel #microsoft #charts #radarcharts #MS365 #excelcharts #microsoft365#
Click here to learn more...
https://excelinexcel.in/ms-excel/articles/radar-charts-in-excel/
1 note
·
View note
Link
Radar Chart (Uses, Examples ) | How to Create Spider Chart in Excel?
0 notes
Photo

Collecting data for my #startrek #nextgen #dutyroster. It will be different from the #startrektos poster concentrating on the main characters only. This change is due to the sheer volume of data from seven seasons and confined space on the poster. Here are two possible charts for Commander Data's positions during the first season. Pardon, but the legend resides off the active art board for now. Six more seasons to go and construction of graph next year. Looking at a completion date to be ready for 2018 con season. #startreknextgeneration #ussenterprise #ussenterprisencc1701 #adobeillustrator #dataviz #datachart #datavisualization #datacollection #radarchart
#datavisualization#startreknextgeneration#dataviz#startrektos#ussenterprise#nextgen#datachart#startrek#ussenterprisencc1701#radarchart#adobeillustrator#datacollection#dutyroster
0 notes
Photo

#radarchart of #architectural #personalities (at La Taqueria)
0 notes
Text
PETG Quick Start Guide
Everything you need to know to begin printing in PETG
.quickheader { text-align:left !important; } #materialbutton { border:1px solid Black; padding:2px 5px; background-color: none; color: Black; border-radius:10px; } #materialbutton:hover { border:1px solid Black; padding:2px 5px; background-color: black; color: white; border-radius:10px; } .full-width { width: 100vw; margin: 0rem -50vw; position: relative; left: 50%; right: 50%; background-size: cover !important; -webkit-background-size: cover; -moz-background-size: cover; -o-background-size: cover; background-position: center !important; background-repeat: no-repeat; z-index: 99; } .image-banner { height: auto; display: -webkit-box; display: -ms-flexbox; display: flex; -webkit-box-orient: vertical; -webkit-box-direction: normal; -ms-flex-direction: column; flex-direction: column; -webkit-box-pack: center; -ms-flex-pack: center; justify-content: center; -webkit-box-align: center; -ms-flex-align: center; align-items: center; padding-top: 10vh; /* CHANGE NUMBER TO ADJUST HEIGHT */ padding-bottom: 10vh; /* CHANGE NUMBER TO ADJUST HEIGHT */ }
PETG
PETG is great for mechanical applications due to its amazing layer adhesion, low warping and high impact-resistance. As an added bonus, PETG is both chemically resistant to salts, acids, alkalis, solvents, greases, oils and can be sterilised.
Chemical Resistant Water Resistant Rigid
var SPCOCanvas = document.getElementById("SPCOChart"); var SPCOData = { labels: [ "Hardness", "Tensile Strength", "Ductility", "UV Stability", "Heat Resistance", "Ease of Printing" ], datasets: [ { label: "PETG", backgroundColor: "rgba(0,133,202,0.3)", borderColor: "rgba(0,133,202.6)", fill: true, radius: 1, pointRadius: 1, pointBorderWidth: 1, pointBackgroundColor: "rgba(0,133,202,0.6)", pointBorderColor: "rgba(0,133,202,0.6)", pointHoverRadius: 10, data: [3, 1, 1, 3, 3, 5] } ] }; var chartOptions = { maintainAspectRatio: true, responsive: true, legend: { display: false, }, scale: { ticks: { display: false, showLabelBackdrop: false, beginAtZero: true, min: 0, max: 5, stepSize: 1 }, pointLabels: { fontSize: 10, family:"cabin" } } }; var radarChart = new Chart(SPCOCanvas, { type: "radar", data: SPCOData, options: chartOptions });
#quickbuybutton { background-color: #000000; color: #FFFFFF; padding: 13px 30px; } #quickbuybutton:hover { background-color: #FFFFFF; color: #000000; padding: 13px 30px; } #quicktbuttoncontainter { vertical-align: middle; }
Quick Start Guide:
PETG Filament
Pros Cons
Hardware Requirements
Printing Settings
Best Practices
Pro Tips
Applications
Next: PETG Ultimate Printing Guide
Buy
Next
Overview
PETG is a Glycol Modified version of Polyethylene Terephthalate (PET), which is commonly used to manufacture plastic drink bottles. This semi-rigid material is highly impact and chemically resistant, but its surface is slightly softer than other materials. PETG benefits from great thermal properties, allowing it to cool efficiently with almost negligible warpage making it great for tough parts when 3D printing with a setup without an enclosure.
The mechanical and visual properties of PETG make it a highly useful material. As opposed to beginner-friendly materials such as PLA and PLA+, PETG prints best within a tighter tolerance range of settings, making it slightly less forgiving. For more information on what PETG is and what it’s good for, check out our Introduction to PETG.
h1 { text-align: center; } #quickstartpro { background-color: whitesmoke; text-align: left; vertical-align:middle; padding: 10px 0px; }
Pros
Cons
✔️ Great chemical and weather resistance ❌ Can produce parts with fine stringing on the part surface ✔️ Sticks well to the bed with negligible warping ✔️ Odorless while printing
Hardware Requirements
#notrequired { opacity: 1; } #headerrow { border-bottom:1px solid rgba(0,0,0,0.2); } #hardwaretable { padding: 10px 0px; }
Enclosure
Heated Bed
Hardened Nozzle
Fan



✔️
✔️✔️
✖️
✔️✔️
Fume Extraction
Direct Drive Extruder
High Temp Extruder
Filament Drybox


✔️
✖️
✖️
✔️
#disclaimer { background-color: whitesmoke; text-align: left; vertical-align:middle; padding: 30px 30px; font-weight: 200; }
The internet is filled with conflicting information regarding different settings. It’s critical to understand that printer settings from one printer may not necessarily translate to another printer. Your print settings may vary from what is shown below - but the fundamentals behind each suggestion remain the same. With PETG, one thing is certain: You’ll have to experiment to find the best parameters for your printer. This article aims to give you a good starting point.
Print Settings
Extruder Temperature
Bed Temperature
Fan Speed
#tooltipcarrier { text-align: middle; } #tooltipcarrier td { vertical-align: top; } .tooltipinfosymbol { color: rgba(0,0,0,0.5) } /*Left*/ .lefttooltip { position: relative; display: inline-block; border-bottom: solid 0.1px rgba(232,232,232,0.9); cursor: help; } .lefttooltip .lefttooltiptext { visibility: hidden; width: 300px; background-color: black; color: #fff; text-align: left; border-radius: 6px; padding: 0px 5px; position: absolute; z-index: 1; bottom: 125%; left: 0%; margin-left: -25px; /* Fade in tooltip - takes 1 second to go from 0% to 100% opacity: */ opacity: 0; transition: opacity 1s; } .lefttooltip:hover .lefttooltiptext { visibility: visible; opacity: 1; } /*Mid Tip*/ .tooltip { position: relative; display: inline-block; border-bottom: solid 0.1px rgba(232,232,232,1); cursor: help; } .tooltip .tooltiptext { visibility: hidden; width: 300px; background-color: black; color: #fff; text-align: left; border-radius: 6px; padding: 0px 5px; position: absolute; z-index: 1; bottom: 125%; left: 50%; margin-left: -150px; /* Fade in tooltip - takes 1 second to go from 0% to 100% opacity: */ opacity: 0; transition: opacity 1s; } .tooltip:hover .tooltiptext { visibility: visible; opacity: 1; } /*Right*/ .righttooltip { position: relative; display: inline-block; border-bottom: solid 0.1px rgba(232,232,232,1); cursor: help; } .righttooltip .righttooltiptext { visibility: hidden; width: 300px; background-color: black; color: #fff; text-align: left; border-radius: 6px; padding: 0px 5px; position: absolute; z-index: 1; bottom: 125%; left: 100%; margin-left: -300px; /* Fade in tooltip - takes 1 second to go from 0% to 100% opacity: */ opacity: 0; transition: opacity 1s; } .righttooltip:hover .righttooltiptext { visibility: visible; opacity: 1; } .lefttooltiptext p { font-size: 12px; } .tooltiptext p { font-size: 12px; } .righttooltiptext p { font-size: 12px; }
-
↓ Extruder Temperature
↓ Stringing - Will decrease at temperatures <220°C as the molten filament will have a higher viscocity, leading to a neater print.
↓ Oozing - See above.
↑ Underextrusion - Can happen at temperatures of <220°C as your printer simply can't melt the filament fast enough to keep up with the filament feed rate.
Our tip: Before adjusting your extruder temperature any lower than <220°C, try adjusting your retraction, coasting and travel speed.
220°Cs
Set your extruder temperature to 220°C. Increase the printing temperature if you are experiencing underextrusion or if your extruder gear is slipping.
🛈
+
↑ Extruder Temperature
↑ Stringing - Increases at temperatures <240°C as the molten filament will have a lower viscocity, flowing more freely.
↑ Oozing - See above.
↓ Surface Resolution- At temperatures of <240°C leading to sloppy layers and an increase in artifacts like stringing and oozing.
#tooltipcarrier { text-align: middle; } #tooltipcarrier td { vertical-align: top; } .tooltipinfosymbol { color: rgba(0,0,0,0.5) } /*Left*/ .lefttooltip { position: relative; display: inline-block; border-bottom: solid 0.1px rgba(232,232,232,1); cursor: help; } .lefttooltip .lefttooltiptext { visibility: hidden; width: 300px; background-color: black; color: rgba(255,255,255,0.75); text-align: left; border-radius: 6px; padding: 0px 5px; position: absolute; z-index: 1; bottom: 125%; left: 0%; margin-left: -25px; /* Fade in tooltip - takes 1 second to go from 0% to 100% opacity: */ opacity: 0; transition: opacity 1s; } .lefttooltip:hover .lefttooltiptext { visibility: visible; opacity: 0.75; } /*Mid Tip*/ .tooltip { position: relative; display: inline-block; border-bottom: solid 0.1px rgba(232,232,232,0.75); cursor: help; } .tooltip .tooltiptext { visibility: hidden; width: 300px; background-color: black; color: #fff; text-align: left; border-radius: 6px; padding: 0px 5px; position: absolute; z-index: 1; bottom: 125%; left: 50%; margin-left: -150px; /* Fade in tooltip - takes 1 second to go from 0% to 100% opacity: */ opacity: 0; transition: opacity 1s; } .tooltip:hover .tooltiptext { visibility: visible; opacity: 1; } /*Right*/ .righttooltip { position: relative; display: inline-block; border-bottom: solid 0.1px rgba(232,232,232,0.75); cursor: help; } .righttooltip .righttooltiptext { visibility: hidden; width: 300px; background-color: black; color: #fff; text-align: left; border-radius: 6px; padding: 0px 5px; position: absolute; z-index: 1; bottom: 125%; left: 100%; margin-left: -300px; /* Fade in tooltip - takes 1 second to go from 0% to 100% opacity: */ opacity: 0; transition: opacity 1s; } .righttooltip:hover .righttooltiptext { visibility: visible; opacity: 1; } .lefttooltiptext p { font-size: 12px; } .tooltiptext p { font-size: 12px; } .righttooltiptext p { font-size: 12px; }
-
↓ Bed Temperature
↓ Part Adhesion - Too little heat in the bed will cause your part to cool to quickly, curl and dislodge from the bed.
70 - 80°Cs
Set your bed temperature to 80°C for your first layer to ensure your first layer sticks to the bed and 75°C for the rest of the print.
🛈
+
↑ Bed Temperature
↑ Part Deformation - Too much heat will cause your part to melt into the bed, deforming the bottom layers.
#tooltipcarrier { text-align: middle; } #tooltipcarrier td { vertical-align: top; } .tooltipinfosymbol { color: rgba(0,0,0,0.5) } /*Left*/ .lefttooltip { position: relative; display: inline-block; border-bottom: solid 0.1px rgba(232,232,232,1); cursor: help; } .lefttooltip .lefttooltiptext { visibility: hidden; width: 300px; background-color: black; color: #fff; text-align: left; border-radius: 6px; padding: 0px 5px; position: absolute; z-index: 1; bottom: 125%; left: 0%; margin-left: -25px; /* Fade in tooltip - takes 1 second to go from 0% to 100% opacity: */ opacity: 0; transition: opacity 1s; } .lefttooltip:hover .lefttooltiptext { visibility: visible; opacity: 1; } /*Mid Tip*/ .tooltip { position: relative; display: inline-block; border-bottom: solid 0.1px rgba(232,232,232,1); cursor: help; } .tooltip .tooltiptext { visibility: hidden; width: 300px; background-color: black; color: #fff; text-align: left; border-radius: 6px; padding: 0px 5px; position: absolute; z-index: 1; bottom: 125%; left: 50%; margin-left: -150px; /* Fade in tooltip - takes 1 second to go from 0% to 100% opacity: */ opacity: 0; transition: opacity 1s; } .tooltip:hover .tooltiptext { visibility: visible; opacity: 1; } /*Right*/ .righttooltip { position: relative; display: inline-block; border-bottom: solid 0.1px rgba(232,232,232,1); cursor: help; } .righttooltip .righttooltiptext { visibility: hidden; width: 300px; background-color: black; color: #fff; text-align: left; border-radius: 6px; padding: 0px 5px; position: absolute; z-index: 1; bottom: 125%; left: 100%; margin-left: -300px; /* Fade in tooltip - takes 1 second to go from 0% to 100% opacity: */ opacity: 0; transition: opacity 1s; } .righttooltip:hover .righttooltiptext { visibility: visible; opacity: 1; } .lefttooltiptext p { font-size: 12px; } .tooltiptext p { font-size: 12px; } .righttooltiptext p { font-size: 12px; }
-
↓ Fan Speed
↑ Part Strength - Slows the cooling rate of each layer being printed. This gives the part more time to bond to the preceeding layer, resulting in increased interlayer adhesion and part strength. Helps remedy part delamination problems. PETG can be printed with fan speed set to 0%.
↓ Surface Resolution - Decreasing the fan speed will result in your PETG staying more molten for longer. This can result in sloppy layer lines and an increase in artifacts like stringing and burnt looking spots resulting from oozing.
50%
Start at 50% fan speed for a good balance between part strength and surface resolution
🛈
+
↑ Fan Speed
↓ Part Strength - Increases the cooling rate of each layer being printed. This gives the part less time to bond to the preceeding layer, resulting in less interlayer adhesion and a decrease in part strength. ↑ Surface Resolution - Increases layer cooling. Will result in crisp prints with neat and defined layer lines. Perfect if you are after a part that prioritises visual clarity over part strength. PETG can be printed with fan speed set to 100%.
Print Speed
Retraction Speed
Retraction Distance
#tooltipcarrier { text-align: middle; } #tooltipcarrier td { vertical-align: top; } .tooltipinfosymbol { color: rgba(0,0,0,0.5) } /*Left*/ .lefttooltip { position: relative; display: inline-block; border-bottom: solid 0.1px rgba(232,232,232,1); cursor: help; } .lefttooltip .lefttooltiptext { visibility: hidden; width: 300px; background-color: black; color: #fff; text-align: left; border-radius: 6px; padding: 0px 5px; position: absolute; z-index: 1; bottom: 125%; left: 0%; margin-left: -25px; /* Fade in tooltip - takes 1 second to go from 0% to 100% opacity: */ opacity: 0; transition: opacity 1s; } .lefttooltip:hover .lefttooltiptext { visibility: visible; opacity: 1; } /*Mid Tip*/ .tooltip { position: relative; display: inline-block; border-bottom: solid 0.1px rgba(232,232,232,1); cursor: help; } .tooltip .tooltiptext { visibility: hidden; width: 300px; background-color: black; color: #fff; text-align: left; border-radius: 6px; padding: 0px 5px; position: absolute; z-index: 1; bottom: 125%; left: 50%; margin-left: -150px; /* Fade in tooltip - takes 1 second to go from 0% to 100% opacity: */ opacity: 0; transition: opacity 1s; } .tooltip:hover .tooltiptext { visibility: visible; opacity: 1; } /*Right*/ .righttooltip { position: relative; display: inline-block; border-bottom: solid 0.1px rgba(232,232,232,1); cursor: help; } .righttooltip .righttooltiptext { visibility: hidden; width: 300px; background-color: black; color: #fff; text-align: left; border-radius: 6px; padding: 0px 5px; position: absolute; z-index: 1; bottom: 125%; left: 100%; margin-left: -300px; /* Fade in tooltip - takes 1 second to go from 0% to 100% opacity: */ opacity: 0; transition: opacity 1s; } .righttooltip:hover .righttooltiptext { visibility: visible; opacity: 1; } .lefttooltiptext p { font-size: 12px; } .tooltiptext p { font-size: 12px; } .righttooltiptext p { font-size: 12px; }
-
↓ Print Speed | ↑ Print Time
↑ Layer Adhesion - Gives your layers more time to bond, increasing interlayer adhesion.
↑ Part Deformation - Too much thermal energy may be pumped into your part, slowing down the cooling and resulting in sloppy layers
↓ Travel Speed | ↑ Print Time
↑ Stringing - More time spent travelling results in more molten material leaking out of the nozzle of your printer leading to more stringing ↑ Oozing - Results in more oozing from the nozzle. (see above)
30 - 50mm/s
Print Speed: Start at 50mm/s and only increase the print speed if you are comfortable with the print quality. Printing your first layer at 25mm/s will help keep your part stuck to the bed. Travel speed: Start at a minumum of 150mm/s but speeds of 300mm/s are preferable. Keep as high as your printer will allow. Dial back if you notice ringing occuring.
🛈
+
↑ Print Speed | ↓ Print Time
↓ Layer Adhesion - Gives your layers less time to bond, decreasing interlayer adhesion. Aim to keep print speeds under 60mm/s for best results.
↑ Extruder Skipping - Can occur when the printer can't melt and print filament fast enough
↑ Travel Speed | ↓ Print Time
↓ Stringing - Less time spent travelling results in less molten material leaking out of the nozzle of your printer decreasing stringing ↓ Oozing - Results in less oozing from the nozzle. (see above)
#tooltipcarrier { text-align: middle; } #tooltipcarrier td { vertical-align: top; } .tooltipinfosymbol { color: rgba(0,0,0,0.5) } /*Left*/ .lefttooltip { position: relative; display: inline-block; border-bottom: solid 0.1px rgba(232,232,232,1); cursor: help; } .lefttooltip .lefttooltiptext { visibility: hidden; width: 300px; background-color: black; color: #fff; text-align: left; border-radius: 6px; padding: 0px 5px; position: absolute; z-index: 1; bottom: 125%; left: 0%; margin-left: -25px; /* Fade in tooltip - takes 1 second to go from 0% to 100% opacity: */ opacity: 0; transition: opacity 1s; } .lefttooltip:hover .lefttooltiptext { visibility: visible; opacity: 1; } /*Mid Tip*/ .tooltip { position: relative; display: inline-block; border-bottom: solid 0.1px rgba(232,232,232,1); cursor: help; } .tooltip .tooltiptext { visibility: hidden; width: 300px; background-color: black; color: #fff; text-align: left; border-radius: 6px; padding: 0px 5px; position: absolute; z-index: 1; bottom: 125%; left: 50%; margin-left: -150px; /* Fade in tooltip - takes 1 second to go from 0% to 100% opacity: */ opacity: 0; transition: opacity 1s; } .tooltip:hover .tooltiptext { visibility: visible; opacity: 1; } /*Right*/ .righttooltip { position: relative; display: inline-block; border-bottom: solid 0.1px rgba(232,232,232,1); cursor: help; } .righttooltip .righttooltiptext { visibility: hidden; width: 300px; background-color: black; color: #fff; text-align: left; border-radius: 6px; padding: 0px 5px; position: absolute; z-index: 1; bottom: 125%; left: 100%; margin-left: -300px; /* Fade in tooltip - takes 1 second to go from 0% to 100% opacity: */ opacity: 0; transition: opacity 1s; } .righttooltip:hover .righttooltiptext { visibility: visible; opacity: 1; } .lefttooltiptext p { font-size: 12px; } .tooltiptext p { font-size: 12px; } .righttooltiptext p { font-size: 12px; }
-
↓ Retraction Distance
↑ Stringing -Shorter retraction distances causes a smaller a drop in the pressure inside the nozzle. With distances less than 3mm, it may not be enough to stop molten filament from leaking out of your nozzle.
↓ Oozing - See above.
3 - 6mm
For Bowden systems: Start with a retraction of 3mm. Increase retraction to 4mm if needed. This distance may be higher if you have a longer bowden tube.
For Direct Drive systems: Start with a retraction of 1mm. Increase retraction distance to 2mm if needed.
Our Tip: Tune retraction distance up/down by 0.5mm increments. Aim to keep the distance between the 0.5 - 6mm.
🛈
+
↑ Retraction Distance
↓ Stringing - Causes a larger a drop in the pressure inside the nozzle, stopping more filament from leaking out of your nozzle.
↓ Oozing - See above.
↑ Underextrusion - Excessive retraction can cause a delay before your nozzle resumes printing causing underextrusion.
Our tip: If your retraction distance is at the upper limit, try adjusting your retraction speed, coasting & travel speed.
#tooltipcarrier { text-align: middle; } #tooltipcarrier td { vertical-align: top; } .tooltipinfosymbol { color: rgba(0,0,0,0.5) } /*Left*/ .lefttooltip { position: relative; display: inline-block; border-bottom: solid 0.1px rgba(232,232,232,1); cursor: help; } .lefttooltip .lefttooltiptext { visibility: hidden; width: 300px; background-color: black; color: #fff; text-align: left; border-radius: 6px; padding: 0px 5px; position: absolute; z-index: 1; bottom: 125%; left: 0%; margin-left: -25px; /* Fade in tooltip - takes 1 second to go from 0% to 100% opacity: */ opacity: 0; transition: opacity 1s; } .lefttooltip:hover .lefttooltiptext { visibility: visible; opacity: 1; } /*Mid Tip*/ .tooltip { position: relative; display: inline-block; border-bottom: solid 0.1px rgba(232,232,232,1); cursor: help; } .tooltip .tooltiptext { visibility: hidden; width: 300px; background-color: black; color: #fff; text-align: left; border-radius: 6px; padding: 0px 5px; position: absolute; z-index: 1; bottom: 125%; left: 50%; margin-left: -150px; /* Fade in tooltip - takes 1 second to go from 0% to 100% opacity: */ opacity: 0; transition: opacity 1s; } .tooltip:hover .tooltiptext { visibility: visible; opacity: 1; } /*Right*/ .righttooltip { position: relative; display: inline-block; border-bottom: solid 0.1px rgba(232,232,232,1); cursor: help; } .righttooltip .righttooltiptext { visibility: hidden; width: 300px; background-color: black; color: #fff; text-align: left; border-radius: 6px; padding: 0px 5px; position: absolute; z-index: 1; bottom: 125%; left: 100%; margin-left: -300px; /* Fade in tooltip - takes 1 second to go from 0% to 100% opacity: */ opacity: 0; transition: opacity 1s; } .righttooltip:hover .righttooltiptext { visibility: visible; opacity: 1; } .lefttooltiptext p { font-size: 12px; } .tooltiptext p { font-size: 12px; } .righttooltiptext p { font-size: 12px; }
-
↓ Retraction Distance
↑ Stringing - Lower retraction speeds cause a smaller drop in the pressure inside the nozzle which may not be enough to stop filament from leaking out of your nozzle.
↑ Oozing - See above.
45mm/s
Start with a retraction speed of 45mm/s.
Our Tip: Increase retraction speed by 5mm/s increments until you notice diminishing in returns in stringing and oozing.
🛈
+
↑ Retraction Speed
↓ Stringing - Causes a larger a drop in the pressure inside the nozzle, stopping more filament from leaking out of your nozzle.
↓ Oozing - See above.
↑ Filament Slip - Excessivly high retraction speeds can cause the feed gears to slip, causing extrusion problems.
Our tip: If your retraction distance is at the upper limit, try adjusting your retraction speed, coasting & travel speed.
Not all 3D printers are built the same. This makes giving exact recommendations for settings difficult as settings for one printer may not necessarily carry over to others.
Consider the following settings a starting point to be fine tuned as you experiment. Don't be afraid to go above or below our suggested settings if they result in better quality prints.
Best Practices
In order to print PETG successfully, having the correct the hardware setup and temperature settings outlined above are only half the battle.
As opposed to printing in other materials, with PETG you will have to pay greater attention to the following settings when 3D printing in PETG:
Printing Temperature
Retraction
Coasting
Fan Speed
Print Speed
Here are some best practices to ensure reliable PETG prints.
+ Start with the lowest temperature
When printing in PETG, many problems related to print quality arise from printing too hot. Start printing PETG at the lowest temperature recommended by your manufacturer. By doing this you'll ensure you begin printing at the most optimal temperature.
We recommend printing at 220°C with our PETG.
+ Calibrate retraction settings to reduce stringing
PETG tends to become runny when it is brought up to printing temperature. As your extruder moves around, molten PETG can leak out of your printer's nozzle and end up on your 3D printed part. This results in fine hairs and strings building up on the outside surface of your PETG print.
This can be alleviated by calibrating your retraction settings.
We recommending starting with a retraction speed of 45mm/s and a retraction distance of between 3-6 mm for a Bowden setup or 1-2mm for a direct drive printer.
For more in-detailed tips check out our PETG Ultimate Printing Guide.
+ Enabling coasting settings to reduce blobs
When printing, PETG tends to continue extruding even after the printer has stopped extruding.
This leads to excess material commonly called zits and blobs that build up on your print, reducing print quality. Sometimes this material can even build up to an extent where it can cause a print to fail.
Enabling coasting tells your printer to stop extruding just before the end of a print layer. This ensures less material oozes out of the nozzle during the travel move that occurs immediately after the print move. Set your costing volume to the cubed value of your nozzle diameter and a volume before coasting of around double your nozzle diameter. (i.e. A coasting volume of 0.064mm³ and a 0.8mm³ volume before coasting for a 0.4mm diameter nozzle)
For more in-detailed tips check out our PETG Ultimate Printing Guide.
+ Increase travel move speed
PETG tends to continue oozing out of the nozzle between print moves.
Increasing the printer's travel speed between extrusion moves decreases the likelihood the nozzle spends depositing unwanted material on your print.
Increased Travel Speeds of 150mm/s and greater will ensure your printer's nozzle spends less time oozing between print moves.
For more in-detailed tips check out our PETG Ultimate Printing Guide.
+ Keep Your Filament Dry
PETG is hygroscopic material meaning it will absorb moisture from the surrounding air. This absorbed moisture in the filament is not a problem once the part has been printed but does present a problem during printing and can result in a 3D printed part with:
Weaker interlayer bonding
Stringing and fine hairs developing on the print
Poor surface resolution
As such, keep your filament stored in a dry environment with, like in an airtight bag or a box filled with desiccant packs. This should preserve the filament and prevent it from absorbing too much moisture.
If your filament is already wet, then you can dry it out with an oven set at around 60 °C. Leave the spool in the oven for a few hours while the moisture is cooked out.
For more in-detailed tips about filament storage check out our Filament Storage & Handling Guide.
+ Use Hairspray or Glue as a Release Agent
Usually other 3D printing materials have trouble sticking to print beds and need a thin spray of hairspray or glue stick to act as an adhesive. PETG is the opposite - it sticks so well that it can even tear chunks out of your build surface.
When printing in PETG applying a thin layer of hairspray or glue is surprisingly also an effective solution for PETG parts that stick too well to the build plate. Once applied the added layer acts as a release agent preventing the PETG from damaging your build surface if you are printing on anything other than a metal print bed.
Use a release agent if your printer's bed is:
Glass
PEI or PEI coated
Polymer based (Buildtak or similar)
For more in-detailed tips check out our PETG Ultimate Printing Guide.
+ Allow for Additional Z-Offset Distance
Unlike PLA and ABS, PETG needs a little extra room to be lain down as it exits the nozzle. Allowing for an additional Z-offset of 0.02mm can make a difference when printing in PETG.
PETG doesn't only stick really well to the bed, it sticks very well to itself as well. While this makes for solid 3D printed parts, it can make removing support material a tricky prospect.
For clean support removal and neat interface layers (the layers linking the support to your 3D print) allow for a little extra Z offset to ensure the support doesn't fuse to the print.
For more in-detailed tips check out our PETG Ultimate Printing Guide.
Pro Tips
Settings Tweaks - Dialling in your PETG print settings can be a little tricky and sometimes requires the manipulation of multiple settings to eliminate the dreaded problems of stringing and oozing. Try tackling the settings tweaks using the tips outlined above in the following order adjusting one setting at a time.
Printing Temperature
Travel Speed
Retraction
Coasting
Fan Speed
Adhesion Hack - Try disabling your part cooling fan and printing 5-10°C for the first few layers of the print to keep the part stuck to the print bed.
For a more in-detail look at the best practices when 3D printing in PETG, check out our next guide in this series PETG Filament Ultimate Printing Guide.
Applications
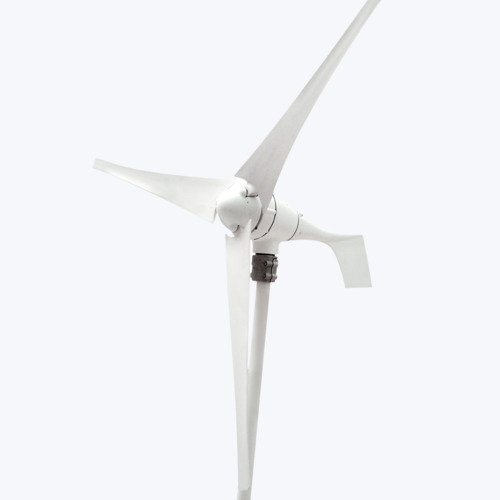
Outdoor Parts
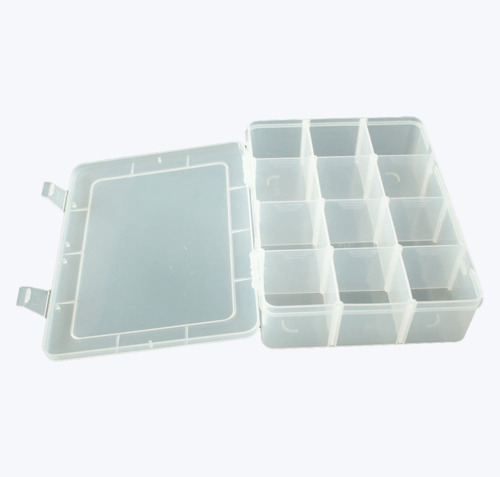
Live Hinge Components
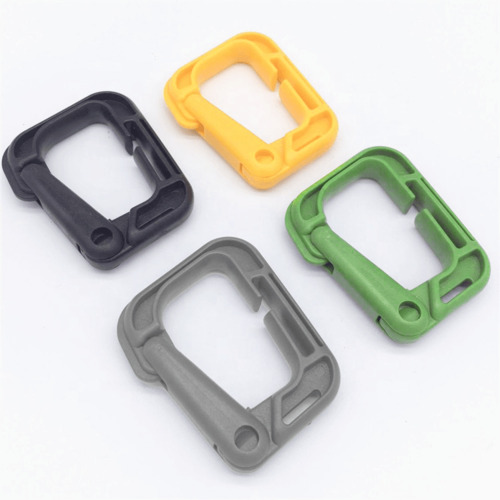
Snap Fit Components
Related Materials
0 notes
Photo

Excel: Mastering the Implicit and Explicit Features of Microsoft Excel
3DReferences
AbsoluteReference
AdditionIcon
AdvancedFilters
AdvancedUserFunctions
AppearanceofCells
AreaChart
Auto-fixingColumns
Auto-fixingRows
BarCharts
BasicFormatting
BlankRows
BubbleChart
CalculatingValues
CalculationsonSpreadsheets
CellFormatting
CellSecurity
ChangeMargins
CloseWorkbook
ColumnChart
ComboChart
ComparingColumns
ComparingLists
ConditionalFormatting
COUNTIFSFunction
CreatingBorders
CreatingRelationships
CreatingTables
CrossReferencing
CustomLists
DataAutofill
DataModelling
DataSet
DataSorting
DataTables
DataValidation
DisplayingFormulas
DoughnutChart
Drop-DownLists
DynamicArrays
ExcelEffects
ExcelGraphics
ExcelSecurity
ExcelTemplates
ExcelThemes.
ExcelWorkbook
ExecutionOrder
ExportingWorkbook
File–levelSecurity.
FilteringData
FiltersinExcel
Flash-FillinExcel
FontColours
ForecastSheet
FormatPainter
FormulaBar
FreezingPanesinExcel
FuzzyMatching
HeadersandFooters
HLOOKUPFunction
ImportData
INDEXMATCH
InsertRowsandColumns
InsertingImages
IntegrityofWorksheets
LineChart
MacrosinExcel
MergingCells
MicrosoftExcel
MultipleCells
MultipleRows
NaturalLanguageQuery
NavigatingExcelWorksheets
ObtainingData
PageFormat
PieCharts
PivotCharts
PowerQuery
PrinterSettings
PrintingSpreadsheet
Quick-AnalysisTool
RadarChart
RelativeReference
RelocatingColumns
RelocatingRows
ResizingChart
RichDataTypes
SaveaNewWorkbook
SaveExistingFile
ScatterChart
ShowValue
SpecialValues
StandardShapes
StartingExcel
StockChart
SUMIFandSUMIFS
Sum-ofFormula
SurfaceChart
TablesSlicers
TypesofCell
TypesofCharts
UsingFormulas
UsingTables
ValueIntegrity
VLOOKUPFunction
WorkbookSecurity
WorksheetLayout
#ExcelSecurity#formulabar#microsoftexcel#naturallanguagequery#pivotcharts#printingspreadsheet#quickanalysistool#relativereference#showvalue#stockchart#woksheetlayout
0 notes
Text
Getting Started With Chart.js: Radar and Polar Area Charts
The previous tutorial of this series focused on creating line and bar charts using Chart.js. Both these charts have their own uses and configuration options that were covered in detail in the last tutorial.
In this tutorial, you will learn about two new chart types that can be created using Chart.js: radar and polar area charts. Just like the previous tutorial, we will start with a brief overview of the chart types and then move to a more detailed discussion.
Creating Radar Charts
Line and bar charts are useful when you want to compare only one or two properties of a large number of objects—for example, the population of all the countries in Asia or the number of different pollutants in the atmosphere.
Let's say you want to compare the density, opacity, viscosity, refractive index and boiling point of only three different liquids. Creating a bar chart for this data will be problematic as you will need to create five different columns for each liquid. It will also be hard to compare the corresponding properties of the liquids.
In situations where you have to compare a lot of properties of only a few objects, creating a radar chart is the most efficient method of visualizing and comparing data. These charts are also known as spider charts.
From Wikipedia, a radar chart is a graphical method of displaying multivariate data in the form of a two-dimensional chart of three or more quantitative variables represented on axes starting from the same point. The relative positions and angles of the axes are typically uninformative.
Let's create our first radar chart now. Radar charts are created by setting the type key in Chart.js to radar. Here is a very basic example.
var radarChart = new Chart(marksCanvas, { type: 'radar', data: marksData, options: chartOptions });
Let's plot the marks of two students of a class in five different subjects. Here is the code to provide the data for creating the chart.
var marksData = { labels: ["English", "Maths", "Physics", "Chemistry", "Biology", "History"], datasets: [{ label: "Student A", backgroundColor: "rgba(200,0,0,0.2)", data: [65, 75, 70, 80, 60, 80] }, { label: "Student B", backgroundColor: "rgba(0,0,200,0.2)", data: [54, 65, 60, 70, 70, 75] }] }; var radarChart = new Chart(marksCanvas, { type: 'radar', data: marksData });
The first chart that we usually create does not have any background color specifically set by us. However, radar charts can have a lot of overlap, making it difficult to correctly identify the data points without any color coding.
For this reason, a color has been assigned to each dataset using the backgroundColor key. The following demo shows the final result of our code. As you can see, it is now very easy to compare the performance of both students in different subjects.
Besides the background color, you can also change the border color and border width for the chart using the borderColor and borderWidth keys. It is also possible for you to create dashed borders instead of continuous lines using the borderDash key. This key accepts an array as its value.
The first element of the array determines the length of the dashes, and the second element determines the space between them. You can also provide an offset value for drawing the dashes using the borderDashOffset key.
You can also control the border color and width for plotted points using the pointBorderColor and pointBorderWidth. Similarly, you can also set a background color for different points using the pointBackgroundColor key. The size of the plotted points can be specified using the pointRadius key. You can control the distance at which the points should start interacting with the mouse using the pointHitRadius key.
You can also control the appearance of the plotted points on hover using the pointHoverBackgroundColor, pointHoverBorderColor and pointHoverBorderWidth keys. One thing that you need to remember is that these hover keys will not wait for you to actually hover over the element to get triggered. The changes will take effect as soon as you are inside the hit radius set above.
There are a lot of shapes available for plotted points. They are circular by default. However, you can change the shape to triangle, rect, rectRounded, rectRot, cross, crossRot, star, line, and dash.
Let's use all these keys to redraw the previous radar chart. Here is the code to provide configuration options for the datasets and the scales.
var marksData = { labels: ["English", "Maths", "Physics", "Chemistry", "Biology", "History"], datasets: [{ label: "Student A", backgroundColor: "transparent", borderColor: "rgba(200,0,0,0.6)", fill: false, radius: 6, pointRadius: 6, pointBorderWidth: 3, pointBackgroundColor: "orange", pointBorderColor: "rgba(200,0,0,0.6)", pointHoverRadius: 10, data: [65, 75, 70, 80, 60, 80] }, { label: "Student B", backgroundColor: "transparent", borderColor: "rgba(0,0,200,0.6)", fill: false, radius: 6, pointRadius: 6, pointBorderWidth: 3, pointBackgroundColor: "cornflowerblue", pointBorderColor: "rgba(0,0,200,0.6)", pointHoverRadius: 10, data: [54, 65, 60, 70, 70, 75] }] }; var chartOptions = { scale: { ticks: { beginAtZero: true, min: 0, max: 100, stepSize: 20 }, pointLabels: { fontSize: 18 } }, legend: { position: 'left' } };
Inside the chartOptions object, the min and max values are used to set the minimum and maximum values for the scale. The stepSize key can be used to tell Chart.js the number of steps that it should take to go from min to max. Here is the final result of the above code.
Creating Polar Area Charts
Polar area charts are similar to pie charts. Two major differences between these charts are that in polar area charts all the sectors have equal angles and the radius of each sector depends on the plotted value. These charts are used to plot cyclic phenomena. For example, you can use it to plot the number of migratory birds of a given species in your area in each season of the year.
The radius of each sector in these charts is proportional to the square root of the number of corresponding objects. In the case of migratory birds, the radius will be proportional to the square root of the number of birds in your area.
You can create polar area charts in Chart.js by setting the type key to polarArea. Here is the basic code that you need to create a polar chart.
var polarAreaChart = new Chart(birdsCanvas, { type: 'polarArea', data: birdsData, options: chartOptions });
Here is the code to plot the number of migratory birds on a polar area chart. The only data provided at this point is the number of birds and the background color for different seasons.
var birdsData = { labels: ["Spring","Summer","Fall","Winter"], datasets: [{ data: [1200, 1700, 800, 200], backgroundColor: [ "rgba(255, 0, 0, 0.5)", "rgba(100, 255, 0, 0.5)", "rgba(200, 50, 255, 0.5)", "rgba(0, 100, 255, 0.5)" ] }] }; var polarAreaChart = new Chart(birdsCanvas, { type: 'polarArea', data: birdsData });
The above code will create the following polar area chart.
The polar area chart provides the usual options to set the backgroundColor, borderWidth, borderColor, hoverBackgroundColor, hoverBorderWidth, and hoverBorderColor. There are also some polar area chart specific keys that you can use to customize their appearance.
For example, you can set the starting angle for the first value in the dataset using the startAngle key. Similarly, the lineArc key that can be found under scale can be used to specify if the lines drawn should be circular or not by setting its value to true or false respectively.
The sectors drawn in the polar area chart are both rotated and scaled by default. However, you can prevent the scaling animation by setting the value of the animateScale key to false. Similarly, the rotating animation can be turned off by setting the value of the animateRotate key to false. Both these keys are available under animation.
The code below changes the value of a few keys to make the chart more visually appealing.
var birdsData = { labels: ["Spring", "Summer", "Fall", "Winter"], datasets: [{ data: [1200, 1700, 800, 200], backgroundColor: [ "rgba(255, 0, 0, 0.6)", "rgba(0, 255,200, 0.6)", "rgba(200, 0, 200, 0.6)", "rgba(0, 255, 0, 0.6)" ], borderColor: "rgba(0, 0, 0, 0.8)" }] }; var chartOptions = { startAngle: -Math.PI / 4, legend: { position: 'left' }, animation: { animateRotate: false } }; var polarAreaChart = new Chart(birdsCanvas, { type: 'polarArea', data: birdsData, options: chartOptions });
Besides rotating the chart and disabling the rotation animation, we have also moved the legend to the left of the chart by setting the value of position to left. This leaves enough space at the top of the chart to display it properly.
Final Thoughts
In this tutorial, you learned about the applications of radar and polar area charts. After that, you learned how to create basic charts and customize them with various configuration options available in Chart.js. You will learn about pie and bubble charts in the next part of the series.
If you're working with the web, especially on the front-end, JavaScript is important to know. Of course, it's not without its learning curves, and there are plenty of frameworks and libraries to keep you busy, as well. If you’re looking for additional resources to study or to use in your work, check out what we have available in the Envato marketplace.
If you have any questions about this tutorial, please let me know in the comments.
via Envato Tuts+ Code http://ift.tt/2piWk1h
0 notes
Photo

The yin to my yang.
10 notes
·
View notes
