#VisualizeData
Explore tagged Tumblr posts
Visit Tumblr Blog
Explore Tumblr blogs with no restrictions, modern design and the best experience.
Last Seen Tumblr Blogs


Fun Fact
Women make up for the other 50% of Tumblr’s audience.
Text
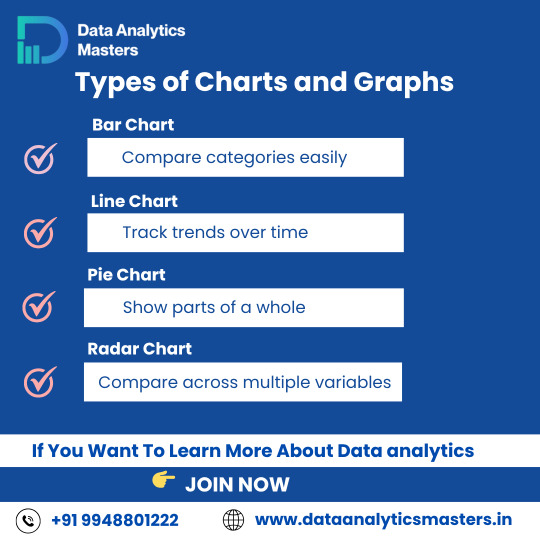
Types of Charts & Graphs
Understanding the right type of chart can help you tell a better story with data.
🔹 Bar Chart – Compare categories easily 🔹 Line Chart – Track changes over time 🔹 Pie Chart – Visualize parts of a whole 🔹 Radar Chart – Compare multiple variables
🎓 Learn how to visualize data like a pro! ✅ Why Choose Us?
✔️ 100% practical training
✔️ Real-time projects & case studies
✔️ Expert mentors with industry experience
✔️ Certification & job assistance
✔️ Easy-to-understand Telugu + English mix classes
📍 Institute Address:
3rd Floor, Dr. Atmaram Estates, Metro Pillar No. A690, Beside Siri Pearls & Jewellery, near JNTU Metro Station, Hyder Nagar, Vasantha Nagar, Hyderabad, Telangana – 500072 📞 Contact: +91 9948801222 📧 Email: [email protected] 🌐 Website: https://dataanalyticsmasters.in
#DataVisualization#DataAnalytics#BarChart#LineChart#PieChart#RadarChart#ChartTypes#DataScienceTraining#AnalyticsCourse#LearnDataAnalytics#VisualizeData#DataDriven#DataAnalyticsMasters#BusinessIntelligence#UpskillWithAnalytics
0 notes
Text

Visualize. Analyze. Act. That’s the power of VADY, your all-in-one AI-powered business intelligence suite. From real-time dashboards to deep AI insights, VADY helps decision-makers at every level make smarter, faster calls—all without the data overload.
#VADY#NewFangled#AIpoweredBusinessIntelligence#DataAnalyticsForBusiness#VADYBusinessIntelligence#AIVisualizationTools#AIDrivenAnalytics#SmartDecisionMakingTools#AIDataPlatforms#ConversationalAnalyticsPlatform#VADYAIAnalytics#VisualizeData#AnalyzeSmarter#BusinessDataInsights#EnterpriseAnalyticsTools#VADYSmartDecisionMaking#AIinBusiness#ActionableAnalytics#NextGenDataTools#EnterpriseLevelAI
0 notes
Text

Unveiling insights that redefine possibilities. 📊✨ Dive into the art of data with Looker Studio.
#DataAnalytics#DataVisualization#LookerStudio#BusinessIntelligence#DataDrivenDecisions#Analytics#DataArt#VisualizeData
0 notes
Text
Data Visualization
The process of representing data using popular images, like charts, plots, infographics, and even animations, is known as data visualization. These informational visual displays make difficult data linkages and data-driven insights understandable. YrEdge Consulting can provide you with optimum data visualization solutions, contact us today.

#DataVisualization#VisualizeData#DataViz#DataInsights#VisualData#Analytics#DataDriven#Infographics#ChartsAndGraphs#DataStorytelling#DataArt#DataAnalysis#DataPresentation#InformationDesign#GraphicalData#DataIllustration
0 notes
Text
Power BI is like a special tool from Microsoft. It helps you see data in cool ways, share what you find, and decide things better.
Stay tuned for the next post!
know more: https://www.analyticsshiksha.com
#PowerBI#PowerBIInsights#DataDrivenDecisions#BIAnalytics#VisualizeData#PowerBIReports#BusinessIntelligence#BIInsights#DataAnalytics#AnalyticsPlatform#super30#artofproblemsolving#analyticsshiksha#checkyoureligibilty#super30dataanalyticsprogram#datascience#dataanalytics#datasciencecourse#InformationTechnology#TechInnovation#DataManagement#programming#analytics#datasciencetraining#SuccessStories#ProblemSolving#careerchange
0 notes
Text
0 notes
Text
A Step-by-Step Guide to Create Dynamic Animated Graphs in Tableau 1.Connect to the Sample Superstore data in Tableau to load the dataset 2.Choose the "Sub-Category" field and place it into the Columns card. 3. Drag the "Sales" field and drop it into the Rows card. 4.Take the "Order Date" field and place it into the Filter card. 5. Drag the "Sub-Category" field and drop it into the Color option in the Marks card. 6. Select "Show History" to enable historical data.
Follow us for more insider tips and if you're ready to dive into the world of Tableau, enroll in our upcoming batches. 🚀 Contact us at +91 8288040281 or visit the link in bio for further details. 📈
#CACMSInstitute#TableauTutorial#DataVisualization#AnalyticsTips#TableauMastery#TechSkills#DataScience#DashboardDesign#VisualizeData#TechInnovation#TableauMagic#DataAnalytics#LearnTableau#GraphDesign#TableauTricks#DataStorytelling#BIExcellence#TableauExperts#DataVizCommunity#AnalyticsPro#TableauForBeginners
0 notes
Text

Empower Your Analytics: Best Power BI Courses for Success
Elevate your data game with the best Power BI courses. Uncover the secrets of dynamic data visualization and analytics. Master the art of business intelligence with top-notch courses, empowering your career journey.
0 notes
Text
Build Product Master
Easily upload your product Data and images.
Fill Excel template with your Product attribute values and upload.
Import 2D and 3D images and Automatically map to product IDs.
More information visit at freedomboard.ai

#FreedomboardFeatures#AIAnalytics#DataVisualization#BusinessIntelligence#DashboardSolutions#AIInsights#AdvancedAnalytics#DataDrivenDecisions#VisualizeData#AnalyticsPlatform
1 note
·
View note
Text
" Mastering DAX: Unlocking the Power of Advanced Data Analytics "
" Mastering DAX: Unlocking the Power of Advanced Data Analytics "
https://www.udemy.com/course/pl-300-microsoft-power-bi-data-analyst-certification-2024/?couponCode=7B13AB8EAC2516DC7634
Are you ready to transform raw data into actionable insights?
🚀 Join our Microsoft Power BI Course and gain the skills you need to create stunning, interactive dashboards and reports that drive smarter business decisions.
💡 What You’ll Learn:
✅ Master the Power BI interface and tools ✅ Connect and transform data from multiple sources ✅ Build visually compelling dashboards and reports ✅ Use DAX to perform advanced calculations ✅ Share and collaborate on insights in the Power BI service
🎯 Who Should Enroll?
This course is perfect for:
Aspiring data analysts Business professionals seeking data-driven decision-making skills Students and graduates wanting to boost their resumes
📅 Course Details:
Duration: 2 Hours Mode: Online/In-person Start Date: Anytime
🔥 Why Choose Us?
Expert trainers with real-world experience Help for real certification exam.
📌 Reserve Your Spot Now! Transform your career and become a data visualization expert. 💼
👉 PL-300: Microsoft Power BI Practice Test - 2024 (Practice only no certification)
Don’t wait—spaces are filling fast!
📊 #PowerBI #DataAnalytics #BusinessIntelligence #PowerBITraining #MicrosoftPowerBI #DataVisualization #BusinessIntelligence #DataAnalytics #DataDriven #BItools #Analytics #DataScience #DataInsights #PowerBIReports #DataStorytelling #DataDashboards #VisualizeData #PowerBICommunity #DataEngineer #SelfServiceBI #DataAnalysis #BusinessAnalytics #DashboardDesign #DataReporting #DataVisualizationTools #DataStrategy #DataVisualizationDesign #PowerBIDesktop #PowerBIDashboards #PowerBITraining #DataVisualizationTips #DataCulture #AdvancedAnalytics #DataManagement #PowerBIDeveloper #InteractiveData #BIAnalytics #PowerBIExperts #MicrosoftBI #DataDrivenDecisions #AIAndBI #DataIntegration #PowerBIPro #BusinessData #DataExploration #TechWithData #PowerBIProjects #DataPerformance #DataWithPowerBI #BIConsulting #PowerBIDevelopment #DynamicData #RealTimeBI #BIVisualization #CustomDashboards #DataAutomation #PowerPlatform #ModernBI #DataJourney #TechForBusiness #BIForBusiness
0 notes
Text

Unveiling insights that redefine possibilities. 📊✨ Dive into the art of data with Looker Studio. #DataDriven #VisualizeTheFuture
#DataAnalytics#DataVisualization#LookerStudio#BusinessIntelligence#DataDrivenDecisions#Analytics#DataArt#VisualizeData
0 notes
Photo

(via visualizedata/jacob-romer-glimpse: A Chrome extension that lets you see who tracks you where and when on the internet.)
0 notes
Text

Unveiling insights with precision 📊✨ Dive into the art of data storytelling with Looker Studio! #DataDriven #VisualizationMasters #AnalyticsArt"
#DataVisualization#AnalyticsInAction#LookerStudio#DataAnalytics#DataDriven#VisualizeData#DataInsights#BusinessIntelligence#DataScience#BigDataAnalytics
0 notes
Text

Unveiling insights that redefine the data game. 📊✨ Dive into the art of visualizing data with Looker Studio. #DataVisualization #AnalyticsInAction #LookerStudio #DataDrivenDecisions
#DataVisualization#AnalyticsInAction#LookerStudio#DataAnalytics#DataDriven#VisualizeData#DataInsights#BusinessIntelligence#DataScience#BigDataAnalytics
0 notes
Text

Unlocking Insights: Where data meets visualization magic ✨ Dive into the art of storytelling through data with Looker Studio. 📊💡 #DataVisualization #Analytics #LookerStudio #DataDrivenDecisions
#DataVisualization#Analytics#LookerStudio#DataDrivenDecisions#DataScience#DataStorytelling#DataAnalytics#BusinessIntelligence#VisualizeData
0 notes
Text

Unveiling insights that spark curiosity and drive decisions. 📊✨ Dive into the art of data with Looker Studio! #DataDriven #VisualizeTheFuture #LookerStudio
#DataVisualization#Analytics#LookerStudio#DataDrivenDecisions#DataArt#BusinessIntelligence#VisualizeData#DataAnalytics
0 notes