#Set Up Grafana Data Source
Explore tagged Tumblr posts
Visit Tumblr Blog
Explore Tumblr blogs with no restrictions, modern design and the best experience.
Last Seen Tumblr Blogs


Fun Fact
BuzzFeed published a report claiming that Tumblr was utilized as a distribution channel for Russian agents to influence American voting habits during the 2016 presidential election in Feb 2018.
Text
Docker Setup: Monitoring Synology with Prometheus and Grafana
In this article, we will discuss “Docker Setup: Monitoring Synology with Prometheus and Grafana”. We will be utilizing Portainer which is a lightweight/open-source management solution designed to simplify working with Docker containers instead of working with the Container Manager on Synology. Please see How to use Prometheus for Monitoring, how to Install Grafana on Windows and Windows Server,…
#Accessing Grafana and Prometheus#Add Portainer Registries#Configure and Run Prometheus Container#docker#Docker Containers on Synology#Enter5yourownpasswordhere123456#Enter5yourownpasswordhere2345#Grafana monitoring#Grafana/Prometheus Monitoring#How To Install Prometheus And Grafana On Docker#install portainer#Modify Synology Firewall Rules#monitoring solutions for Docker#portainer#portainer server#Prometheus Grafana integration#Prometheus metrics#Pull Docker Images for Grafana and Prometheus#Set Up Grafana Data Source#Synology monitoring setup#Your Portainer instance timed out for Security Purposes
0 notes
Text
Unlock Infrastructure Mastery: Join the Prometheus MasterClass for Monitoring & Alerting

If you've ever tried to troubleshoot a slow-loading website, debug a crashing server, or simply wanted more insight into what your system is doing behind the scenes — then monitoring and alerting are already on your radar. But here’s the deal: traditional monitoring tools often leave you juggling incomplete data, clunky dashboards, and alerts that scream, “Something’s wrong!” without telling you what, where, or why.
That’s where Prometheus comes in — and more importantly, where the Prometheus MasterClass: Infra Monitoring & Alerting! becomes your ultimate ally.
Whether you're a DevOps engineer, a system administrator, or just an aspiring tech pro, this course can be your game-changer for mastering infrastructure visibility, real-time alerting, and proactive problem-solving.
Let’s dive into why Prometheus is so powerful, what you’ll learn in this masterclass, and how it sets you on a path to dominate infrastructure monitoring like a pro.
Why Infrastructure Monitoring Matters — A Lot
Let’s break it down.
Infrastructure monitoring is like the health tracker for your digital ecosystem. It tells you how your servers, containers, databases, and applications are doing — whether they’re healthy or if they’re about to explode in a flurry of errors.
Think of it like this:
No monitoring? You're driving blindfolded.
Poor monitoring? You’re guessing where the potholes are.
Great monitoring with Prometheus? You're getting real-time traffic alerts, weather updates, and predictive insights to avoid crashes before they happen.
The problem? Setting all this up isn’t always plug-and-play — unless you're learning from a guided course like the Prometheus MasterClass: Infra Monitoring & Alerting!
Meet Prometheus – Your New Monitoring Power Tool
Prometheus is an open-source monitoring and alerting toolkit designed for reliability, performance, and flexibility. Originally developed by SoundCloud, it has since become a CNCF project (Cloud Native Computing Foundation) and a favorite in the DevOps and cloud-native world.
What makes it a rockstar?
✅ Time-series database – stores metrics efficiently ✅ Flexible query language (PromQL) – get exactly what you want ✅ Pull-based architecture – better control and reliability ✅ Built-in alert manager – integrated and customizable alerts ✅ Integration with Grafana – gorgeous dashboards in minutes ✅ Massive community support – plenty of exporters and documentation
If you're working with Kubernetes, Docker, AWS, GCP, or even legacy servers — Prometheus can slide into your stack seamlessly.
But understanding how to actually use Prometheus effectively? That’s a skill.
What You'll Learn in the Prometheus MasterClass
Now let’s talk about the Prometheus MasterClass: Infra Monitoring & Alerting!, because this isn’t just a “read the docs” kind of learning experience.
This course was crafted with both beginners and intermediate learners in mind. It’s hands-on, example-driven, and refreshingly easy to follow — no overwhelming theory, just clear, actionable learning.
Here’s what you’ll walk away with:
🔍 Understanding Metrics and Monitoring Essentials
Difference between monitoring, observability, and alerting
Types of metrics: gauge, counter, histogram, summary
Designing your monitoring strategy
⚙️ Installing and Setting Up Prometheus
How to install Prometheus on Linux and Windows systems
Navigating the configuration file (prometheus.yml)
Setting up node exporters, cAdvisor, and blackbox exporters
📈 Visualizing Metrics with Grafana
Connecting Prometheus with Grafana
Creating custom dashboards and panels
Using variables, annotations, and templating
📡 Collecting and Querying Metrics
Writing PromQL queries like a pro
Building advanced queries for insights
Getting data from third-party services
🚨 Setting Up Alerts That Actually Work
Configuring alert rules and conditions
Using Alertmanager to manage notifications
Integrating Slack, email, and other services
🛠️ Real-World Scenarios and Use Cases
Monitoring CPU, memory, and disk I/O
Detecting and responding to application crashes
Setting thresholds and predictive alerts
Analyzing service availability and response times
☁️ Bonus: Cloud + Kubernetes Monitoring
Kubernetes cluster monitoring with Prometheus
Service discovery and scraping from pods
Best practices for cloud-native environments
The best part? Every lesson is designed to be practical. You’ll be spinning up Prometheus instances, writing queries, and building dashboards right alongside the instructor.
Who Should Take This Course?
This MasterClass is perfect for:
🧠 System administrators tired of jumping between logs and guesswork
💼 DevOps professionals looking to sharpen their monitoring toolset
🌱 Cloud engineers who want visibility across dynamic infrastructures
💻 Developers interested in app performance and availability
🎯 Career switchers or students learning modern DevOps skills
Even if you’ve never touched Prometheus before, the course takes you step-by-step. And if you have used it casually? It’ll take your knowledge to the next level.
Why This Course Beats Random Tutorials
You might be thinking — can’t I just watch YouTube videos or read blog posts?
Sure. You can — but here’s why this MasterClass is a better investment of your time:
🔁 Structured Learning – Each lesson builds on the last 🎯 Focused Content – No fluff, just what works in real environments 🙋 Hands-On Practice – Real scenarios, live configurations 📚 Lifetime Access – Revisit any lesson, anytime 🧑🏫 Expert Guidance – Learn from an instructor with real-world experience 📈 Career-Boosting Value – Add it to your resume, your GitHub, your confidence
And yes — once you enroll in the Prometheus MasterClass: Infra Monitoring & Alerting!, you’ll gain full access to everything, including updates, resources, and community support.
Real Results: What Others Are Saying
💬 "I went from not knowing what a time-series metric was to building real dashboards for my team." 💬 "The best Prometheus learning resource I’ve ever used. Well-structured and practical." 💬 "I finally understand PromQL. The instructor makes it so clear!" 💬 "After this course, I set up alerting that saved us from a major outage last week."
There’s a reason this course is gaining momentum — because it works.
The Future is Observable — Don’t Stay in the Dark
Modern infrastructure is fast, dynamic, and complex. The days of hoping your app works fine in production are long gone. You need visibility, insights, and the power to act fast.
That’s exactly what Prometheus offers — and what this course teaches you to harness.
The Prometheus MasterClass: Infra Monitoring & Alerting! is your opportunity to master one of the most in-demand tools in modern DevOps. Whether you’re upgrading your skills or future-proofing your career — this is the place to start.
Ready to Take Control of Your Infrastructure?
Enroll now in the Prometheus MasterClass: Infra Monitoring & Alerting! and take the first step toward becoming the go-to monitoring expert in your team.
👉 No guesswork. 👉 No overwhelm. 👉 Just clean, clear, confident infrastructure management.
0 notes
Text
Deploy Your First App on OpenShift in Under 10 Minutes
Effective monitoring is crucial for any production-grade Kubernetes or OpenShift deployment. In this article, we’ll explore how to harness the power of Prometheus and Grafana to gain detailed insights into your OpenShift clusters. We’ll cover everything from setting up monitoring to visualizing metrics and creating alerts so that you can proactively maintain the health and performance of your environment.
Introduction
OpenShift, Red Hat’s enterprise Kubernetes platform, comes packed with robust features to manage containerized applications. However, as the complexity of deployments increases, having real-time insights into your cluster performance, resource usage, and potential issues becomes essential. That’s where Prometheus and Grafana come into play, enabling observability and proactive monitoring.
Why Monitor OpenShift?
Cluster Health: Ensure that each component of your OpenShift cluster is running correctly.
Performance Analysis: Track resource consumption such as CPU, memory, and storage.
Troubleshooting: Diagnose issues early through detailed metrics and logs.
Proactive Alerting: Set up alerts to prevent downtime before it impacts production workloads.
Optimization: Refine resource allocation and scaling strategies based on usage patterns.
Understanding the Tools
Prometheus: The Metrics Powerhouse
Prometheus is an open-source systems monitoring and alerting toolkit designed for reliability and scalability. In the OpenShift world, Prometheus scrapes metrics from various endpoints, stores them in a time-series database, and supports complex querying through PromQL (Prometheus Query Language). OpenShift’s native integration with Prometheus gives users out-of-the-box monitoring capabilities.
Key Features of Prometheus:
Efficient Data Collection: Uses a pull-based model, where Prometheus scrapes HTTP endpoints at regular intervals.
Flexible Queries: PromQL allows you to query and aggregate metrics to derive actionable insights.
Alerting: Integrates with Alertmanager for sending notifications via email, Slack, PagerDuty, and more.
Grafana: Visualize Everything
Grafana is a powerful open-source platform for data visualization and analytics. With Grafana, you can create dynamic dashboards that display real-time metrics from Prometheus as well as other data sources. Grafana’s rich set of panel options—including graphs, tables, and heatmaps—lets you drill down into the details and customize your visualizations.
Key Benefits of Grafana:
Intuitive Dashboarding: Build visually appealing and interactive dashboards.
Multi-source Data Integration: Combine data from Prometheus with logs or application metrics from other sources.
Alerting and Annotations: Visualize alert states directly on dashboards to correlate events with performance metrics.
Extensibility: Support for plugins and integrations with third-party services.
Setting Up Monitoring in OpenShift
Step 1: Deploying Prometheus on OpenShift
OpenShift comes with built-in support for Prometheus through its Cluster Monitoring Operator, which simplifies deployment and configuration. Here’s how you can get started:
Cluster Monitoring Operator: Enable the operator from the OpenShift Web Console or using the OpenShift CLI. This operator sets up Prometheus instances, Alertmanager, and the associated configurations.
Configuration Adjustments: Customize the Prometheus configuration according to your environment’s needs. You might need to adjust scrape intervals, retention policies, and alert rules.
Target Discovery: OpenShift automatically discovers important endpoints (e.g., API server, node metrics, and custom application endpoints) for scraping. Ensure that your applications expose metrics in a Prometheus-compatible format.
Step 2: Integrating Grafana
Deploy Grafana: Grafana can be installed as a containerized application in your OpenShift project. Use the official Grafana container image or community Operators available in the OperatorHub.
Connect to Prometheus: Configure a Prometheus data source in Grafana by providing the URL of your Prometheus instance (typically available within your cluster). Test the connection to ensure metrics can be queried.
Import Dashboards: Leverage pre-built dashboards from the Grafana community or build your own custom dashboards tailored to your OpenShift environment. Dashboard templates can help visualize node metrics, pod-level data, and even namespace usage.
Step 3: Configuring Alerts
Both Prometheus and Grafana offer alerting capabilities:
Prometheus Alerts: Write and define alert rules using PromQL. For example, you might create an alert rule that triggers if a node’s CPU usage remains above 80% for a sustained period.
Alertmanager Integration: Configure Alertmanager to handle notifications by setting up routing rules, grouping alerts, and integrating with channels like Slack or email.
Grafana Alerting: Configure alert panels directly within Grafana dashboards, allowing you to visualize metric thresholds and receive alerts if a dashboard graph exceeds defined thresholds.
Best Practices for Effective Monitoring
Baseline Metrics: Establish baselines for normal behavior in your OpenShift cluster. Document thresholds for CPU, memory, and network usage to understand deviations.
Granular Dashboard Design: Create dashboards that provide both high-level overviews and deep dives into specific metrics. Use Grafana’s drill-down features for flexible analysis.
Automated Alerting: Leverage automated alerts to receive real-time notifications about anomalies. Consider alert escalation strategies to reduce noise while ensuring critical issues are addressed promptly.
Regular Reviews: Regularly review and update your monitoring configurations. As your OpenShift environment evolves, fine-tune metrics, dashboards, and alert rules to reflect new application workloads or infrastructure changes.
Security and Access Control: Ensure that only authorized users have access to monitoring dashboards and alerts. Use OpenShift’s role-based access control (RBAC) to manage permissions for both Prometheus and Grafana.
Common Challenges and Solutions
Data Volume and Retention: As metrics accumulate, database size can become a challenge. Address this by optimizing retention policies and setting up efficient data aggregation.
Performance Overhead: Ensure your monitoring stack does not consume excessive resources. Consider resource limits and autoscaling policies for monitoring pods.
Configuration Complexity: Balancing out-of-the-box metrics with custom application metrics requires regular calibration. Use templated dashboards and version control your monitoring configurations for reproducibility.
Conclusion
Monitoring OpenShift with Prometheus and Grafana provides a robust and scalable solution for maintaining the health of your containerized applications. With powerful features for data collection, visualization, and alerting, this stack enables you to gain operational insights, optimize performance, and react swiftly to potential issues.
As you deploy and refine your monitoring strategy, remember that continuous improvement is key. The combination of Prometheus’s metric collection and Grafana’s visualization capabilities offers a dynamic view into your environment—empowering you to maintain high service quality and reliability for all your applications.
Get started today by setting up your OpenShift monitoring stack, and explore the rich ecosystem of dashboards and integrations available for Prometheus and Grafana! For more information www.hawkstack.com
0 notes
Text
What Is SRE? A Beginner's Guide to Modern Reliability Engineering
The Evolution of Site Reliability Engineering
Large-scale system management has changed significantly with the rise of Site Reliability Engineering (SRE) Foundation. It started at Google in the early 2000s when software engineers were given the responsibility of using code to solve operations problems. By introducing a software-centric approach to infrastructure management, this change sought to close the gap between development and operations.

Flexible in nature, traditional system administration concentrated on resolving problems after they came up. A proactive, engineering-driven model with a focus on automation, dependability, and performance was introduced by SRE. Teams were able to measure and strike a balance between innovation and system stability thanks to concepts like SLAs, SLOs, and error budgets.
These days, SRE principles are not limited to tech giants. SRE is used by businesses of all sizes to increase uptime, decrease labor, and promote cooperation between the operations and development teams. SRE keeps evolving in response to the growing complexity of systems and the need for resilience; it is essential to the development of scalable, dependable, and effective digital services.
DevOps vs. SRE: What’s the Difference?
1. Origin
DevOps is a cultural movement that emerged to improve collaboration between development and operations.
SRE was created at Google as a way to apply software engineering to operations tasks.
While DevOps evolved as a philosophy to break silos, SRE is a concrete set of practices rooted in engineering discipline.
2. Focus
DevOps emphasizes faster delivery through automation and collaboration.
SRE focuses on ensuring reliability, scalability, and performance.
DevOps is about speed and efficiency; SRE ensures systems stay reliable as they scale.
3. Approach
DevOps promotes practices like CI/CD and Infrastructure as Code.
SRE uses SLAs, SLOs, SLIs, and error budgets to manage risk.
SRE adds measurable, reliability-focused engineering to the DevOps workflow.
4. Roles and Teams
DevOps encourages shared responsibility across teams.
SRE introduces a dedicated role with strong coding and ops skills.
SREs often act as reliability guardians, while DevOps promotes a collaborative environment.
Top Tools Every Site Reliability Engineer Should Know
Site Reliability Engineers (SREs) Training play a critical role in maintaining the reliability and performance of modern systems. To do this effectively, they rely on a robust toolkit that covers monitoring, automation, logging, and infrastructure management.
1. Prometheus – An open-source monitoring system that collects time-series data and provides powerful alerting capabilities. It's often the go-to tool for system health checks.
2. Grafana – Frequently used with Prometheus, Grafana offers rich dashboards and visualization for system metrics, helping teams quickly detect anomalies.
3. ELK Stack (Elasticsearch, Logstash, Kibana) – This trio helps with centralized logging and data analysis. SREs use it to search logs, identify root causes, and track trends over time.
4. Chaos Monkey – Developed by Netflix, this chaos engineering tool randomly terminates instances in production to test a system’s resilience and recovery strategy.
5. Kubernetes – A container orchestration platform that automates deployment, scaling, and management of containerized applications, making it essential for managing complex infrastructure.
6. Terraform – A leading Infrastructure as Code (IaC) tool used to automate infrastructure provisioning and ensure consistency across environments.
The Future of SRE
In 2025, Site Reliability Engineering (SRE) is adapting to new demands as technology advances. One significant trend is increasing use of AI and machine learning in incident response and observability. SREs use predictive analytics to identify and fix problems before affecting users.
Another shift is the rise of platform engineering, where internal developer platforms (IDPs) streamline infrastructure and reliability practices across teams. SREs are playing a key role in building and maintaining these platforms.
Security and compliance are also becoming core responsibilities, with reliability now extending to areas like zero-trust architecture and data governance.
Additionally, multi-cloud and edge computing environments are challenging SREs to rethink monitoring, automation, and resilience strategies.
SREs are not just problem solvers—they’re strategic partners driving innovation, scalability, and trust in digital systems.Uncover details: Site Reliability Engineering Courses
0 notes
Text
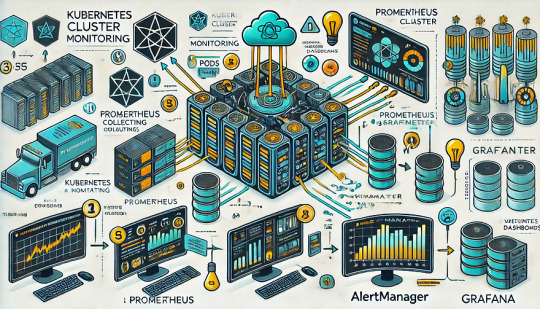
Monitoring Kubernetes Clusters with Prometheus and Grafana
Introduction
Kubernetes is a powerful container orchestration platform, but monitoring it is crucial for ensuring reliability, performance, and scalability.
Prometheus and Grafana are two of the most popular open-source tools for monitoring and visualizing Kubernetes clusters.
In this guide, we’ll walk you through setting up Prometheus and Grafana on Kubernetes and configuring dashboards for real-time insights.
Why Use Prometheus and Grafana for Kubernetes Monitoring?
Prometheus: The Monitoring Backbone
Collects metrics from Kubernetes nodes, pods, and applications.
Uses a powerful query language (PromQL) for analyzing data.
Supports alerting based on predefined conditions.
Grafana: The Visualization Tool
Provides rich dashboards with graphs and metrics.
Allows integration with multiple data sources (e.g., Prometheus, Loki, Elasticsearch).
Enables alerting and notification management.
Step 1: Installing Prometheus and Grafana on Kubernetes
Prerequisites
Before starting, ensure you have:
A running Kubernetes cluster
kubectl and Helm installed
1. Add the Prometheus Helm Chart Repository
Helm makes it easy to deploy Prometheus and Grafana using predefined configurations.shhelm repo add prometheus-community https://prometheus-community.github.io/helm-charts helm repo update
2. Install Prometheus and Grafana Using Helm
shhelm install prometheus prometheus-community/kube-prometheus-stack --namespace monitoring --create-namespace
This command installs: ✅ Prometheus — For collecting metrics ✅ Grafana — For visualization ✅ Alertmanager — For notifications ✅ Node-exporter — To collect system-level metrics
Step 2: Accessing Prometheus and Grafana
Once deployed, we need to access the Prometheus and Grafana web interfaces.
1. Accessing Prometheus
Check the Prometheus service:shkubectl get svc -n monitoring
Forward the Prometheus server port:shkubectl port-forward svc/prometheus-kube-prometheus-prometheus 9090 -n monitoring
Now, open http://localhost:9090 in your browser.
2. Accessing Grafana
Retrieve the Grafana admin password:shkubectl get secret --namespace monitoring prometheus-grafana -o jsonpath="{.data.admin-password}" | base64 --decodeForward the Grafana service port:shkubectl port-forward svc/prometheus-grafana 3000:80 -n monitoring
Open http://localhost:3000, and log in with:
Username: admin
Password: (obtained from the previous command)
Step 3: Configuring Prometheus as a Data Source in Grafana
Open Grafana and navigate to Configuration > Data Sources.
Click Add data source and select Prometheus.
Set the URL to:
sh
http://prometheus-kube-prometheus-prometheus.monitoring.svc.cluster.local:9090
Click Save & Test to verify the connection.
Step 4: Importing Kubernetes Dashboards into Grafana
Grafana provides ready-made dashboards for Kubernetes monitoring.
Go to Dashboards > Import.
Enter a dashboard ID from Grafana’s dashboard repository.
Example: Use 3119 for Kubernetes cluster monitoring.
Select Prometheus as the data source and click Import.
You’ll now have a real-time Kubernetes monitoring dashboard! 🎯
Step 5: Setting Up Alerts in Prometheus and Grafana
Creating Prometheus Alerting Rules
Create a ConfigMap for alerts:yamlapiVersion: v1 kind: ConfigMap metadata: name: alert-rules namespace: monitoring data: alert.rules: | groups: - name: InstanceDown rules: - alert: InstanceDown expr: up == 0 for: 5m labels: severity: critical annotations: summary: "Instance {{ $labels.instance }} is down"
Apply it to the cluster:shkubectl apply -f alert-rules.yaml
Configuring Grafana Alerts
Navigate to Alerting > Notification Channels.
Set up a channel (Email, Slack, or PagerDuty).
Define alert rules based on metrics from Prometheus.
Step 6: Enabling Persistent Storage for Prometheus
By default, Prometheus stores data in memory. To make the data persistent, configure storage:
Modify the Helm values:yamlprometheus: server: persistentVolume: enabled: true size: 10Gi
Apply the changes:shhelm upgrade prometheus prometheus-community/kube-prometheus-stack -f values.yaml
Conclusion
In this guide, we’ve set up Prometheus and Grafana to monitor a Kubernetes cluster. You now have: ✅ Real-time dashboards in Grafana ✅ Prometheus alerts to detect failures ✅ Persistent storage for historical metrics
WEBSITE: https://www.ficusoft.in/devops-training-in-chennai/
0 notes
Text
How to Monitor and Debug Python-Based ETL Pipelines
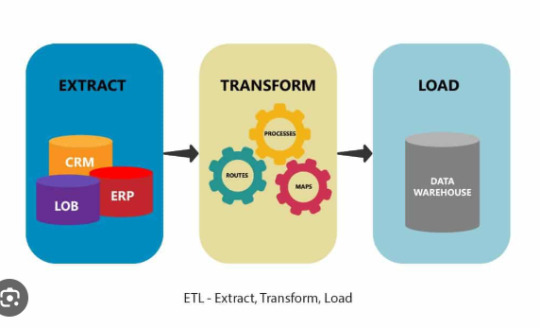
In the world of data engineering, Extract, Transform, Load (ETL) Python workflows are the backbone of moving, cleaning, and transforming data into actionable insights. However, even the most well-designed ETL pipelines can run into issues like slow performance, data mismatches, or outright failures. To ensure smooth operation, monitoring and debugging Python-based ETL pipelines is critical. This article will guide you through practical strategies and tools to monitor and debug ETL workflows effectively.
Why Monitor Python-Based ETL Pipelines?
Monitoring is essential to maintain the reliability of ETL pipelines. It helps identify bottlenecks, spot anomalies, and ensure data integrity. Without robust monitoring, errors may go unnoticed until they cause significant downstream issues, such as corrupted reports or unresponsive applications.
Common Challenges in Python ETL Pipelines
Before diving into solutions, let’s explore common issues faced when running ETL pipelines:
Data Extraction Failures: API timeouts, file unavailability, or incorrect data formats can disrupt the extraction process.
Transformation Errors: Logical flaws in data transformation scripts can lead to inaccurate results.
Load Failures: Issues like database connectivity problems or schema mismatches can hinder the loading process.
Performance Bottlenecks: Handling large datasets may slow down pipelines if not optimized.
Missing Data Validation: Without proper checks, pipelines may process incomplete or corrupt data.
Effective Monitoring Strategies for ETL Pipelines
1. Use Logging for Transparency
Logging is the cornerstone of monitoring ETL pipelines. Python’s logging library allows you to capture details about pipeline execution, including errors, processing times, and data anomalies. Implement structured logging to make logs machine-readable, which simplifies debugging.
2. Monitor Pipeline Metrics
Track metrics like execution time, row counts, and resource utilization to spot inefficiencies. Tools like Prometheus and Grafana can visualize these metrics, providing actionable insights.
3. Set Up Alerts for Failures
Use tools like Apache Airflow, Dagster, or custom scripts to trigger alerts when a pipeline fails. Alerts can be sent via email, Slack, or SMS to ensure prompt action.
Debugging Techniques for Python-Based ETL Pipelines
1. Identify the Faulty Stage
Divide your pipeline into stages (Extract, Transform, Load) and isolate the problematic one. For instance:
If the error occurs during extraction, check the data source connectivity.
If transformation fails, debug the logic in your Python code.
For loading errors, examine database logs for schema mismatches or connectivity issues.
2. Utilize Python Debugging Tools
Python’s built-in debugger, pdb, is invaluable for inspecting code at runtime. You can set breakpoints to pause execution and examine variable values.
3. Test with Mock Data
Create unit tests using frameworks like pytest to simulate different pipeline scenarios. Mock external dependencies (e.g., databases, APIs) to test your logic in isolation.
4. Validate Data at Every Step
Incorporate data validation checks to ensure input, intermediate, and output data meet expectations. Libraries like pandas and great_expectations simplify this process.
Tools for Monitoring and Debugging ETL Pipelines
Apache Airflow: Schedule, monitor, and manage workflows with built-in task-level logging and alerting.
Dagster: Provides observability with real-time logs and metadata tracking.
DataDog: Monitors application performance and sends alerts for anomalies.
ELK Stack: Use Elasticsearch, Logstash, and Kibana to collect and analyze logs.
Best Practices for Reliable ETL Pipelines
Implement Retry Mechanisms: Use libraries like tenacity to retry failed tasks automatically.
Version Control Your Code: Use Git to track changes and quickly revert to a stable version if needed.
Optimize Resource Usage: Profile your code with tools like cProfile and use parallel processing libraries (e.g., Dask, multiprocessing) for efficiency.
Document Your Pipeline: Clear documentation helps identify potential issues faster.
Conclusion
Monitoring and debugging Python-based ETL pipelines require a mix of proactive tracking and reactive problem-solving. Leveraging tools like logging frameworks, Airflow, and testing libraries, you can ensure your Extract, Transform, Load Python workflows are robust and reliable. By implementing the strategies discussed in this article, you’ll minimize downtime, improve performance, and maintain data integrity throughout your pipelines.
0 notes
Text
Monitoring Systems and Services with Prometheus
In today’s IT landscape, monitoring systems and services is not just important—it’s critical. With the rise of microservices, cloud-native architectures, and distributed systems, ensuring application uptime and performance has become more complex. Enter Prometheus, an open-source monitoring and alerting toolkit designed for modern systems.
What is Prometheus?
Prometheus is a powerful, feature-rich, and highly scalable monitoring system. It excels at collecting metrics, providing a flexible query language, and integrating seamlessly with a wide variety of systems. Developed originally by SoundCloud, it is now a Cloud Native Computing Foundation (CNCF) project.
Key Features of Prometheus
Multi-dimensional data model: Metrics are stored with key-value pairs (labels), allowing granular and flexible querying.
Pull-based scraping: Prometheus pulls metrics from defined endpoints, ensuring better control over the data.
Powerful query language (PromQL): Prometheus Query Language enables robust metric analysis.
Time-series database: It stores all data as time-stamped, making historical analysis and trend monitoring straightforward.
Alerting capabilities: Prometheus integrates with Alertmanager to provide notifications for defined thresholds or anomalies.
How Prometheus Works
Scraping Metrics: Prometheus scrapes metrics from targets (applications, services, or systems) by accessing exposed HTTP endpoints, typically /metrics.
Data Storage: The collected metrics are stored in Prometheus’s time-series database.
Querying with PromQL: Users can run queries to analyze trends, generate graphs, or inspect metrics for anomalies.
Alerting: Based on queries, Prometheus can trigger alerts via the Alertmanager, which supports integrations with tools like Slack, PagerDuty, and email.
Use Cases of Prometheus
Infrastructure Monitoring: Track CPU, memory, disk usage, and network performance of your servers and VMs.
Application Monitoring: Monitor application health, API latencies, error rates, and user request patterns.
Kubernetes Monitoring: Gain insights into Kubernetes clusters, including pod status, resource utilization, and deployments.
Business Metrics: Measure success indicators such as transactions per second, user growth, or conversion rates.
Getting Started with Prometheus
Install Prometheus: Download and install Prometheus from its official site.
Set up Scrape Targets: Define the endpoints of the services you want to monitor in the prometheus.yml configuration file.
Run Prometheus: Start the server, and it will begin collecting metrics.
Visualize Metrics: Use Prometheus’s web UI, Grafana (a popular visualization tool), or command-line queries for visualization and analysis.
Integrating Prometheus with Grafana
While Prometheus provides a basic web interface, its true potential shines when paired with Grafana for rich and interactive dashboards. Grafana supports PromQL natively and allows you to create stunning visualizations of your metrics.
Benefits of Using Prometheus
Open Source: Freely available, with a vast and active community.
Scalable: Works efficiently for both small setups and enterprise-level infrastructures.
Extensible: Compatible with many exporters, enabling monitoring of databases, message queues, and more.
Alerts and Insights: Real-time monitoring and customizable alerts ensure minimal downtime.
Challenges and How to Overcome Them
High Cardinality: Too many unique label combinations can lead to resource overuse. Optimize your labels to avoid this.
Scaling: Use Prometheus federation or remote storage solutions to handle extremely large environments.
Learning Curve: PromQL and setup can be complex initially, but online documentation and the Prometheus community offer ample resources.
Final Thoughts
Prometheus has transformed the way modern systems and services are monitored. Its powerful features, extensibility, and open-source nature make it a go-to choice for organizations of all sizes. Whether you’re monitoring a single server or a multi-cloud deployment, Prometheus can scale to meet your needs.
If you’re looking to harness the power of Prometheus for your systems, explore HawkStack’s monitoring solutions. Our expert team ensures seamless integration and optimized monitoring for all your infrastructure needs.
Ready to get started? Contact us today! www.hawkstack.com
#redhatcourses#information technology#containerorchestration#kubernetes#docker#linux#container#containersecurity#dockerswarm
0 notes
Text
Tips and tools for collecting helpful Kubernetes metrics
Prometheus is named after the Greek legend of Prometheus, a titan who defied the gods and gave fire to humanity. For this action, Prometheus was chained to a boulder where an eagle, the earthen symbol of Zeus, would eat the other immortal's liver, every day, for eternity.
Since its introduction in 2012, Prometheus has been adopted by a multitude of companies and organizations. However, it remains independent with the management and maintenance of the project occurring separate of any company.
In 2016, Prometheus joined the Cloud Native Computing Foundation (CNCF). It is the second project hosted by the foundation; the first project was Kubernetes.
READ MORE...
In modern software development, managing and monitoring infrastructure is critical for ensuring the reliability and performance of applications. Prometheus has emerged as one of the most powerful tools for this purpose. Designed specifically for monitoring and alerting in cloud-native environments, Prometheus is widely adopted by developers, sysadmins, and DevOps teams.
In this masterclass, we will explore the core concepts of Prometheus, how to set it up, configure it, and use it for monitoring infrastructure and generating alerts. By the end of this guide, you’ll have a deep understanding of how Prometheus works and how it can be applied to real-world infrastructure monitoring and alerting.
Table of Contents
Introduction to Prometheus
Prometheus Architecture
Setting up Prometheus
Data Collection with Exporters
Writing Prometheus Queries (PromQL)
Alerting in Prometheus
Monitoring Infrastructure with Prometheus
Prometheus and Grafana Integration
Scaling and Managing Prometheus
Best Practices for Prometheus Monitoring
Real-World Use Cases
Conclusion
1. Introduction to Prometheus
Prometheus is an open-source systems monitoring and alerting toolkit, originally built at SoundCloud. Since its inception, it has become one of the most popular monitoring tools, particularly for cloud-native environments. It is part of the Cloud Native Computing Foundation (CNCF) and works exceptionally well with containerized environments like Kubernetes.
Key features of Prometheus:
Time Series Database (TSDB): Prometheus stores all data as time series, i.e., data points are stored along with a timestamp.
Powerful Query Language (PromQL): Prometheus offers a flexible query language for extracting and analyzing time series data.
Pull-based Architecture: Prometheus scrapes metrics from monitored targets by pulling data from HTTP endpoints.
Alerting System: Prometheus integrates with the Alertmanager to support rule-based alerting.
Prometheus is particularly useful for monitoring server health, application metrics, and containerized environments like Kubernetes.
2. Prometheus Architecture
To understand how Prometheus works, it’s important to understand its architecture. Prometheus consists of several components:
Prometheus Server: The core component responsible for scraping and storing time series data. It uses a custom time series database (TSDB).
Exporters: Components that expose metrics on HTTP endpoints. These are used for exporting data from systems, services, and hardware.
Pushgateway: Prometheus is primarily pull-based, but the Pushgateway allows ephemeral and batch jobs to push their metrics to Prometheus.
Alertmanager: This component handles alerts triggered by Prometheus. It can send notifications via email, Slack, PagerDuty, etc.
PromQL: Prometheus Query Language is used to query the time series data stored in the database.
Grafana (optional): While not part of Prometheus, Grafana is often used to visualize Prometheus data.
Prometheus periodically scrapes data from exporters and stores the time series data in its internal database. Based on the data, Prometheus can trigger alerts and send them to the Alertmanager, which forwards them to the appropriate channels.
3. Setting up Prometheus
Setting up Prometheus is relatively straightforward. Prometheus is distributed as a single binary, which makes installation easy. You can download the binary for your operating system from the official Prometheus website.
4. Data Collection with Exporters
Prometheus uses exporters to collect metrics from various sources. Exporters are components that expose metrics via HTTP endpoints in a format that Prometheus understands. There are several types of exporters:
Node Exporter: Exposes hardware and operating system metrics such as CPU, memory, and disk usage.
Blackbox Exporter: Allows you to probe endpoints via HTTP, HTTPS, DNS, TCP, and ICMP.
Custom Exporters: You can create custom exporters to expose metrics from your own applications or systems.
Installing Node Exporter
The Node Exporter is one of the most commonly used exporters. It provides system-level metrics that are critical for infrastructure monitoring.
5. Writing Prometheus Queries (PromQL)
PromQL is the powerful query language of Prometheus. It allows you to query and aggregate time series data, which can be used for monitoring and alerting purposes.
6. Alerting in Prometheus
Alerting is a critical feature of any monitoring system. Prometheus allows you to define alerting rules based on your PromQL queries. These alerts can then be sent to the Alertmanager for further processing.
7. Monitoring Infrastructure with Prometheus
Monitoring infrastructure with Prometheus involves collecting metrics from different systems such as servers, databases, and cloud services. Prometheus is well-suited for monitoring the health and performance of the following:
Servers: Collect CPU, memory, disk, and network metrics.
Databases: Monitor query performance, connection pools, and other database metrics.
Applications: Monitor application-level metrics like request rates, errors, and latency.
Cloud Services: Use exporters to monitor cloud platforms like AWS, GCP, or Azure.
By setting up exporters on each system, you can gain comprehensive visibility into your infrastructure.
8. Prometheus and Grafana Integration
While Prometheus comes with its own basic UI, integrating it with Grafana provides a more user-friendly and visually appealing way to explore and visualize metrics.
Steps to Integrate Prometheus with Grafana
Install Grafana: Download and install Grafana from the official website.
Add Prometheus as a Data Source:
Navigate to the Grafana dashboard.
Go to “Data Sources” and add Prometheus.
Provide the URL of the Prometheus server (http://localhost:9090).
Create Dashboards: Grafana allows you to create custom dashboards that can visualize Prometheus data using charts, graphs, and tables.
By using Grafana dashboards, you can easily monitor trends, set thresholds, and visualize system performance.
9. Scaling and Managing Prometheus
Prometheus is designed to work in small to medium environments, but as your infrastructure grows, scaling Prometheus becomes necessary. Here are some ways to scale and manage Prometheus:
Sharding: Distribute Prometheus instances across different workloads.
Federation: Use Prometheus federation to aggregate metrics from multiple Prometheus instances.
Retention and Storage: Configure data retention policies and external storage for long-term data storage.
10. Best Practices for Prometheus Monitoring
Use Labels Effectively: Prometheus uses labels to categorize metrics. Make sure to use descriptive labels for better querying and alerting.
Alert on Symptoms, Not Causes: Alerts should be based on high-level symptoms like service unavailability, rather than low-level causes like CPU usage.
Monitor the Monitoring System: Ensure that Prometheus itself is being monitored. You can do this by setting up alerts for Prometheus health.
Keep Queries Simple: While PromQL is powerful, avoid complex queries in production to ensure performance remains high.
11. Real-World Use Cases
Prometheus has been widely adopted by organizations of all sizes for monitoring and alerting in production environments. Some common use cases include:
Monitoring Kubernetes Clusters: Prometheus is often used with Kubernetes to monitor containerized applications.
Application Performance Monitoring (APM): Developers use Prometheus to track request rates, error rates, and latency in microservices architectures.
Infrastructure Monitoring: IT teams monitor system metrics like CPU, memory, and disk usage to ensure system health.
12. Conclusion
Prometheus is a powerful and flexible tool for monitoring and alerting in modern cloud environments. Whether you are monitoring servers, applications, or entire Kubernetes clusters, Prometheus provides the essential tools for collecting, storing, querying, and visualizing metrics. With the addition of Grafana, you can create beautiful, insightful dashboards to keep track of your infrastructure in real-time. By mastering Prometheus, you gain the ability to keep your systems running smoothly and efficiently, ensuring that performance issues are caught before they become critical failures.
Through this Prometheus MasterClass, you’ve learned about its architecture, setting it up, collecting metrics, writing queries, alerting, and best practices. The next step is to start implementing Prometheus in your infrastructure monitoring and alerting strategy.
0 notes
Text
Assess Application and Cluster Readiness
Review Application Dependencies:
Analyze libraries, JDK versions, frameworks (e.g., Spring Boot, Jakarta EE), and external services (databases, APIs).
Identify any Kubernetes-specific configurations (e.g., ConfigMaps, Secrets, environment variables).
Containerization:
Ensure your Java app is containerized using tools like Docker.
Update the Dockerfile if necessary (e.g., for JDK/JRE updates or changes in base image).
2. Prepare Kubernetes Environment
Target Cluster Validation:
Ensure the target Kubernetes cluster is set up and ready.
Check for compatibility with the current cluster’s API version and resources.
Namespace Setup:
Create equivalent namespaces, RBAC roles, and policies in the target cluster.
Storage:
Verify Persistent Volume Claims (PVCs) and ensure similar storage classes are available.
3. Backup and Export Resources
Kubernetes Resources:
Export all application-related resources using kubectl:bashCopy codekubectl get all -n <namespace> -o yaml > resources.yaml
Persistent Data:
Back up database data or persistent volumes using tools like Velero or rsync.
4. Migrate Application Configurations
ConfigMaps and Secrets:
Export existing configurations:bashCopy codekubectl get configmap -n <namespace> -o yaml > configmap.yaml kubectl get secret -n <namespace> -o yaml > secret.yaml
Reapply them in the new cluster:bashCopy codekubectl apply -f configmap.yaml kubectl apply -f secret.yaml
5. Deploy to Target Cluster
Deploy Application:
Use Helm charts, Kubernetes manifests, or CI/CD pipelines to deploy the Java application to the new cluster.
Update the kubeconfig for the target cluster:bashCopy codekubectl config use-context <target-cluster-context> kubectl apply -f resources.yaml
Persistent Volumes:
Ensure data is restored to the persistent volumes if needed.
6. Test the Migration
Validation:
Ensure the application is running as expected (pods, services, and networking).
Run integration and regression tests.
Connectivity:
Validate external service integrations (e.g., databases, APIs).
Check ingress configurations for public access.
7. Cutover and Cleanup
Switch Traffic:
Update DNS or external load balancer to direct traffic to the new cluster.
Monitor:
Use tools like Prometheus, Grafana, or ELK Stack to monitor application health.
Clean Up Old Environment:
After verifying stability, clean up resources in the old cluster.
Tools to Assist in Migration
Velero: For backup and restore of Kubernetes resources and persistent volumes.
Helm: To manage application deployments and upgrades.
Kubernetes Dashboard: For real-time cluster monitoring.
Kubectl Plugins: To enhance CLI functionality.
If you provide more details about the migration (e.g., specific cloud providers or Kubernetes environments), I can offer more tailored advice!
4o
You said:
Migration of 5000 files per hr fix
ChatGPT said:
ChatGPT
If you're migrating a large number of files (e.g., 5000 files per hour) and encountering performance bottlenecks, you can improve the speed and reliability of your file migration by addressing several key areas. Here's a step-by-step guide to optimize file transfer:
1. Identify and Analyze Bottlenecks
File System Bottlenecks:
Check the source and destination disk I/O performance.
Ensure the files are not locked or being used during migration.
Network Bandwidth:
Measure your available network bandwidth using tools like iperf and ensure it can handle the expected load.
File Metadata Overhead:
Small files can add significant overhead due to metadata operations (e.g., file creation, permissions).
2. Optimize Transfer Mechanisms
Use Parallel Processing:
Transfer multiple files concurrently using multithreaded or parallel tools like:
rsync with --max-size and --parallel options.
GNU Parallel for concurrent file transfers.
bashCopy codefind /source/directory -type f | parallel -j8 rsync -a {} /destination/directory
Use a custom script or a library like Python's concurrent.futures for more control.
Batch File Transfers:
Group files into batches (e.g., tar archives) to reduce the overhead of transferring many small files individually.bashCopy codetar -cvf files.tar /source/files && rsync files.tar /destination Extract the files on the destination:bashCopy codetar -xvf files.tar
3. Ensure Network Optimization
Compression:
Compress files during transfer to reduce data volume:bashCopy codersync -az /source/directory /destination/directory
Increase TCP Window Size:
Tweak TCP settings for large transfers using tools like scp or rsync with buffer options:bashCopy codersync --bwlimit=0 --whole-file /source /destination
Use Faster Protocols:
Use optimized file transfer protocols like Rclone, Aspera, or SFTP for high-speed transfer.
4. Improve Source and Destination Performance
Disk Performance:
Optimize disk reads and writes using SSDs for temporary storage or caches.
Ensure the file system supports efficient file handling (e.g., ext4, XFS).
File System Tuning:
For very large numbers of files, tune parameters like inode_cache to handle metadata efficiently.
5. Error Handling and Retry Logic
Retry Failed Transfers:
Use tools like rsync to retry failed files automatically:bashCopy codersync -avz --partial --progress /source /destination
Logging and Monitoring:
Log all transferred files and
4o
You said:
File trsnsfer to s3 improve
ChatGPT said:
ChatGPT
Improving file transfer to Amazon S3 requires addressing both performance and reliability. Below are strategies and tools to optimize large-scale or high-volume file transfers:
1. Use AWS-Specific Tools
AWS CLI with Parallelism:
Use the --multipart-chunk-size-mb and --parallel flags to upload files in parallel and in chunks:bashCopy codeaws s3 cp /local/path s3://your-bucket-name --recursive --storage-class STANDARD_IA --region <region>
Enable parallel transfers: Update your AWS CLI configuration file (~/.aws/config) to increase concurrency:plaintextCopy code[default] s3 = max_concurrent_requests = 10 max_queue_size = 1000 multipart_threshold = 64MB multipart_chunksize = 64MB
AWS DataSync:
Use AWS DataSync for automated, high-performance, large-scale transfers with minimal manual intervention. DataSync can also manage retry and error handling.
2. Optimize S3 Uploads
Multipart Upload:
Use multipart uploads for files larger than 100 MB to improve transfer speed and reliability.
Example using AWS CLI:bashCopy codeaws s3api create-multipart-upload --bucket your-bucket-name --key file_key
Automate multipart uploads with the AWS SDK or tools like boto3 for Python.
Use the Correct Storage Class:
Choose the appropriate storage class to save costs and improve upload speeds:
STANDARD (default): High performance for frequently accessed data.
INTELLIGENT_TIERING: Automatically optimizes storage costs for infrequently accessed files.
3. Improve Network Performance
Enable Transfer Acceleration:
Use S3 Transfer Acceleration for faster uploads over long distances by leveraging AWS edge locations:bashCopy codeaws s3 cp /local/path s3://your-bucket-name --region <region> --endpoint-url https://<bucket-name>.s3-accelerate.amazonaws.com
Compression:
Compress files before transferring to reduce data size:bashCopy codetar -czvf archive.tar.gz /local/path && aws s3 cp archive.tar.gz s3://your-bucket-name
Optimize Network:
Use AWS Direct Connect or a high-bandwidth internet connection for large-scale transfers.
Monitor latency and bandwidth with tools like iperf.
4. Automate and Parallelize Transfers
Rclone:
Use rclone for high-speed S3-compatible transfers with parallelism and retry capabilities:bashCopy coderclone copy /local/path s3:your-bucket-name --transfers 16 --s3-upload-concurrency 16
GNU Parallel:
Transfer files concurrently by splitting file lists:bashCopy codefind /local/path -type f | parallel -j10 aws s3 cp {} s3://your-bucket-name
5. Error Handling and Retry
Retry Mechanisms:
Use tools or scripts that automatically retry failed uploads.
AWS CLI has built-in retry logic; increase retries if necessary:bashCopy codeaws s3 cp --cli-read-timeout 600 --cli-connect-timeout 600 /local/path s3://your-bucket-name
Chunked Retry:
Break large transfers into smaller, manageable chunks and retry failed chunks only.
6. Monitor and Optimize Transfers
AWS CloudWatch Metrics:
Monitor transfer performance and error rates in real-time.
S3 Inventory:
Use S3 inventory reports to validate uploaded files.
AWS SDKs or Custom Scripts:
Build custom monitoring and retry logic with SDKs like boto3 (Python).
Example Optimized Upload Command
bash
Copy code
aws s3 cp /local/path s3://your-bucket-name --recursive --storage-class STANDARD --region us-east-1 --cli-read-timeout 600 --cli-connect-timeout 600
When to Use Snowball or Snowmobile
For extremely large datasets (terabytes or petabytes), use AWS Snowball or AWS Snowmobile for offline data transfer to S3.
These steps can dramatically improve the efficiency and reliability of your file transfer process to S3. Let me know if you need help implementing any of these!
4o
You said:
Improve fole transfers
ChatGPT said:
ChatGPT
Improving file transfer performance and reliability, whether between servers, local systems, or to cloud storage like Amazon S3, involves a combination of strategies. Here are some best practices for improving file transfers:
1. Optimize the File Transfer Process
Parallelize Transfers
Transfer multiple files concurrently to improve throughput:
Use tools like rsync, scp, or cloud-specific SDKs with multi-threading capabilities.
Example with rsync:bashCopy codersync -azP --info=progress2 --max-size=100M --exclude="*.tmp" /source/ /destination/
Batch Small Files
Small files cause metadata overhead during transfer. Bundle them into archives:bashCopy codetar -czvf archive.tar.gz /source/ Transfer the archive, then extract on the destination:bashCopy codetar -xzvf archive.tar.gz
2. Use High-Performance Transfer Tools
Rclone
Ideal for cloud storage and large-scale transfers with parallelism:bashCopy coderclone copy /source/ remote:bucket-name --transfers=16 --checkers=8
GNU Parallel
Parallelize file uploads/downloads:bashCopy codefind /source/ -type f | parallel -j8 scp {} user@destination:/target/
Multithreaded Tools
Use tools with built-in multithreading, such as bbcp, Aspera, or scp (with parallel scripts).
3. Network Optimization
Compression
Compress files before transfer to reduce the amount of data transmitted:bashCopy codegzip largefile.txt Or combine with the transfer:bashCopy codetar czf - /source/ | ssh user@destination "tar xzf - -C /target/"
Bandwidth Management
Limit bandwidth usage to prevent throttling:
With rsync:bashCopy codersync --bwlimit=1000 -az /source/ /destination/
Use TCP tuning options to optimize network transfer rates:bashCopy codesysctl -w net.ipv4.tcp_window_scaling=1
Use Faster Protocols
Use optimized transfer protocols:
SFTP: Secure but slower for high-volume transfers.
Rsync/SSH: Efficient for incremental and large transfers.
Aspera: High-speed UDP-based protocol.
Enable Transfer Acceleration (Cloud)
For Amazon S3:bashCopy codeaws s3 cp /source/ s3://your-bucket/ --region <region> --endpoint-url https://<bucket-name>.s3-accelerate.amazonaws.com
4. Error Handling and Resilience
Resume Transfers
Use tools that support resuming failed transfers:
Rsync:bashCopy codersync -az --partial /source/ /destination/
AWS CLI:bashCopy codeaws s3 cp --continue /source/ s3://bucket-name/
Retry Logic
Implement retry logic for failed transfers using scripts or tools.
Example using bash:bashCopy codefor i in {1..5}; do scp file user@destination:/target/ && break || sleep 5 done
5. Monitor and Analyze Performance
Real-Time Monitoring
Monitor progress with tools:
Rsync: --progress flag.
SCP: Wrap in pv for progress visualization:bashCopy codetar cf - /source/ | pv | ssh user@destination "tar xf - -C /target/"
Analyze Bottlenecks
Use tools like iperf or nload to check network performance.
Use iotop or dstat to monitor disk I/O on both source and destination.
6. Scale with Advanced Solutions
Distributed File Transfer
Use tools like Globus for efficient distributed data transfers.
Data Transfer Appliances
For extremely large datasets, consider appliances like AWS Snowball or offline methods to ship data physically.
Content Delivery Networks (CDNs)
Use CDNs for faster file distribution to end users.
By combining these strategies—parallelism, compression, protocol optimization, and monitoring—you can significantly enhance file transfer speed and reliability. Let me know if you'd like further customization for a specific use case!
4o
You said:
Threadpool
ChatGPT said:
ChatGPT
A thread pool is a collection of pre-initialized worker threads that stand ready to perform tasks. Instead of creating and destroying threads for each task, a thread pool manages a set of reusable threads, improving performance and resource utilization in multi-threaded applications.
Here’s how to effectively use and optimize thread pools in your application.
Why Use a Thread Pool?
Performance: Reduces the overhead of creating and destroying threads repeatedly.
Resource Management: Controls the number of concurrent threads, preventing system overload.
Scalability: Allows a controlled environment for task execution, making it easier to scale applications.
Key Concepts of Thread Pools
Core Threads: Minimum number of threads that are always kept alive.
**Max Threads
4o
You said:
Improve java spring file transfer
ChatGPT said:
ChatGPT
Improving file transfer in a Java Spring application involves optimizing both the code and the underlying infrastructure. Below are strategies to enhance file transfer performance and reliability.
1. Optimize File Transfer Code
Use Streaming for Large Files
Avoid loading the entire file into memory; instead, use streaming:javaCopy code@PostMapping("/upload") public ResponseEntity<String> uploadFile(@RequestParam("file") MultipartFile file) throws IOException { try (InputStream inputStream = file.getInputStream()) { // Process the input stream directly // Example: Save the file Files.copy(inputStream, Paths.get("target-directory/" + file.getOriginalFilename()), StandardCopyOption.REPLACE_EXISTING); } return ResponseEntity.ok("File uploaded successfully!"); }
Enable Asynchronous File Transfers
Use Spring's @Async annotation for non-blocking file uploads/downloads:javaCopy code@Async public CompletableFuture<String> uploadFileAsync(MultipartFile file) { // File processing logic return CompletableFuture.completedFuture("Upload Complete"); }
Use Chunked Uploads for Large Files
Break large files into smaller chunks for efficient transfer and to handle interruptions gracefully:javaCopy code@PostMapping("/uploadChunk") public ResponseEntity<String> uploadChunk(@RequestParam("chunk") MultipartFile chunk, @RequestParam("fileId") String fileId) { // Append chunk data to the file return ResponseEntity.ok("Chunk uploaded successfully!"); }
2. Optimize for Cloud Storage (e.g., AWS S3, Azure Blob)
Use SDKs for Direct Uploads
Use cloud-specific SDKs (e.g., AWS SDK for S3) to upload files directly to cloud storage instead of saving locally first:javaCopy code@PostMapping("/uploadToS3") public ResponseEntity<String> uploadToS3(@RequestParam("file") MultipartFile file) throws IOException { AmazonS3 s3Client = AmazonS3ClientBuilder.defaultClient(); String bucketName = "your-bucket-name"; s3Client.putObject(bucketName, file.getOriginalFilename(), file.getInputStream(), new ObjectMetadata()); return ResponseEntity.ok("File uploaded to S3!"); }
Enable S3 Transfer Acceleration
Use Transfer Acceleration for faster uploads to Amazon S3:javaCopy codeAmazonS3 s3Client = AmazonS3ClientBuilder.standard() .withAccelerateModeEnabled(true) .build();
3. Optimize File Transfer in REST APIs
Enable Compression
Compress file responses to reduce data size:yamlCopy codespring: servlet: multipart: enabled: true max-file-size: 50MB max-request-size: 50MB gzip: enabled: true min-size: 1024
Use HTTP/2
Switch to HTTP/2 for better concurrency and reduced latency:yamlCopy codeserver: http2: enabled: true
Resume Interrupted Uploads
Use ETag or file metadata to allow resumable file uploads:javaCopy code@PostMapping("/resumeUpload") public ResponseEntity<String> resumeUpload(@RequestParam("file") MultipartFile file, @RequestParam("offset") Long offset) { // Resume logic based on offset return ResponseEntity.ok("Upload resumed!"); }
4. Parallelize File Transfers
Multithreaded File Upload
Use a ThreadPoolExecutor or Spring's TaskExecutor:Copy code
In addition to using @Async, there are other strategies and tools to improve file transfer performance and reliability in a Java Spring application. Here are some approaches:
1. Reactive Programming with Spring WebFlux
For truly non-blocking and asynchronous file transfers, use Spring WebFlux:
Streaming File Upload:javaCopy code@PostMapping(value = "/upload", consumes = MediaType.MULTIPART_FORM_DATA_VALUE) public Mono<Void> uploadFile(Flux<FilePart> filePartFlux) { return filePartFlux.flatMap(filePart -> { Path path = Paths.get("target-directory/" + filePart.filename()); return filePart.transferTo(path); }).then(); }
Streaming File Download:javaCopy code@GetMapping(value = "/download", produces = MediaType.APPLICATION_OCTET_STREAM_VALUE) public Mono<ResponseEntity<Resource>> downloadFile() { Path path = Paths.get("target-directory/large-file.txt"); return Mono.just(ResponseEntity.ok() .header(HttpHeaders.CONTENT_DISPOSITION, "attachment; filename=large-file.txt") .body(new FileSystemResource(path))); }
2. Use CompletableFuture and ExecutorService
Combine CompletableFuture with a custom ExecutorService for better control:javaCopy code@PostMapping("/upload") public CompletableFuture<String> uploadFile(@RequestParam("file") MultipartFile file) { ExecutorService executor = Executors.newFixedThreadPool(4); return CompletableFuture.supplyAsync(() -> { try { // File processing logic Files.copy(file.getInputStream(), Paths.get("target/" + file.getOriginalFilename()), StandardCopyOption.REPLACE_EXISTING); return "File uploaded successfully!"; } catch (IOException e) { throw new RuntimeException("File upload failed!", e); } }, executor); }
3. Apache Kafka for Asynchronous Processing
Use Apache Kafka to decouple file upload from processing:
Producer sends file metadata to Kafka after upload:javaCopy code@PostMapping("/upload") public ResponseEntity<String> uploadFile(@RequestParam("file") MultipartFile file) throws IOException { // Save the file Files.copy(file.getInputStream(), Paths.get("target/" + file.getOriginalFilename())); // Send metadata to Kafka kafkaTemplate.send("file-topic", file.getOriginalFilename()); return ResponseEntity.ok("File uploaded and queued for processing!"); }
Consumer processes files asynchronously:javaCopy code@KafkaListener(topics = "file-topic", groupId = "file-group") public void processFile(String fileName) { // Process the file Path path = Paths.get("target/" + fileName); System.out.println("Processing file: " + path); }
4. Chunked File Transfers
Handle large files by uploading them in chunks:
Frontend sends file chunks with an identifier.
Backend reconstructs the file:javaCopy code@PostMapping("/uploadChunk") public ResponseEntity<String> uploadChunk(@RequestParam("chunk") MultipartFile chunk, @RequestParam("fileId") String fileId, @RequestParam("chunkNumber") int chunkNumber) { Path path = Paths.get("target/" + fileId + "_" + chunkNumber); try { Files.copy(chunk.getInputStream(), path, StandardCopyOption.REPLACE_EXISTING); } catch (IOException e) { return ResponseEntity.status(HttpStatus.INTERNAL_SERVER_ERROR).body("Failed to upload chunk"); } return ResponseEntity.ok("Chunk uploaded successfully!"); }
Reassemble chunks when all are uploaded.
5. WebSockets for Real-Time Progress
Use WebSockets to provide real-time feedback on file transfer progress:javaCopy code@Controller public class WebSocketController { @MessageMapping("/uploadStatus") @SendTo("/topic/progress") public String sendProgress(String status) { return status; } }
Send progress updates from the server while uploading:javaCopy codesimpMessagingTemplate.convertAndSend("/topic/progress", "50% completed");
6. Redis or Database Queues
Use a Redis queue or a database to handle file metadata asynchronously.
Enqueue metadata after upload:javaCopy coderedisTemplate.opsForList().leftPush("fileQueue", fileMetadata);
Process the queue in the background:javaCopy codeString metadata = redisTemplate.opsForList().rightPop("fileQueue");
7. Use MultipartConfig for Large Files
Configure multipart file handling for large files in application.properties:propertiesCopy codespring.servlet.multipart.max-file-size=1GB spring.servlet.multipart.max-request-size=2GB
Custom bean for fine-tuning:javaCopy code@Bean public MultipartConfigElement multipartConfigElement() { MultipartConfigFactory factory = new MultipartConfigFactory(); factory.setMaxFileSize("1GB"); factory.setMaxRequestSize("2GB"); return factory.createMultipartConfig(); }
8. Use AWS S3 for Direct Uploads
Use pre-signed URLs to offload upload work to the client:javaCopy code@GetMapping("/generatePresignedUrl") public ResponseEntity<String> generatePresignedUrl(@RequestParam String fileName) { AmazonS3 s3Client = AmazonS3ClientBuilder.defaultClient(); GeneratePresignedUrlRequest generatePresignedUrlRequest = new GeneratePresignedUrlRequest("bucket-name", fileName) .withMethod(HttpMethod.PUT) .withExpiration(new Date(System.currentTimeMillis() + 3600 * 1000)); URL url = s3Client.generatePresignedUrl(generatePresignedUrlRequest); return ResponseEntity.ok(url.toString()); }
The client uploads directly to S3 using the URL.
9. Optimize File Transfer for High Performance
Compression
Compress files before upload to reduce transfer size:javaCopy codebyte[] compressedData = compress(file.getBytes()); Files.write(Paths.get("compressed-file.gz"), compressedData);
Load Balancing
Use a load balancer (e.g., AWS ALB or NGINX) for scalable upload endpoints.
Retry Logic
Implement retries for failed transfers to improve reliability:javaCopy codeint maxRetries = 3; while (retries < maxRetries) { try { // Attempt file upload break; } catch (IOException e) { retries++; if (retries == maxRetries) { throw e; } } }
These strategies can enhance file transfer performance, scalability, and reliability in Java Spring applications. Let me know if you need code examples for specific use cases!
4o
You said:
S3 relaibility
ChatGPT said:
ChatGPT
Ensuring reliability when transferring files to Amazon S3 involves minimizing failures, handling errors effectively, and ensuring data integrity. Below are best practices and techniques to achieve reliable file transfers to S3:
1. Use Multipart Upload for Large Files
Multipart uploads split large files into smaller parts, upload them in parallel, and reassemble them in S3. This improves reliability and speeds up transfers.
Example Using AWS SDK (Java)
java
Copy code
AmazonS3 s3Client = AmazonS3ClientBuilder.defaultClient(); String bucketName = "your-bucket-name"; String fileName = "large-file.zip"; String keyName = "uploads/" + fileName; File file = new File(fileName); TransferManager tm = TransferManagerBuilder.standard().withS3Client(s3Client).build(); Upload upload = tm.upload(bucketName, keyName, file); try { upload.waitForCompletion(); System.out.println("File uploaded successfully!"); } catch (AmazonClientException e) { System.err.println("Upload failed: " + e.getMessage()); }
2. Use Retry Logic
Add retry mechanisms to handle intermittent network issues or service interruptions.
AWS SDK Retry Settings
The AWS SDK retries failed requests automatically, but you can customize it:
java
Copy code
ClientConfiguration config = new ClientConfiguration(); config.setRetryPolicy(PredefinedRetryPolicies.getDefaultRetryPolicyWithCustomMaxRetries(5)); AmazonS3 s3Client = AmazonS3ClientBuilder.standard() .withClientConfiguration(config) .build();
3. Enable Transfer Acceleration
Transfer Acceleration uses AWS edge locations to improve upload speeds over long distances.
Enable Transfer Acceleration in S3
Enable it in the S3 bucket settings.
Update your client code to use the accelerated endpoint:
java
Copy code
AmazonS3 s3Client = AmazonS3ClientBuilder.standard() .withAccelerateModeEnabled(true) .build();
4. Validate Data Integrity
Use MD5 checksums to ensure the uploaded file matches the original file.
AWS CLI Example
bash
Copy code
aws s3 cp file.txt s3://your-bucket/ --content-md5 <calculated-md5>
Java Example
java
Copy code
String md5 = Base64.getEncoder().encodeToString(DigestUtils.md5(new FileInputStream(file))); ObjectMetadata metadata = new ObjectMetadata(); metadata.setContentMD5(md5); PutObjectRequest request = new PutObjectRequest(bucketName, keyName, new FileInputStream(file), metadata); s3Client.putObject(request);
5. Monitor File Transfers
Use CloudWatch Metrics to monitor S3 request success, failures, and latencies.
Monitor transfer progress with TransferManager in the AWS SDK:
java
Copy code
TransferManager tm = TransferManagerBuilder.standard().withS3Client(s3Client).build(); Upload upload = tm.upload(bucketName, keyName, file); upload.addProgressListener(progressEvent -> { System.out.println("Transferred bytes: " + progressEvent.getBytesTransferred()); }); upload.waitForCompletion();
6. Handle Failures Gracefully
Use Resumable Transfers for interrupted uploads with TransferManager:
java
Copy code
TransferManager tm = TransferManagerBuilder.standard().build(); Upload upload = tm.upload(bucketName, keyName, file); // Add a progress listener upload.addProgressListener((ProgressListener) progressEvent -> { System.out.println("Transferred: " + progressEvent.getBytesTransferred()); }); // Graceful failure handling try { upload.waitForCompletion(); } catch (AmazonClientException e) { System.err.println("Error occurred: " + e.getMessage()); }
7. Use Pre-Signed URLs
Generate pre-signed URLs for reliable, time-limited uploads directly from the client, reducing the load on your server.
Generate Pre-Signed URL
java
Copy code
GeneratePresignedUrlRequest generatePresignedUrlRequest = new GeneratePresignedUrlRequest(bucketName, keyName) .withMethod(HttpMethod.PUT) .withExpiration(new Date(System.currentTimeMillis() + 3600 * 1000)); URL url = s3Client.generatePresignedUrl(generatePresignedUrlRequest); System.out.println("Pre-Signed URL: " + url);
8. Use S3 Event Notifications
Configure S3 Event Notifications to trigger AWS Lambda or SNS for post-upload validation, processing, or alerting on failures.
Example: Notification for Upload Completion
Configure your S3 bucket to send an event to an SQS queue or Lambda function upon successful upload.
9. Leverage Data Replication
Use S3 Cross-Region Replication (CRR) or Same-Region Replication (SRR) for redundancy.
Automatically replicate files to another bucket for disaster recovery.
10. Automate with AWS DataSync
Use AWS DataSync for automated and highly reliable file transfers between on-premises storage and S3. It includes built-in retry and integrity checks.
11. Optimize Network Performance
Compress files before uploading:javaCopy codeFiles.write(Paths.get("compressed-file.gz"), gzipCompress(fileContent));
Use efficient transfer protocols (e.g., HTTP/2 if supported by your client).
12. Secure Transfers
Always use HTTPS for secure communication.
Use S3 Bucket Policies and IAM Roles to restrict access to authorized users.
Example: Complete Reliable Upload Function
java
Copy code
public void reliableUpload(File file, String bucketName, String keyName) { AmazonS3 s3Client = AmazonS3ClientBuilder.defaultClient(); TransferManager tm = TransferManagerBuilder.standard().withS3Client(s3Client).build(); try { // Multipart upload Upload upload = tm.upload(bucketName, keyName, file); upload.addProgressListener((ProgressListener) progressEvent -> { System.out.println("Transferred bytes: " + progressEvent.getBytesTransferred()); }); upload.waitForCompletion(); System.out.println("File uploaded successfully!"); } catch (AmazonClientException e) { System.err.println("Upload failed: " + e.getMessage()); } finally { tm.shutdownNow(); } }
0 notes
Text
Introduction to Prometheus MasterClass: Infra Monitoring & Alerting

Prometheus MasterClass: Infra Monitoring & Alerting is an essential course for anyone looking to dive deep into infrastructure monitoring and alerting with Prometheus. In today's ever-evolving tech landscape, keeping a keen eye on your systems is crucial. With constant changes and high demands on performance, monitoring is more than just an operational necessity—it’s a strategic tool to ensure reliability, security, and smooth functioning of systems.
What is Prometheus?
Prometheus is an open-source monitoring and alerting tool designed for reliability and scalability. Initially developed by SoundCloud, Prometheus has grown to become one of the most popular choices for system monitoring, especially in cloud environments. The tool is perfect for tracking system health, collecting performance data, and triggering alerts when things go wrong.
Why Learn Prometheus?
Let’s face it—infrastructure monitoring is no longer just a nice-to-have; it’s a must-have for businesses. With the growth of cloud computing and the rise of containerized applications like Docker and Kubernetes, systems are becoming more complex. When systems fail, even for a few minutes, it can lead to massive losses, from revenue to customer trust. Prometheus helps avoid this by enabling real-time monitoring and alerting, which gives you the ability to identify and fix issues before they spiral out of control.
In this Prometheus MasterClass: Infra Monitoring & Alerting, you'll be guided through setting up and using Prometheus for effective system monitoring, as well as integrating it with Grafana for data visualization and setting up powerful alerting mechanisms.
Key Features of Prometheus
Multi-Dimensional Data Model: Prometheus’s core strength is its ability to model time series data with multiple dimensions. This allows you to filter and aggregate data in real-time, which is crucial for quick and effective troubleshooting.
Customizable Alerts: With Prometheus Alertmanager, you can set up highly customizable alerts based on thresholds and other metrics that matter most to your infrastructure.
Scalability: Whether you are monitoring a few services or thousands of nodes, Prometheus can handle it, thanks to its horizontally scalable design.
Pull-based Model: Unlike many other monitoring systems that rely on pushing data, Prometheus pulls data from configured endpoints, which makes it more resilient to intermittent network issues.
PromQL: The Prometheus Query Language (PromQL) is a flexible, powerful query language that helps you extract precise metrics in real-time, making it easy to set up efficient alerts and dashboards.
Monitoring Cloud Infrastructure
With the rise of cloud-native architectures and services like Amazon Web Services (AWS), Google Cloud Platform (GCP), and Microsoft Azure, the need for real-time monitoring has grown exponentially. Prometheus is designed to easily integrate with cloud and microservices environments. From Kubernetes clusters to individual EC2 instances, Prometheus can monitor almost anything.
Integrating Prometheus with Grafana
While Prometheus is excellent at collecting and storing metrics, it lacks in terms of data visualization. That’s where Grafana steps in. Grafana allows you to create highly customizable and visually appealing dashboards to view your Prometheus data in real time. Together, they form a powerful combo for infrastructure monitoring.
Alerts That Matter
Not all alerts are created equal. Setting up alerts that focus on the right metrics—such as CPU utilization, memory leaks, or service availability—is crucial to avoiding alert fatigue. In this Prometheus MasterClass, you'll learn how to configure Alertmanager to trigger the right type of alerts at the right time, and even how to integrate it with communication platforms like Slack or PagerDuty for real-time notifications.
Why You Need Prometheus for Monitoring?
One of the biggest challenges in today’s tech industry is maintaining system reliability. Downtime, system crashes, or unexpected failures can result in serious consequences for your business. Prometheus ensures that you can prevent these problems before they affect your users. Here’s how:
Proactive Monitoring: Get ahead of problems before they affect your users.
Improved Performance: With real-time metrics, you can optimize system performance.
Cost Efficiency: Reduce downtime and avoid costly system failures.
Setting Up Prometheus in Kubernetes
One of the most popular use cases for Prometheus is its integration with Kubernetes. In Kubernetes environments, Prometheus monitors all components—from pods and services to nodes and applications. It’s a must-have tool if you’re running large-scale, containerized applications that require 24/7 monitoring.
Setting up Prometheus in Kubernetes is surprisingly simple. Using the Prometheus Operator, you can automate the setup process, allowing you to focus on fine-tuning your metrics collection and alerting strategies.
Real-World Use Cases of Prometheus
Netflix: The Streaming Giant
Netflix uses Prometheus to monitor its sprawling cloud infrastructure, ensuring uptime and system availability for its millions of global users. By setting up custom alerts and using Prometheus with Grafana, Netflix has dramatically reduced downtime.
DigitalOcean: The Cloud Provider
DigitalOcean uses Prometheus to monitor its entire cloud environment, including compute resources and databases. Prometheus’s pull-based data model allows the company to efficiently monitor system health and resolve issues before they become customer problems.
PAP Meaning in Monitoring Context
You might be wondering, what does PAP stand for in monitoring? PAP stands for Policy Administration Point. It is a crucial concept in access control systems where it serves as the component responsible for managing policies. In the context of infrastructure monitoring, PAP plays a role in ensuring that certain policies—such as alert thresholds and access permissions—are adhered to, thereby enhancing the security and reliability of your system.
Why Alert Fatigue is a Big Deal
One of the hidden dangers of infrastructure monitoring is alert fatigue. When you set up too many alerts, especially for low-priority issues, your team becomes desensitized. This can result in them missing critical alerts. Learning how to set up meaningful alerts with Prometheus Alertmanager is crucial for avoiding this trap.
Best Practices for Prometheus Monitoring
Start with Critical Metrics: Focus on the most important metrics like CPU usage, memory leaks, and service uptime.
Set Proper Alert Thresholds: Don’t be too aggressive with alert thresholds; instead, use historical data to set realistic limits.
Use Grafana for Visualization: Create dashboards for easy monitoring and visualization of your key metrics.
Prometheus vs Other Monitoring Tools
When it comes to monitoring, Prometheus is often compared to other tools like Nagios, Zabbix, or even newer tools like Datadog and New Relic. While these tools are excellent in their own right, Prometheus stands out for its open-source nature, scalability, and deep integration with modern systems like Kubernetes.
Nagios: Focuses more on system-level monitoring.
Zabbix: More suited for network and server monitoring.
Datadog and New Relic: Commercial, SaaS-based monitoring tools that offer additional features but come at a cost.
Prometheus offers an open-source, flexible alternative that can scale with your infrastructure and doesn’t lock you into a commercial product ecosystem.
Conclusion: Take Your Monitoring to the Next Level
Whether you're running a small startup or managing a large-scale enterprise infrastructure, Prometheus offers a powerful, flexible, and scalable solution for infrastructure monitoring and alerting. This Prometheus MasterClass: Infra Monitoring & Alerting will guide you through every aspect of setting up, using, and optimizing Prometheus for your unique needs.
Monitoring is not just about preventing disasters; it's about improving your infrastructure’s performance and ensuring your systems remain reliable and efficient. So, why wait? Take control of your infrastructure monitoring today with Prometheus!
0 notes
Text
Observability and Monitoring in the Cloud: Ensuring Seamless Operations
In today’s cloud-native world, where applications are deployed at scale and distributed across multiple regions, maintaining high availability and performance is more critical than ever. As organizations increasingly migrate to the cloud, the need for effective observability and monitoring solutions has become a top priority. Let's dive into what observability and monitoring mean in the cloud context, why they are essential, and how to implement them effectively.
What is Observability vs. Monitoring?
While the terms are often used interchangeably, observability and monitoring are distinct concepts:
Monitoring is the practice of collecting predefined metrics, logs, and traces to track the health and performance of systems. It helps answer questions like “Is my application up and running?” or “What is the current CPU usage?”
Observability, on the other hand, is about gaining a deeper understanding of system behavior by analyzing telemetry data (metrics, logs, and traces) to answer more complex questions like “Why did this service fail?” or “What is causing latency spikes?”
Monitoring tells you what is wrong, while observability helps you understand why it’s happening.
Why is Observability Crucial in the Cloud?
Cloud environments are dynamic and complex. Instances are ephemeral, microservices are distributed, and traffic patterns can change rapidly. Traditional monitoring solutions struggle to keep up because they rely on static infrastructure and predefined thresholds. This is where observability shines:
Dynamic Scaling: Monitor and adapt to scaling events in real-time.
Distributed Tracing: Track requests as they flow through multiple microservices.
Root Cause Analysis: Quickly identify and resolve issues, minimizing downtime.
Enhanced Security: Detect anomalies that could indicate security breaches.
Key Components of Cloud Observability
To achieve comprehensive observability, you need to leverage three main telemetry data types:
Metrics: Quantitative data representing system performance (e.g., CPU usage, memory consumption, request rates).
Logs: Detailed event records for debugging and auditing.
Traces: End-to-end request tracking across distributed services to understand flow and latency.
Implementing Observability in the Cloud
To implement a robust observability strategy in your cloud environment, consider the following best practices:
Unified Data Collection: Use centralized tools like Prometheus, Grafana, and Elastic Stack to gather and visualize metrics, logs, and traces.
Distributed Tracing: Implement tracing tools such as Jaeger or OpenTelemetry to monitor microservices communication.
Automated Alerts: Set up intelligent alerting systems to notify teams of anomalies before they impact end-users.
AI-Powered Insights: Leverage machine learning for anomaly detection and predictive analytics.
Integration with CI/CD: Incorporate observability into your CI/CD pipeline to ensure continuous delivery and deployment without compromising system health.
Top Cloud-Native Observability Tools
Several powerful tools can help you achieve observability and monitoring in the cloud:
Prometheus: Open-source monitoring and alerting toolkit, ideal for cloud-native environments.
Grafana: Visualization tool for metrics, logs, and traces.
Elastic Stack (ELK): Comprehensive logging and analysis platform.
Jaeger: Open-source, end-to-end distributed tracing.
Datadog, New Relic, and Dynatrace: Full-stack observability platforms with advanced AI-driven insights.
Challenges in Cloud Observability
While observability offers numerous benefits, it comes with challenges:
Data Overload: Managing massive volumes of telemetry data can be overwhelming.
Complexity: Distributed systems and microservices add complexity to tracing and debugging.
Cost Management: Storing and processing telemetry data can become expensive.
Security and Compliance: Ensuring data privacy and compliance with regulations is crucial.
Future Trends in Cloud Observability
As cloud-native architectures continue to evolve, the observability landscape will also progress. Here are some emerging trends to watch:
AI-Driven Observability: Enhanced anomaly detection and root cause analysis using machine learning models.
OpenTelemetry Standardization: Industry-wide adoption of OpenTelemetry as the standard for telemetry data collection.
Serverless Observability: Advanced tools tailored for serverless computing environments.
Observability as Code: Integrating observability configurations into Infrastructure as Code (IaC) pipelines.
Conclusion
Observability and monitoring are no longer optional in today’s cloud-native world—they are essential for maintaining system reliability, performance, and security. By embracing modern observability practices and leveraging the right tools, organizations can gain deep insights into their systems, quickly resolve issues, and deliver exceptional user experiences.
Are you ready to take your cloud monitoring and observability to the next level? HawkStack Technologies specializes in end-to-end observability solutions tailored to your unique cloud environment. Contact us today to learn more about how we can help you achieve seamless operations and maximum uptime.
For more details www.hawkstack.com
0 notes
Text
Your Path to Becoming a DevOps Engineer
Thinking about a career as a DevOps engineer? Great choice! DevOps engineers are pivotal in the tech world, automating processes and ensuring smooth collaboration between development and operations teams. Here’s a comprehensive guide to kick-starting your journey with the Best Devops Course.
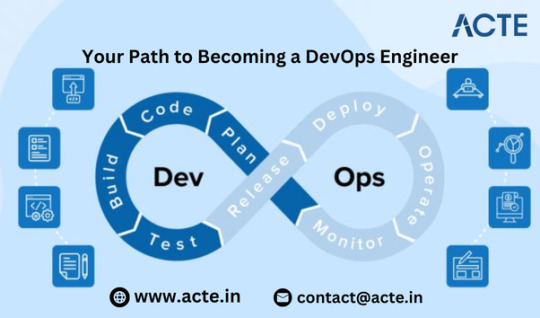
Grasping the Concept of DevOps
Before you dive in, it’s essential to understand what DevOps entails. DevOps merges "Development" and "Operations" to boost collaboration and efficiency by automating infrastructure, workflows, and continuously monitoring application performance.
Step 1: Build a Strong Foundation
Start with the Essentials:
Programming and Scripting: Learn languages like Python, Ruby, or Java. Master scripting languages such as Bash and PowerShell for automation tasks.
Linux/Unix Basics: Many DevOps tools operate on Linux. Get comfortable with Linux command-line basics and system administration.
Grasp Key Concepts:
Version Control: Familiarize yourself with Git to track code changes and collaborate effectively.
Networking Basics: Understand networking principles, including TCP/IP, DNS, and HTTP/HTTPS.
If you want to learn more about ethical hacking, consider enrolling in an Devops Online course They often offer certifications, mentorship, and job placement opportunities to support your learning journey.
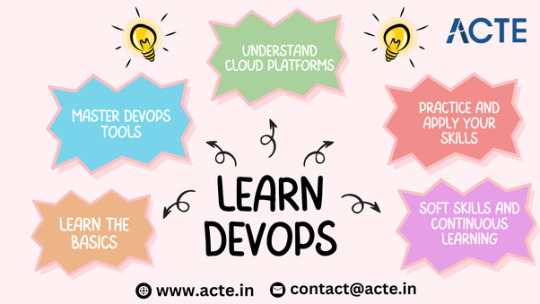
Step 2: Get Proficient with DevOps Tools
Automation Tools:
Jenkins: Learn to set up and manage continuous integration/continuous deployment (CI/CD) pipelines.
Docker: Grasp containerization and how Docker packages applications with their dependencies.
Configuration Management:
Ansible, Puppet, and Chef: Use these tools to automate the setup and management of servers and environments.
Infrastructure as Code (IaC):
Terraform: Master Terraform for managing and provisioning infrastructure via code.
Monitoring and Logging:
Prometheus and Grafana: Get acquainted with monitoring tools to track system performance.
ELK Stack (Elasticsearch, Logstash, Kibana): Learn to set up and visualize log data.
Consider enrolling in a DevOps Online course to delve deeper into ethical hacking. These courses often provide certifications, mentorship, and job placement opportunities to support your learning journey.
Step 3: Master Cloud Platforms
Cloud Services:
AWS, Azure, and Google Cloud: Gain expertise in one or more major cloud providers. Learn about their services, such as compute, storage, databases, and networking.
Cloud Management:
Kubernetes: Understand how to manage containerized applications with Kubernetes.
Step 4: Apply Your Skills Practically
Hands-On Projects:
Personal Projects: Develop your own projects to practice setting up CI/CD pipelines, automating tasks, and deploying applications.
Open Source Contributions: Engage with open-source projects to gain real-world experience and collaborate with other developers.
Certifications:
Earn Certifications: Consider certifications like AWS Certified DevOps Engineer, Google Cloud Professional DevOps Engineer, or Azure DevOps Engineer Expert to validate your skills and enhance your resume.
Step 5: Develop Soft Skills and Commit to Continuous Learning
Collaboration:
Communication: As a bridge between development and operations teams, effective communication is vital.
Teamwork: Work efficiently within a team, understanding and accommodating diverse viewpoints and expertise.
Adaptability:
Stay Current: Technology evolves rapidly. Keep learning and stay updated with the latest trends and tools in the DevOps field.
Problem-Solving: Cultivate strong analytical skills to troubleshoot and resolve issues efficiently.
Conclusion
Begin Your Journey Today: Becoming a DevOps engineer requires a blend of technical skills, hands-on experience, and continuous learning. By building a strong foundation, mastering essential tools, gaining cloud expertise, and applying your skills through projects and certifications, you can pave your way to a successful DevOps career. Persistence and a passion for technology will be your best allies on this journey.
0 notes
Text
DevOps Monitoring Tools: Prometheus, Grafana, and Datadog Explained
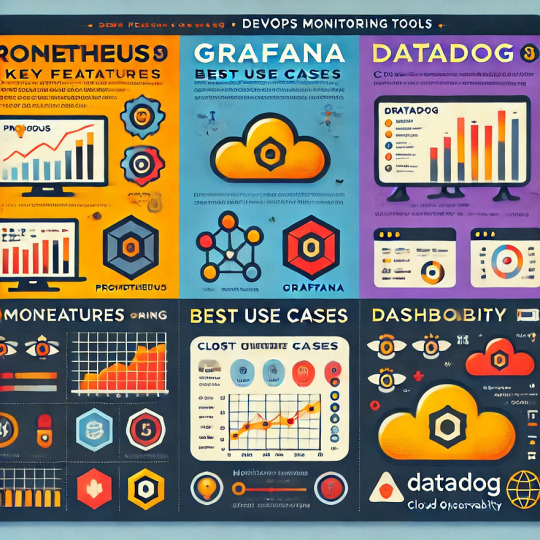
Introduction
Monitoring is essential in DevOps for ensuring application reliability, performance, and security.
Prometheus, Grafana, and Datadog are three widely used monitoring tools.
This guide explores their features, use cases, and how they fit into a DevOps workflow.
1. Prometheus: The Open-Source Monitoring System
What is Prometheus?
A time-series database and monitoring tool originally developed by SoundCloud.
Uses a pull-based model to collect metrics from applications and infrastructure.
Ideal for cloud-native and Kubernetes environments.
Key Features
Multi-dimensional data model using labels.
Powerful query language (PromQL) for data analysis.
Alerting via Alertmanager for real-time notifications.
Integration with Kubernetes, Docker, and other services.
Use Cases
Monitoring microservices and containers in Kubernetes.
Setting up alerting based on real-time application metrics.
Analyzing system performance trends over time.
2. Grafana: Visualization and Analytics
What is Grafana?
A visualization and dashboarding tool that integrates with multiple data sources, including Prometheus.
Helps in creating real-time, interactive dashboards.
Key Features
Customizable and interactive dashboards.
Supports multiple data sources (Prometheus, Elasticsearch, MySQL, etc.).
Alerting with various notification channels.
Plugins and integrations for extending functionality.
Use Cases
Visualizing time-series data from Prometheus.
Creating real-time dashboards for server and application health.
Integrating with DevOps tools for centralized monitoring.
3. Datadog: A Full-Stack Monitoring Solution
What is Datadog?
A cloud-based monitoring platform providing observability across infrastructure, applications, and logs.
Offers real-time performance monitoring, security, and analytics.
Key Features
Unified monitoring for metrics, logs, and traces.
AI-driven anomaly detection.
Cloud-native and serverless monitoring support.
Automatic integrations with AWS, Azure, Kubernetes, and more.
Use Cases
Comprehensive monitoring of cloud and hybrid environments.
Anomaly detection using machine learning.
Security and compliance monitoring for DevOps teams.
4. Choosing the Right Tool for Your DevOps Needs
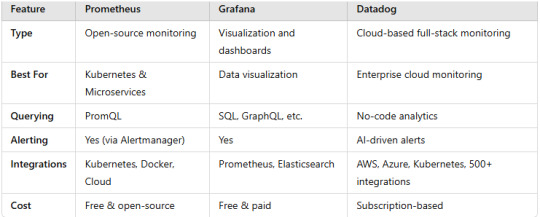
Conclusion
Prometheus is best for monitoring cloud-native applications.
Grafana is ideal for visualization and dashboarding.
Datadog offers full-stack observability for enterprises.
The choice depends on your infrastructure, budget, and monitoring needs.
WEBSITE: https://www.ficusoft.in/devops-training-in-chennai/
0 notes
Text
Simplified Grafana Tutorial: Your Gateway to Data Visualization

Are you looking to dive into the world of data visualization and monitoring? Look no further than this Grafana tutorial! Grafana is a powerful tool that helps you create beautiful dashboards to visualize and analyze your data.
Getting Started:
First things first, you'll need to install Grafana on your system. Don't worry, it's easy! Just follow the installation instructions provided on the Grafana website.
Creating Your First Dashboard:
Once Grafana is up and running, it's time to create your first dashboard. Start by adding a data source, such as Prometheus or InfluxDB. Then, use the intuitive Grafana interface to build your dashboard by selecting the metrics and visualizations you want to display.
Customizing Your Dashboard:
Grafana offers a wide range of visualization options, from simple graphs to complex heatmaps. Experiment with different visualization types and customize your dashboard to suit your needs.
Advanced Features:
As you become more familiar with Grafana, you can explore its advanced features, such as alerts and annotations. These features allow you to set up notifications for important events and add contextual information to your dashboards.
Conclusion:
With this Grafana tutorial, you're well on your way to becoming a data visualization expert! Start exploring Grafana today at Tutorial and Example and unlock the power of your data.
0 notes
Text
Observability and Monitoring in the Cloud: A Comprehensive Approach
In today's fast-paced digital world, maintaining the health and performance of cloud-native systems is critical for businesses. Observability and monitoring are not just buzzwords; they are essential practices that ensure your systems remain available, responsive, and secure.
Why Observability and Monitoring Matter With cloud-native architectures, applications are often distributed, containerized, and dynamic, making traditional monitoring methods insufficient. Observability goes beyond basic monitoring by providing deep insights into the inner workings of applications. This enables businesses to detect issues proactively, understand system behaviors, and make informed decisions to optimize performance.
Approach: Comprehensive Observability with Modern Tools
To achieve robust observability and monitoring, it’s essential to use the right tools and strategies. Here’s how you can implement a comprehensive solution:
Prometheus
Functionality: A powerful open-source tool for metrics collection and alerting.
Use Case: Monitor system performance by collecting time-series data like CPU usage, memory consumption, and network activity.
Key Feature: Integration with Kubernetes for monitoring dynamic containerized environments.
Grafana
Functionality: A visualization tool that works seamlessly with Prometheus and other data sources.
Use Case: Create intuitive dashboards to visualize application metrics in real-time.
Key Feature: Customizable alerts to notify your team of potential issues.
ELK Stack (Elasticsearch, Logstash, Kibana)
Functionality: A comprehensive suite for log management and analysis.
Use Case: Collect, process, and visualize logs from various sources to identify and troubleshoot application errors.
Key Feature: Advanced search capabilities for root cause analysis.
Benefits of Cloud Observability and Monitoring
By leveraging tools like Prometheus, Grafana, and ELK Stack, businesses can unlock the following benefits:
Full Visibility: Gain a holistic view of your cloud-native systems, including metrics, logs, and traces.
Proactive Detection: Identify potential issues before they impact your end users.
Faster Resolution: Reduce downtime with quick diagnosis and resolution of problems.
Optimized Performance: Continuously monitor and tune system performance to meet business goals.
Enhanced Reliability: Ensure high availability of applications and maintain user trust.
Best Practices for Cloud Observability and Monitoring
To maximize the benefits, follow these best practices:
Define Key Metrics: Identify the most critical metrics that align with your business objectives.
Set Up Alerts: Configure alerts for anomalies, ensuring timely responses.
Automate Where Possible: Use automation to handle repetitive monitoring tasks.
Continuously Update Dashboards: Keep dashboards up to date with evolving business needs.
Collaborate Across Teams: Foster collaboration between development, operations, and security teams for unified observability.
Conclusion
Observability and monitoring in the cloud are indispensable for modern businesses. By implementing tools like Prometheus, Grafana, and ELK Stack, you can gain actionable insights into your systems, detect issues proactively, and ensure optimal performance. Embrace a comprehensive observability strategy today to stay ahead in your cloud journey.
Are you looking to enhance your cloud observability and monitoring strategy? Connect with HawkStack Technologies to learn how our solutions can empower your business.
For more details click www.hawkstack.com
#redhatcourses#information technology#containerorchestration#kubernetes#container#docker#containersecurity#linux#dockerswarm
0 notes
Text
🛠 Open Source Instant Messaging (IM) Project OpenIM Source Code Deployment Guide
Deploying OpenIM involves multiple components and supports various methods, including source code, Docker, and Kubernetes. This requires ensuring compatibility between different deployment methods while effectively managing differences between versions. Indeed, these are complex issues involving in-depth technical details and precise system configurations. Our goal is to simplify the deployment process while maintaining the system's flexibility and stability to suit different users' needs. Currently, version 3.5 has simplified the deployment process, and this version will be maintained for a long time. We welcome everyone to use it.
1. Environment and Component Requirements
🌐 Environmental Requirements
NoteDetailed DescriptionOSLinux systemHardwareAt least 4GB of RAMGolangv1.19 or higherDockerv24.0.5 or higherGitv2.17.1 or higher
💾 Storage Component Requirements
Storage ComponentRecommended VersionMongoDBv6.0.2 or higherRedisv7.0.0 or higherZookeeperv3.8Kafkav3.5.1MySQLv5.7 or higherMinIOLatest version
2. Deploying OpenIM Server (IM)
2.1 📡 Setting OPENIM_IP
# If the server has an external IP export OPENIM_IP="external IP" # If only providing internal network services export OPENIM_IP="internal IP"
2.2 🏗️ Deploying Components (mongodb/redis/zookeeper/kafka/MinIO, etc.)
git clone https://github.com/OpenIMSDK/open-im-server && cd open-im-server # It's recommended to switch to release-v3.5 or later release branches make init && docker compose up -d
2.3 🛠️ Compilation
make build
2.4 🚀 Starting/Stopping/Checking
# Start make start # Stop make stop # Check make check
3. Deploying App Server (Chat)
3.1 🏗️ Deploying Components (mysql)
# Go back to the previous directory cd .. # Clone the repository, recommended to switch to release-v1.5 or later release branches git clone https://github.com/OpenIMSDK/chat chat && cd chat # Deploy mysql docker run -d --name mysql2 -p 13306:3306 -p 33306:33060 -v "$(pwd)/components/mysql/data:/var/lib/mysql" -v "/etc/localtime:/etc/localtime" -e MYSQL_ROOT_PASSWORD="openIM123" --restart always mysql:5.7
3.2 🛠️ Compilation
make init make build
3.3 🚀 Starting/Stopping/Checking
# Start make start # Stop make stop # Check make check
4. Quick Validation
📡 Open Ports
IM Ports
TCP PortDescriptionActionTCP:10001ws protocol, messaging port, for client SDKAllow portTCP:10002API port, like user, friend, group, message interfacesAllow portTCP:10005Required when choosing MinIO storage (OpenIM defaults to MinIO storage)Allow port
Chat Ports
TCP PortDescriptionActionTCP:10008Business system, like registration, login, etc.Allow portTCP:10009Management backend, like statistics, account banning, etc.Allow port
PC Web and Management Backend Frontend Resource Ports
TCP PortDescriptionActionTCP:11001PC Web frontend resourcesAllow portTCP:11002Management backend frontend resourcesAllow port
Grafana Port
TCP PortDescriptionActionTCP:13000Grafana portAllow port
Verification
PC Web Verification
Note: Enter http://ip:11001 in your browser to access the PC Web. This IP should be the server's OPENIM_IP to ensure browser accessibility. For first-time use, please register using your mobile phone number, with the default verification code being 666666.
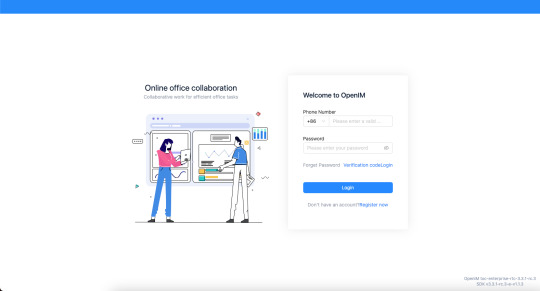
App Verification
Scan the following QR code or click here to download.

Note: Double-click on OpenIM and change the IP to the server's OPENIM_IP then restart the App. Please ensure related ports are open, and restart the App after making changes. For first-time use, please register first through your mobile phone number, with the default verification code being 666666.


5. Modifying Configuration Items
5.1 🛠️ Modifying Shared Configuration Items
Configuration ItemFiles to be ModifiedActionmongo/kafka/minio related.env, openim-server/config/config.yamlRestart components and IMredis/zookeeper related.env, openim-server/config/config.yaml, chat/config/config.yamlRestart components, IM, and ChatSECRETopenim-server/config/config.yaml, chat/config/config.yamlRestart IM and Chat
5.2 🔄 Modifying Special Configuration Items
Special configuration items: API_OPENIM_PORT/MINIO_PORT/OPENIM_IP/GRAFANA_PORT
Modify the special configuration items in the .env file
Modify the configuration in openim-server/config/config.yaml according to the rules
Modify the configuration in chat/config/config.yaml according to the rules
Restart IM and Chat
5.3 🛠️ Modifying Other Configuration Items
For other configuration items in .env, chat/config/config.yaml, and openim-server/config/config.yaml, you can modify these items directly in the respective files.
5.4 Modifying Ports
Note that for any modification of IM-related ports, it's necessary to synchronize the changes in open-im-server/scripts/install/environment.sh.
6. Frequently Asked Questions
6.1 📜 Viewing Logs
Runtime logs: logs/OpenIM.log.all.*
Startup logs: _output/logs/openim_*.log
6.2 🚀 Startup Order
The startup order is as follows:
Components IM depends on: mongo/redis/kafka/zookeeper/minio, etc.
IM
Components Chat depends on: mysql
Chat
6.3 🐳 Docker Version
The new version of Docker has integrated docker-compose.
Older versions of Docker might not support the gateway feature. It's recommended to upgrade to a newer version, such as 23.0.1.
7. About OpenIM
Thanks to widespread developer support, OpenIM maintains a leading position in the open-source instant messaging (IM) field, with the number of stars on Github exceeding 12,000. In the current context of increasing attention to data and privacy security, the demand for IM private deployment is growing, which aligns with the rapid development trend of China's software industry. Especially in government and enterprise sectors, with the rapid development of information technology and the widespread application of innovative
industries, the demand for IM solutions has surged. Further, the continuous expansion of the collaborative office software market has made "secure and controllable" a key attribute.
Repository address: https://github.com/openimsdk
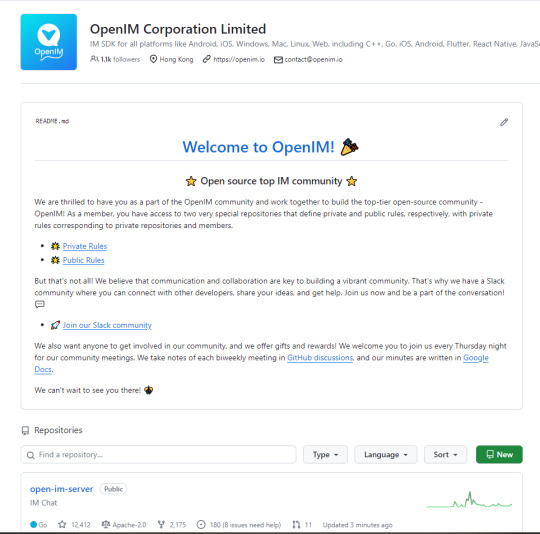
1 note
·
View note