#Tree Map chart Support
Explore tagged Tumblr posts
Visit Tumblr Blog
Explore Tumblr blogs with no restrictions, modern design and the best experience.
Last Seen Tumblr Blogs


Fun Fact
Tumblr was named as a finalist in Lead411’s New York City Hot 125 in Aug 2010.
Text

𝐏𝐫𝐨𝐯𝐢𝐝𝐞𝐧𝐜𝐞
✿𝑷𝒂𝒊𝒓𝒊𝒏𝒈: Alpha! Hyung line x Omega! Reader
✿ 𝑺𝒖𝒎𝒎𝒂𝒓𝒚: "And through some happenstance, casual and cruel, shaped by the hands of the Moon goddesses, you ended up face to face with what They considered your fated mates.
Of course, they didn��t know that - how could they recognize their goddess-given match if you had no scent? As long as you didn’t reach maturity, only you would feel this pull, this constant urge pooling at your lower abdomen when their scents filled your nose and sent your eyes rolling back.
You knew your place and it was not amongst royalty."
OR
The one where you find your fated alphas, but they can't find you.
✿ 𝑻𝒂𝒈𝒔: Romance, Humor, Fluff, Angst, ABO, Soulmate AUs.
✿ 𝑨/𝑵: Should I be writing another fanfic when I have not finished a single one of my works? No. Does my brain understand that? Also no.
Anyway enjoy, like and subscribe and ignore any mistakes as english is not my first language and i dont proof read anything in my life.
P.S: This is heavely inspired by the book Pack Darling, so shoutout to that duology give it a read, yall!
𝐖𝐚𝐫𝐧𝐢𝐧𝐠𝐬: This is a 18+ work! Minors, please do not interact. Also, there will be mentions of violence and abuse.
(Fanfic masterlist)
(support me on my ko-fi if you enjoy my work <3)
°•. ✿ .•°
𝐏𝐚𝐫𝐭 𝐨𝐧𝐞: 𝐒𝐜𝐞𝐧𝐭𝐥𝐞𝐬𝐬
You didn’t know how long you had been running, nor how far you’d gotten. The skies had darkened and then lightened again since the moment of your escape and you assumed you had a few more hours before your absence was noticed, but you didn’t have it in yourself to stop, steps only briefly faltering from exhaustion but still fueled by fear.
You had to keep going. No amount of distance was enough between you and what you had left behind.
Still, there was only so much your body could take in its malnourished state and after a while your legs slowed down on their own, feet too hurt to continue carrying your weight. Yet you stumbled forward through unknown woods, watching trees and shrubbery blurr past you as you dragged yourself towards what you hoped was west - towards the coast.
You had never left the walls that surrounded your family’s home, but had seen the maps that covered the walls of your father’s study enough to remember the outlines of the charted land and the sprawling expanse of the coastal city near the territory you lived - the closest and the only one you could get on foot, even if you were unsure what your next step would be once you got there.
Adamas - the capital of diamonds - laid hopefully ahead of you, filled to the brim with marine vessels and royal ships that you could maybe sneak in and let yourself be carried far away from the claws of your family, running until you found somewhere quiet and reclusive where you could spend your days alone and free from your own status and its implications.
But that dream seemed further and further away as your body shivered and withered, unable to continue your journey, faltering until you gave out and found yourself lying atop a pile of leaves on the cold forest floor.
You sighed, a tortured breath escaping your exhausted lungs. Maybe it was the best you’d get - not the solitary cottage you yearned for, but the swift death by the hands of nature. Still an escape, death. Still freedom from that was always expected of you, from the destiny that awaited.
You closed your eyes and waited, giving up on the weight of consciousness. Any moment now, you thought. It would all be over. As the edges of your mind started to become hazy, your tired lungs pulled one more labored breath and with it a scent that reached out to the deepest parts of your soul with a calming, friendly touch and released the tension from your body.
This is heaven, you thought, and allowed yourself to sleep.
***
There was an unconscious omega in his lands and King Namjoon was unsure on what to do.
Omegas were rare within the wolf genes - they were the smallest of the packs, the caregivers and kindest diplomats, made to become nursing figures within each family dynamic and bring balance to the usually violent and short fused nature of alphas, despite their positions as providers and leaders. But omegas, gentle and fragile omegas, were far and few between and from a very young age Namjoon had been taught to treat them with the utmost care.
With that being said, Namjoon was also taught to be wary of trespassers and this tiny, wounded omega was somehow within his borders.
How did you get there, he wondered. There were no roads leading to the back of the castle where he usually strolled through in the early mornings, only thick woods that would be almost a day on foot before you got to any sort of path.
In the end, his instincts spoke louder, dynamics drilled into his brain and pulling him towards the tattered frame on the ground. With all the kindness he could muster from his large frame, he gathered your body in his arms, gently cradling your form.
As he walked, he let his eyes access you: small, disconcertingly thin, with hollow cheeks and dark circles marring your lovely soft features. You had no mating mark on your neck and no distinguishable scent - and that was what confused him the most.
When an omega reaches maturity, their scent would evolve into something unique that would eventually be used to attract a mate and potentially even identify a fated scent match - a partner made by the heavens, your perfect half.
But despite looking past the age of maturity, you smelled clean, neutral with just a hint of sweetness to classify you as an omega.
What on earth could have happened to you, he wondered, worriedly scanning your bruised body and jutting bones.
And what on earth would he do with you?
***
Sometimes Hoseok couldn’t understand his leader.
He watched as Namjoon paced up and down his office, heavy steps echoing around as he stomped in contemplation.
From the day they met, decades ago, when they were both babbling toddlers, Hoseok had accepted the younger man as pack. Both sons of monarchs, born in allied families, they were thrown together in royal play pens as soon as they could hold the weight of their own heads.
Hoseok always considered it a privilege to watch his brother in arms grow into his position - a natural born leader, a king. And Hoseok never once doubted his ability to rule fairly and successfully.
But every so often he couldn’t help but question his friend’s common sense.
“Namjoon” he called to his still restless friend “You cannot possibly be considering throwing the omega in the dungeons?”
“She is technically trespassing” his friend argued stubbornly.
“She’s an omega!”
His own mother being a rare omega, some rules had been drilled very early into Hoseok’s young mind: omegas are to be treasured, his father had said, it is your job as an alpha to protect them should you be blessed enough to find one.
He hadn’t actually seen the omega. He had barely woken up when a maid ushered him to the king’s office where Namjoon had asked for his council while burning a hole through the carpet.
“She could be dangerous. Some sort of trap, maybe?”
No threat could scare Hoseok more than the idea of his father finding out he had allowed some poor omega to be thrown into their underground cells and so he pleaded “Put her in one of the guest rooms and set my guards in the exits. When she wakes up, I’ll interrogate her myself.”
Namjoon considered the offer for a few seconds, examining the face of the captain of his guard and one of his closest friends. At last, he nodded and settled down in a nearby chair, calling a guard to give the order to move you from the infirmary to the guest aisle of his castle as soon as possible.
Unable to hold back his curiosity any longer, Hoseok asked his shaky leader after a few seconds of silence “What is she like?”
There was a gleam in Namjoon’s eyes Hoseok couldn’t explain and doubted his king could either “Small,” he let out quietly “black and blue all over, all skin and bones like she hadn’t seen a plate of food in days”. Hoseok closed his fists on an impulse and had to force his fingers to relax. Could he blame this sort of reaction on his instincts?
He thought Namjoon wouldn’t say anything else, but after a few more seconds of silence his king continued “Pretty” he said softly at last, almost like an afterthought.
Hoseok couldn’t help himself, having never met another omega besides his own mother, and asked “And… The scent?”
“Clean.”
Hoseok blinked “She’s a child?”
“No. Full grown. Can’t be more than a couple years younger than us.”
That’s odd, Hoseok thought. From what he was taught, a healthy adult omega should have developed a signature scent - like his mom, with her easily recognizable roses and clear meadows.
Right as he was about to ask to see you, his fascination with the idea of a scentless omega getting the best of him, a maid rushed into the room to announce your awakening.
Both men rushed out of the room, elbowing each other to leave first through the door, impatient to get to where you laid, barely avoiding toppling the poor maid on their way.
The infirmary was a wide room with tall ceilings and large windows that let in the morning light from most angles. That same light illuminated your figure as they walked in, eyes drawn to the only bed occupied in the room.
Oh. You were in fact pretty, Hoseok concluded, watching you blink owlishly at the sunlight invading the space. You had a soft looking kind of beauty that was barely overshadowed by your debilitated state that caused a stirring of protection in both alphas. Who could’ve left you like that, he wondered, and how quickly could he wrap his hands around their necks and twist…
“You’re awake” Namjoon pointed out, catching your attention.
That seemed to be the wrong course of action. When your eyes landed on where the men stood by the door, they widened to the size of saucers. Something about their presence sent you scrambling out of your bed, falling onto the ground with a dull thud as you rushed to put some space between yourself and the imposing males.
“Hey, hey, hey” Hoseok raised his hands, palms facing forward to indicate his intention to cause no harm, your terrified expression keeping him far “Be careful, little lady.”
You didn’t say anything, just kept cowering further and further away until your back hit a wall and you winced in pain.
“Stand up and get back to your bed” Namjoon commanded roughly and Hoseok could see your fighting against the urge to submit to the alpha’s orders, causing him to elbow his friend “Please” he added “You are hurt and weak and shouldn’t be out of bed’ he continued in a much gentler tone.
Slowly, you moved yourself back to the mattress, shuffling to hide under the blankets, bringing them over your nose and leaving only your panicked eyes visible.
The last thing Hoseok wanted at that moment was to interrogate you when you were so clearly distressed, body shaking under your burrow. But he had duties to uphold and your presence raised questions that just staring at your disarmingly cute face wouldn’t answer.
“What’s your name, little lady?” he asked.
You mumbled your name so quietly he almost didn’t catch it, the sound stifled by the fabric covering your lips. When he did hear it, he did not recognize it.
“How did you manage to get into the castle’s grounds?”
You gulped. “The castle?” you repeated in a whisper.
“Do you know where you are?” Namjoon asked and you shook your head fearfully “Do you know who we are?”
Sinking deeper into the safety of your blankets, you shook your head once more.
“I’m Jung Hoseok, head of the royal guard” and just when Hoseok thought your eyes couldn’t get any wider, they did, panic seeping further into your gaze “And this is Kim Namjoon” the words had your face paling until devoid of any color, yet he continued “the King of Adamas.”
Both men watched your face for a reaction, seeing you gape in shock, eyes rolling back to your skull as you promptly passed out.
***
You woke up to a churning stomach and a pounding headache, both hunger symptoms that you were very familiar with. How many days had it been since you last ate? You couldn’t tell, the night sky outside the windows of the empty room signaling the end of another day. And at that moment, your starvation was the least of your problems.
The king - the fucking king - was your mate. And so was the head of his guard.
When you first opened your eyes to sunlit room, regaining consciousness after Gods knew how long, their scent hit you like a brick to the face, sending you flying off the bed on the brink of a panic attack.
This couldn’t be happening. Not now. You were so close!
You looked for their reaction, trying to gauge if they were feeling what you were - this life changing pull in your core, this prickling feeling underneath your skin, fingers twitching at your side to reach for your alphas.
But there was nothing, not a flick of recognition, only wariness and mild concern.
These were not your alphas - these were your king and his most trusted guard. And you were just an omega on the run, worth only the money you could be sold for.
You remembered the first offer your father had received once the neighboring towns heard about his siring of an omega. Up until then your father had never seen much value in your existence. Before you, he had only had alpha boys - three, to be exact - older, stronger and meaner than you, built for leadership roles and bringing his legacy to another level.
But you? What use did he have for small, needy, whimpering you? None, he had told you many times over. Your father had never been afraid to remind you of your place in the household: the burden.
Until you became the pot of gold.
You weren’t sure how, but someway or another the news of your existence reached the next town and then the next town over, and so forth until your father was reminded that even though he saw no value in housing an omega, the rest of the world did.
5 million. That was the first offer he received, when you were only fourteen.
And for a moment you believed that could be your way out of your father’s cruel claws - get yourself a husband far away and live happily ever after, pampered and taken care of by some alpha knight.
But those daydreams died soon enough when you learned from the maids what happened to sold omegas.
Imprisoned. Trapped. Breeded. Discarded. Rinse. Repeat.
There was an audible crack in your heart, a rift in the fragile rivulet of hope you had for a future of better days. Since then, the only thing you could hope for was an escape. You daydreamed of far away lands and open fields with no civilization for miles, only an ivy covered cottage for you to hide away from the world.
Alas, that dream seemed further and further away as you got older. You knew your father was just waiting for you to present, hoping that whatever scent you developed would up the price with its enticement and your late blooming was a constant reason for his frustration. Your development was the only thing between you and your sale to the highest bidder.
And if you had any say in it, you would never present. In order to do so, your body needed to be healthy - and you just never were.
Starvation, overexhaustion and overworked muscles had been your saviors since you realized they could delay your maturity. So from the day you turned 16 - about the age omegas started presenting - you began restricting your meals to about one every two days. You ran around the property’s grounds until your feet screamed in agony and your knees gave out. Your sleep schedule was messy and insufficient and so your body remained fragile and unchanged.
And that worked up until your 22nd birthday when your father got tired of waiting.
And so you ran, climbing on the back of a supply carriage that you had visited one day and letting it carry you as far as it could. And then you sprinted, like you had been doing for years.
And through some happenstance, casual and cruel, shaped by the hands of the Moon goddesses, you ended up face to face with what They considered your fated mates.
Of course, they didn’t know that - how could they recognize their goddess-given match if you had no scent? As long as you didn’t reach maturity, only you would feel this pull, this constant urge pooling at your lower abdomen when their scents filled your nose and sent your eyes rolling back.
You knew your place and it was not amongst royalty. You were, as your father always pointed out, too small, too weak and too soft to carry on a legacy, a kingdom.
You had to get out before your ticking bomb of a body turned against you and distanced you once more from your peaceful cottage dream.
You just needed to figure out how.
(Part two>>>)
°•. ✿ .•°
𝐌𝐲 𝐭𝐚𝐠𝐥𝐢𝐬𝐭𝐬 𝐚𝐫𝐞 𝐨𝐩𝐞𝐧! 𝐂𝐥𝐢𝐜𝐤 𝐡𝐞𝐫𝐞 𝐭𝐨 𝐛𝐞 𝐚𝐝𝐝𝐞𝐝
#bts fanfic#bts x reader#bts#min yoongi#jung hoseok#bts scenarios#kim seokjin#kim namjoon#min yoongi x reader#kim seokjin x reader#jung hoseok x reader#kim namjoon x reader#bts abo
758 notes
·
View notes
Text
Waves of Ithaca
Interlude 7: The Weight Between Waves
dividers by: @thecutestgrotto
tw: character death mentioned (not y/n)

The day the reigning king of Ithaca left for war, he brought with him the joy and warmth that accompanied him. From his voice cutting through the cold silence of the palace to his laughter echoing in the halls, his departure left more than a throne unoccupied—it left the hearth chilled.
Y/N was four years old when Odysseus kissed her forehead for the last time. She didn’t cry. Not when he knelt to meet her eye, not when he squeezed her hands in his calloused palms. But just before he stood, she looked up at him and whispered, “What if you don’t come back?” Her voice trembled, small and unsure, but heavy with fear far too old for her years.
Odysseus paused, his smile faltering for just a moment. Then he cupped her cheek gently and said, “I promise I will, but until then, you have to be strong. Can you do that, my little naiad?"
She promised him she would. And children—when they love—keep their promises like oaths bound to the soul.
So when the sun rose the next morning, she was already at the docks.
The sailors found her there, a tiny thing in a sea-stained tunic, hair unbrushed and eyes locked on the horizon. When asked why she wasn’t still asleep in the palace, she answered plainly, “I can’t. He could return at any moment.”
They pitied her at first. But sailors know the ache of waiting, of hoping for sails that never come. So they kept her company. It began with idle stories and distracted chuckles. Then, slowly, it shifted. They showed her how to read the sky, how to watch the sea for signs. They taught her the constellations—Orion first, then the wandering forms of the gods. She learned how to tie sailor’s knots with a quickness that unsettled them.
“She learns like the sea—quiet and fast,” one muttered, after she corrected his knot without looking.
And she never cried.
But there were moments. When a fisherman returned to shore and swept his daughter into his arms, Y/N would turn away. When Penelope would sit on the cliffside at dusk, looking out over the water with eyes just a little too still, Y/N would busy herself with study.

By the time she was ten, Y/N spent much of her time in the palace’s small library. Telemachus, only just turned five then, would often trail after her, yawning and tugging at her sleeve while she poured over trade maps and ship logs. She studied the old trade routes, the closest islands, and how the tides changed with the seasons. Penelope supported her in quiet ways—fresh parchment, a sharpened quill, and never questioning why her daughter chose charts over dolls.
Only once, in the hush of early night, did she whisper to Penelope, “Do you think he’ll be proud of me?”
Penelope had paused, folding a blanket over Telemachus, who had fallen asleep beside them—he couldn’t stay up as long as his sister could, not at his age. “Yes,” she said simply. “He will be. But that’s not why you do this.”
Y/N blinked. “It isn’t?”
“No.” Penelope met her eyes. “You do this because it’s who you are becoming.”
Her grandmother, Anticlea, watched her with a sadness she didn’t speak aloud. She would brush the girl’s hair and mutter stories about Odysseus as a boy—how he used to skip stones or climb too-high trees. Her voice would trail off sometimes, swallowed by silence. She never said it, but her eyes always lingered on the sea.
At fourteen, Y/N took her first voyage.
It was nothing grand—no great fanfare, no golden sails or priestly blessings. Just a small mission: sail to a nearby island to secure grain and salt, check on trade relations, and return before the week’s end. A task often handed to others, one that most nobles wouldn’t bother with. But she volunteered for it.
Her crew was small, just under a dozen—experienced hands from the harbor, some retired sailors, others fishers or merchants who knew their way around a vessel. Some had taught her when she was younger. They’d watched her tie her first knot, fail her first one, and then master it before sundown. They had seen her study the stars until her eyes stung. They trusted her.
When she stepped aboard that morning, hair tied back, calloused hands steady on the worn wood of the deck, no one asked if she was ready. They didn’t need to.
The first day, the winds were gentle, the skies clear. She navigated the ship with ease, her eyes constantly on the horizon, her hands never idle. When the tiller groaned or the ropes strained, she was already there.
By the second day, they faced a problem—reefs just off the coast, where the waters ran shallow and deceptive. A less familiar captain would have circled wide, wasting hours. But Y/N knew the tides, the moon’s pull, the exact time the sandbars would sink low enough to pass.
One of the older crew members raised a brow as they slipped through safely.
“She’s got sea-blood,” someone murmured.
“She’s got sense,” another corrected. “And she listens more than she talks.”
At the port, she handled the trading herself. Bartered better than expected. Not because she smiled sweetly, but because she knew the worth of her goods, and the desperation of theirs. When one merchant tried to overcharge her for grain, she pointed out the rat droppings in the sacks, the damp corners of his storehouse.
“Try again,” she said flatly, and he did.
There were no songs sung of that voyage. No ballads or feasts when she returned. But Penelope met her at the shore, brow drawn tight with worry until she saw the sails. Telemachus, barely ten, shouted and raced down the path, waving his arms as if she’d been gone for moons.
That night, after the supplies were delivered and the crew had been paid, she sat alone on the ship long after everyone had gone. She leaned against the mast and watched the stars rise, listening to the creak of wood and the hush of waves against the hull.
She had done it. Not with her name. Not because she was the daughter of Odysseus.
Because she could.
And that was enough.
At sixteen, a storm came.
It rose like a beast from below, snarling winds and tearing waves. No one could have known the cause—the reckless unsealing of Aeolus’s bag on a ship far from their own. Odysseus’s ship. But Y/N felt it in her blood.
A shift.
The sea felt... different. And so did she.
It wasn’t just the pressure in the air or the scent of lightning. Something inside her—something that had always thrummed steady, like a current in her veins—staggered. The blessing she had carried, quiet and constant, now felt like it was hesitating. Not gone, not absent, but uncertain. Like a tide unsure whether to pull her forward or away. A whisper of power stretched thin, as though someone—somewhere—was calling it back.
She clenched her jaw, tightening her grip on the wheel.
“Captain!” a voice shouted. “We’re close to the island! We push through, we’ll be there by morning!”
Y/N’s eyes were dark with more than rain. “You want to risk your life for a few extra days of trade?” she asked. “We’ve already lost enough time. We’re going home.”
“But—”
“I’m not going to be the reason your wife is widowed. Or your children are orphans.” Her voice was cold, but her hands shook the slightest bit.
She stood at the helm as the storm crashed around them, her face unmoving. It wasn’t fear she felt. It was something else—something deeper, heavier. A weight she had been carrying since the age of four.
When they returned to Ithaca, bruised but safe, the news was already waiting.
Anticlea had walked into the sea.
They found her robe tangled in the rocks. She had waited for too long, and the storm was too cruel an omen. She believed the sea had taken her son.
Y/N didn’t cry. She folded her grandmother’s shawl, placed it in the corner of her room, and did not speak her name for weeks.
But some nights, Penelope would find her on the cliffs where Anticlea once sat, eyes dry, fists clenched so tight her nails left half-moons on her skin.
By twenty-one, she was the captain not just by command, but by blood, sweat, and storm. Her name was spoken with respect in ports far beyond Ithaca. She had sailed to Pylos, to Delphi, returned with knowledge, with goods, with stories. She had done all she had promised.
And now, they were close. Ithaca was a shadow on the sea’s surface, just over the horizon. They would make it by daylight.
Her crew was asleep, their breath easy, their trust complete.
Y/N stood at the helm, alone. Her eyes rose to the constellations—Lyra, gleaming like a song, as if Apollo still strummed its strings across the heavens; and Cygnus, poised mid-flight, halfway to mischief, like Hermes on the cusp of some clever escape.
She took a breath.
“I kept my promise, Father,” she whispered. “I stayed strong.”
But her fingers curled tighter around the wheel, knuckles white. Her shoulders ached, though she had not moved. The weight sat heavy on her chest, heavier than the sea ever had.
"How long must I be strong?"
The question rose like a tide she couldn’t hold back.
"How long must I carry this?"
Her face remained still. The wind brushed against her hair, soft and cold. For now, she said nothing more. But in her silence, the question lingered—unspoken but alive, thrumming beneath her skin.
And though Ithaca grew closer by the minute, Y/N felt the distance in her heart stretch wide and vast, like the sea she had come to know so well.
She buried the ache deep within her—like a ship locking away cargo that should never be opened. Much like the sirens who dragged men to the ocean’s darkest depths with songs sweet and cruel, so too did she drag her pain into the quietest corners of herself. The storm in her heart had no sky to break through, only depth—endless and dark, where even the light of dawn could not reach.
And still, she stood at the helm.
Strong. Silent.
But the sea never forgets what’s buried in it. And neither did she.
AN: what's this?? an update :00 this took me a while to write, i have legit spent like 4 days rewriting this over and over again. woo, more angst for y/n :DD. spot the hamilton reference
#🌊 waves of ithaca#epic the musical#epic the musical x reader#epic telemachus#epic apollo#epic hermes#epic odysseus#epic penelope#x reader#hermes x reader#apollo x reader
60 notes
·
View notes
Note
Sorry to pile on to your asks, but does nep have a lotta legs? You usually draw her with two arms and two legs, but you draw the other insects/arachnids with the right amount of legs. I think your centipede goldrule has more buggy legs attached to their tail (might be misremembering, sorry ;-;) and Karkat is also bipedal. She’s super cute (and fuzzy <3 ), I was just wondering if she had a leggy secret or if the humanoidyness took over the design at this point. (Love your art! <3 <3 <3)
I love getting asks like this your memory is super good!! thank you!! This does have an explanation ;) IRL, Caterpillars have 3 real legs and then sets of false limbs. The squishy 'limbs' on their butt isn't real legs and can't be manipulated in the same way, which is why when they become moths, their three 'real' legs are all that remain! On the other hand, limebloods have a second set of true legs that are exposed after hitting their second molt to support the weight of their heavy tails. I think the centipede morphs (and soon to be introduced millipedes) have had extra thorax legs for their entire lives. Millipedes and Centipedes are APPARENTLY isopod relatives!?!? ....which made me do i did a shitton of research into insect family trees to figure out who was related to what and made like, two to three handwritten maps and charts. I'll be posting those soon. in the meantime GREENBLOOD COMP

#im assuming you meant 4 arms 2 legs i am pretty consistent abt that#homestuck#bugstuck#buggy trolls#buggy lore#this is just straight up Real Lore About Real Bugs#just a big fan of bugs#and greenbloods. greenblood time#nepeta#nepeta leijon#fanart#meulin leijon#meulin
142 notes
·
View notes
Note
Can you guys re-imagine the culture(s) of the Chasind?
Hey anon!
That's a fantastic suggestion! Our campaigns have been taking place mostly in northern Thedas, so we didn't even have Chasind people/Kocari Wilds on the map yet, but you're so right. I didn't know much about the Chasind before reading up on the Bioware Wiki (BW for short) and.....yooof.
We'll definitely do a more thought-out and 'official' entry, but since a lot of our re-imaginings move at a snail's pace, I'll share some of our immediate thoughts after discussing this:
Geography:
It's giving BIG bayou vibes, and we're taking that and running with it, nodding at inspiration of early Black-American culture that emerges in the southern USA and the greater Caribbean Islands. Visuals of the Florida Everglades and Bayou Bartholomew in Arkansas, with a majority of the villages being built on stilts or the massive trees that are similar to the ones seen in the Frostback Basin (Jaws of Hakkon DLC specifically). There are settlements on more solid land, but most of the population and the 'civilians' live inside the swamp, as the tricky terrain doubles as protection and security.
The People:
Based off the BW, we're seeing patterns of love for nature and the seasons, and the mention of "animalistic goddesses" is making us think....DND druid style. (we took one look at the "barbaric" descriptions and tossed it all out, thank you)
Animal companionship is common among Chasind, whether they are "working animals" that warriors and hunters may keep that help them in their tasks, or companions for your local shopkeep or fisherman. Big or small, smart or.....lovable...animals are all around and children may even receive their companion at very young ages, growing up with their animal friend.
Some more magically gifted Chasind can even transform and take an animal form.
Chasind are bonded by clan systems, not blood or background. Meaning that if someone needs help in the village, people will band together to support that person. Once you settle in the swamp, you're family.
The Chasind have a large population of people with darker skin tones, but people with lighter skin tones are not uncommon either.
The Culture
Being situated on top of it, of course, water is EVERYTHING.
Navigating the bayou is no easy feat, and children are taught from a young age through legends, stories, and all sorts of oral histories how dangerous the water can be.
There are definitely some pretty cool eldritch beings living out in the swamp, and there are definitely stories about them.
Fishing culture is HUGE. Fishermen are taught a very sophisticated type of navigation and tracking, most commonly using the stars as a guide to chart the swamp, because the landscape can be incredibly difficult to navigate, especially after dark.
According to the BW, the Chasind have "developed their own language, but are capable of speaking the King's tongue", so we took this as they've managed to blend an older language like the one spoken by their Alamaari ancestors and merged it with the King's tongue (not unlike real-world languages, such as Haitian Creole, Jamaican Patois, or Michif)
People also traverse the swamp on stilts to keep out of the water and out of the way of other water predators. Whether they are walking across the village or going out to the fishing holes to get a daily catch.
Please feel free to add your own comments or thoughts on this re-imagine! This entire project is a joint effort, and having perspectives from other backgrounds is always helpful to make it more inclusive.
#answer#idea sharing#reimagining thedas#thorgans guide to thedas#world of thedas#dragon age table top#dragon age ttrpg#chasind
30 notes
·
View notes
Text
Data Visualization Techniques for Research Papers: A PhD Student’s Guide to Making Data Speak 📊📡
So, you’ve got mountains of data—numbers, statistics, relationships, and trends—but now comes the real challenge: how do you make your research understandable, compelling, and impactful?

Choosing the wrong visualization can distort findings, mislead readers, or worse—get your paper rejected! So, just dive into the best data visualization techniques for research papers and how you, as a PhD student, can use them effectively.
1. Why Data Visualization Matters in Research 📢
A well-designed visualization can:
✔ Simplify complex information – Because nobody wants to decipher raw numbers in a table.
✔ Enhance reader engagement – A compelling graph draws attention instantly.
✔ Highlight patterns and relationships – Trends and outliers pop out visually.
✔ Improve clarity for reviewers and audiences – Clear figures = stronger impact = better chances of acceptance!
🚀 Pro Tip: Journals love high-quality, well-labeled figures. If your visualizations are messy, unclear, or misleading, expect reviewer pushback.
2. Choosing the Right Chart for Your Data 📊
Different types of data require different types of visualizations. Here’s a quick guide to choosing the right chart based on your research data type.
A. Comparing Data? Use Bar or Column Charts 📊
If your research compares multiple categories (e.g., experimental vs. control groups, survey responses, etc.), bar charts work best.
✔ Vertical Bar Charts: Great for categorical data (e.g., “Number of Published Papers per Year”).
✔ Horizontal Bar Charts: Ideal when comparing long category names (e.g., “Funding Received by Research Institutions”).
🚀 Tool Tip: Use Seaborn, Matplotlib (Python), ggplot2 (R), or Excel to create polished bar charts.
B. Showing Trends Over Time? Use Line Charts 📈
For datasets where trends evolve over time (e.g., "Temperature Change Over Decades" or "Citation Growth of AI Research"), line charts provide a clear visual progression.
✔ Single-line charts: Track changes in one dataset.
✔ Multi-line charts: Compare trends across different variables.
🚀 Tool Tip: Matplotlib (Python) and ggplot2 (R) offer excellent support for customizable time-series visualizations.
C. Representing Parts of a Whole? Use Pie Charts (But Carefully) 🥧
Pie charts show proportions but should be used sparingly. If your data has more than 4-5 categories, use a bar chart instead—it’s much easier to read!
✔ Best for: Showing percentages in a dataset (e.g., "Distribution of Research Funding Sources").
✔ Avoid: Using pie charts when categories are too similar in size—they become hard to interpret.
🚀 Tool Tip: If you must use pie charts, D3.js (JavaScript) offers interactive, dynamic versions that work great for online research papers.
D. Finding Relationships in Data? Use Scatter Plots or Bubble Charts 🔄
Scatter plots are your best friend when showing correlations and relationships between two variables (e.g., “Impact of Sleep on Research Productivity”).
✔ Scatter Plots: Show correlations between two numeric variables.
✔ Bubble Charts: Add a third dimension by scaling the dots based on another variable (e.g., “GDP vs. Life Expectancy vs. Population Size”).
🚀 Tool Tip: Python's Seaborn library provides beautiful scatter plots with regression trend lines.
E. Visualizing Large-Scale Networks? Use Graphs & Network Diagrams 🌐
For research in social sciences, computer networks, genomics, or AI, network graphs provide insights into complex relationships.
✔ Nodes & Edges Graphs: Perfect for citation networks, neural networks, or gene interactions.
✔ Force-directed Graphs: Ideal for clustering related data points.
🚀 Tool Tip: Gephi, Cytoscape, and NetworkX (Python) are great tools for generating network graphs.
F. Displaying Hierarchical Data? Use Tree Maps or Sankey Diagrams 🌳
If your research involves nested structures (e.g., "Classification of Machine Learning Algorithms" or "Breakdown of Research Funding"), tree maps or Sankey diagrams offer a clear representation of hierarchical relationships.
✔ Tree Maps: Great for showing proportions within categories.
✔ Sankey Diagrams: Ideal for visualizing flow data (e.g., "Energy Transfer Between Ecosystems").
🚀 Tool Tip: Try D3.js (JavaScript) or Tableau for interactive tree maps and Sankey visualizations.
3. Best Practices for Data Visualization in Research Papers 📑
Now that you know which charts to use, let’s talk about how to format them for academic papers.
✅ 1. Label Everything Clearly
Your axes, titles, and legends should be self-explanatory—don't make readers guess what they’re looking at.
✅ 2. Use Color Intelligently
🚫 Bad: Neon rainbow colors that make your graph look like a unicorn exploded.
✅ Good: Use a consistent color scheme with high contrast for clarity.
🚀 Tool Tip: Use color palettes like ColorBrewer for research-friendly color schemes.
✅ 3. Keep It Simple & Avoid Chart Junk
Less is more. Avoid excessive gridlines, 3D effects, or unnecessary labels that clutter the visualization.
✅ 4. Use Statistical Annotations Where Needed
If you’re presenting significant findings, annotate your charts with p-values, regression lines, or confidence intervals for clarity.
🚀 Pro Tip: If you're new to coding, Tableau or Excel are the fastest ways to create polished graphs without programming.
Final Thoughts: Make Your Research Stand Out With Data Visualization 🚀
Strong data visualization doesn’t just make your research look pretty—it makes your findings more impactful. Choosing the right chart, formatting it correctly, and using the best tools can turn complex data into clear insights.
📌 Choose the right visualization for your data.
📌 Label and format your charts correctly.
📌 Use colors and statistical annotations wisely.
📌 Avoid unnecessary clutter—keep it simple!
🚀 Need expert help formatting your research visuals? Our Market Insight Solutions team can assist with professional data visualization, statistical analysis, and thesis formatting to ensure your research stands out.
💡 We will make your research visually compelling and publication-ready! 💡
1 note
·
View note
Text
Visualize Your Data: Mastering Bar Charts, Line Graphs, and Beyond
1.What is the golden rule of data visualization?
The golden rule of data visualization is to ensure clarity and simplicity. Visualizations should effectively communicate the intended message without overwhelming the audience with unnecessary complexity. This involves choosing appropriate chart types, using clear labels, maintaining a clean design, and focusing on relevant data. The goal is to make insights easily understandable, allowing viewers to grasp key information quickly and accurately. Ultimately, effective data visualization enhances decision-making by presenting data in an accessible and engaging manner.
2. Why is data visualization important?
Data visualization is important because it transforms complex data into an easily understandable format, allowing for quicker insights and better decision-making. By presenting information visually, patterns, trends, and outliers become more apparent, facilitating communication and collaboration among stakeholders. It enhances data comprehension, making it accessible to diverse audiences, and aids in identifying correlations that may not be readily visible in raw data. Ultimately, effective data visualization drives engagement, encourages data-driven strategies, and supports informed actions in various fields, from business to education and beyond.
3. What are types of data visualizations?
Types of data visualizations include:
1. **Bar Charts**: Compare quantities across categories.
2. **Line Graphs**: Show trends over time.
3. **Pie Charts**: Represent proportions of a whole.
4. **Scatter Plots**: Display relationships between two variables.
5. **Histograms**: Illustrate frequency distributions.
6. **Heat Maps**: Use color to represent data density or values.
7. **Box Plots**: Summarize data distribution based on quartiles.
8. **Area Charts**: Show cumulative totals over time.
9. **Tree Maps**: Visualize hierarchical data as nested rectangles.
10. **Infographics**: Combine visuals and text to convey information effectively.
4. What is rasterization in Photoshop?
Rasterization in Photoshop is the process of converting vector graphics, such as shapes and text, into a raster image made up of pixels. This allows for more detailed editing and effects, as pixel-based images can be manipulated at the individual pixel level. Once rasterized, the object can no longer be scaled without losing quality, as it becomes resolution dependent. Rasterization is commonly used when applying filters, blending modes, or when preparing images for print or screen use, ensuring that the design elements maintain their appearance in the final output.
5. How do I enable rasterization in Photoshop?
To enable rasterization in Photoshop, right-click on a vector layer in the Layers panel, then select "Rasterize Layer." This converts the vector layer into a pixel-based layer, allowing for pixel-level editing. You can rasterize various types of layers, including text and shape layers, to edit them as images. Additionally, you can go to "Layer" in the top menu, select "Rasterize," and choose the specific layer type you wish to rasterize. Always remember to save a copy of the original vector layer if you need to retain its scalability.

Visit: VS Website See: VS Portfolio
0 notes
Video
youtube
ETERNALS (2021) Celestial Rises From The Earth [HD] IMAX Clip
There are some lessons to be learned and he wanted to say because he has something to say it's important and he doesn't want to convoluted. Yes I wont.
::: This kaiju is a celestial It is very large but it's only about a 20 roughly the one that the hand that is holding it up at several thousand miles high and is massive and it is a female if you look at the map or chart as it were you would note that it is in a position where it could be a vertical it's not it would be a horizontal from the continental cavern off of Africa which is very tremendous but sometimes there's a vertical shaft from there and it's very huge and it would have an offshoot and usually it's the start of another tree sometimes on the route itself and it happens with this tree as well as the rubber trees that you see in Florida because the limbs are so huge it supports them and it seeks to the ground to hold itself up and finds a route in this case it found one it also connects to the continental cavern in the ocean where the max might reside
Hera
Zues
Olympus
we have it a great statment
Thor FReya
0 notes
Text
Analyzing and Visualizing Data to Unlock Its Potential
Data analytics and visualization definition Analyzing data sets to make inferences about the information they have is known as data analytics. The process of making complex data more comprehensible and accessible by portraying it graphically using tools like charts, graphs, and maps is known as data visualization.

Importance and Relevance in Today’s Business Landscape
In today’s data-driven world, data analytics and visualization are crucial for businesses to gain insights, make informed decisions, and stay competitive. These practices allow organizations to identify trends, uncover hidden patterns, and predict future outcomes.
Overview of the Article
This article explores the various facets of data analytics and visualization, including types, tools, benefits, challenges, and future prospects. It also provides expert insights, real-life case studies, and practical user guides to help you harness the power of data effectively.
Types and Categories of Data Analytics
Descriptive Analytics
Descriptive analytics focuses on summarizing historical data to understand what has happened in the past. It involves techniques like data aggregation and data mining.
Diagnostic Analytics
Diagnostic analytics goes a step further by explaining why something happened. It uses techniques such as drill-down, data discovery, and correlations.
Predictive Analytics
Predictive analytics forecasts future events based on historical data. It utilizes statistical models and machine learning algorithms to predict future trends and behaviors.
Prescriptive Analytics
Prescriptive analytics recommends actions to achieve desired outcomes. It combines predictive analytics with optimization techniques to suggest the best course of action.
Data Visualization: An Overview
Definition and Purpose
Data visualization transforms raw data into visual formats, helping stakeholders quickly grasp complex information and make data-driven decisions.
Evolution of Data Visualization
Data visualization has evolved from basic charts and graphs to sophisticated interactive dashboards and real-time data visualizations, driven by advances in technology and software tools.
Key Principles of Effective Data Visualization
Effective data visualization follows principles such as clarity, accuracy, efficiency, and simplicity. It should tell a story, highlight key insights, and be easily interpretable by its audience.
Techniques and Tools for Data Analysis and Visualization
Statistical Techniques
Statistical techniques like regression analysis, hypothesis testing, and ANOVA are foundational to data analysis, helping to identify relationships and test theories.
Data Mining Methods
Data mining involves extracting valuable information from large datasets using methods like clustering, association rule mining, and anomaly detection.
Machine Learning Algorithms
Machine learning algorithms such as decision trees, neural networks, and support vector machines enable predictive analytics and automated decision-making.
Popular Data Visualization Tools
Popular tools like Tableau, Power BI, and D3.js enable the creation of interactive and visually appealing data representations. These tools offer various functionalities to cater to different user needs.
Data Visualization Companies
Leading Data Visualization Companies
Top companies in the data visualization space include Tableau, Microsoft (Power BI), Qlik, and Looker. These companies provide robust tools and solutions for data visualization.
Services Offered
Data visualization companies offer services such as software solutions, consulting, training, and support. They help businesses implement effective data visualization strategies.
Elevate Decisions with Data Visualization Consulting & Services Get Free Consultation
Case Studies of Successful Implementations
Case studies highlight how companies have successfully leveraged data visualization to drive business outcomes. Examples include increasing sales, optimizing operations, and improving customer satisfaction.
Business Analytics and Data Visualization
Role of Data Visualization in Business Analytics
Data visualization is integral to business analytics, enabling the interpretation of complex data and facilitating better decision-making. It helps in identifying trends, patterns, and outliers.
Enhancing Decision-Making with Visual Analytics
Visual analytics enhances decision-making by providing intuitive and interactive representations of data. It allows decision-makers to explore data visually and gain insights quickly.
Examples of Business Use Cases
Business use cases of data visualization include financial analysis, marketing campaign performance, supply chain optimization, and human resources management.
Data and Information Visualization
Differences Between Data Visualization and Information Visualization
Data visualization focuses on numerical data, while information visualization encompasses a broader range of data types, including text and multimedia. Both aim to enhance understanding and communication.
Use Cases and Applications
Use cases for information visualization include knowledge management, digital libraries, and web analytics. Applications span various industries such as healthcare, education, and finance.
Best Practices
Best practices for information visualization include choosing the right visualization type, maintaining data integrity, and ensuring the visualization is accessible and user-friendly.
Benefits of Data Analytics and Visualization
Improved Decision-Making
Data analytics and visualization provide actionable insights that lead to better decision-making. They help businesses understand their data and make informed choices.
Enhanced Operational Efficiency
By identifying inefficiencies and areas for improvement, data analytics and visualization can streamline operations and reduce costs.
Competitive Advantage
Organizations that effectively utilize data analytics and visualization gain a competitive edge by being more agile and responsive to market changes.
Data-Driven Culture
Promoting a data-driven culture within an organization encourages data usage at all levels, fostering innovation and continuous improvement.
Challenges and Limitations
Data Quality Issues
Poor data quality can lead to inaccurate analysis and misleading visualizations. Ensuring data accuracy and consistency is crucial.
Complexity of Tools
The complexity of data analytics and visualization tools can be a barrier to their adoption. User training and support are essential to overcome this challenge.
Interpretation Challenges
Interpreting data visualizations requires a certain level of expertise. Misinterpretation of data can lead to incorrect conclusions.
Security and Privacy Concerns
Data security and privacy are major concerns in data analytics. Protecting sensitive information and complying with regulations is critical.
Latest Innovations in Data Analytics and Visualization
Real-Time Data Analytics
Real-time data analytics enables instant insights and immediate action, providing a significant advantage in fast-paced environments.
AI and Machine Learning Integration
Integrating AI and machine learning with data analytics enhances predictive capabilities and automates decision-making processes.
Advanced Visualization Techniques
Advanced visualization techniques such as 3D visualizations, augmented reality, and virtual reality provide more immersive and insightful data representations.
Predictive and Prescriptive Analytics Advances
Advancements in predictive and prescriptive analytics are driving more accurate forecasts and actionable recommendations.
Future Prospects of Data Analytics and Visualization
Emerging Trends
Emerging trends include the use of big data, IoT data integration, and the growing importance of data storytelling.
Potential Impact on Various Industries
Data analytics and visualization are set to revolutionize industries such as healthcare, finance, retail, and manufacturing by enabling more informed decision-making.
Predictions for the Next Decade
Predictions for the next decade include increased automation, greater personalization, and the widespread adoption of advanced analytics tools.
Comparative Analysis
Comparing Major Data Visualization Tools
A comparison of major data visualization tools highlights differences in features, ease of use, and pricing. Tableau, Power BI, and Qlik are among the top contenders.
Pros and Cons of Different Approaches
Different approaches to data visualization have their own pros and cons. Interactive dashboards offer flexibility, while static reports provide simplicity and ease of sharing.
Industry-Specific Solutions
Industry-specific solutions tailor data visualization tools to meet the unique needs of different sectors, such as healthcare analytics platforms and financial reporting tools.
User Guides and Tutorials
Step-by-Step Guide to Getting Started with Data Visualization
A step-by-step guide to getting started with data visualization includes selecting the right tool, preparing data, and creating initial visualizations.
Tips for Creating Effective Visualizations
Tips for creating effective visualizations include keeping it simple, focusing on the message, and using appropriate visual elements.
Common Pitfalls and How to Avoid Them
Common pitfalls in data visualization include cluttered visuals, misinterpreted data, and neglecting the audience. Avoid these by following best practices and getting user feedback.
Expert Insights
Interviews with Industry Experts
Interviews with industry experts provide valuable insights into the current state and future of data analytics and visualization.
Quotes and Advice from Data Analysts and Scientists
Quotes and advice from data analysts and scientists offer practical tips and guidance for those looking to improve their data practices.
Expert Predictions for the Future
Expert predictions for the future highlight the potential advancements and challenges in the field of data analytics and visualization.
Personal Stories or Case Studies
Real-Life Examples of Data Analytics Transformations
Real-life examples of data analytics transformations showcase how organizations have successfully leveraged data to achieve significant improvements.
Success Stories from Various Industries
Success stories from various industries demonstrate the broad applicability and impact of data analytics and visualization.
**Learn about Data Analytics Case Studies
Lessons Learned from Failed Projects
Lessons learned from failed projects provide valuable insights into the common pitfalls and how to avoid them.
Conclusion
Summary of Key Points
This article has explored the multifaceted world of data analytics and visualization, covering types, tools, benefits, challenges, and future prospects.
Call to Action for Further Education
Readers are encouraged to continue their education in data analytics and visualization through online courses, certifications, and professional development opportunities.
Final Thoughts
Data analytics and visualization are powerful tools that can transform businesses and industries. By embracing these practices, organizations can unlock new insights and drive better outcomes.
See the Future Through Data!
Visualize your success, partner with us for data visualization! Request Demo!
0 notes
Text
Exploring the Techniques of Data Visualization

Large data sets need in-depth analytics and processing power to manage. This is where data visualization is helpful. Data visualization services have advanced rapidly in recent years, anticipated to alter the business environment shortly.
Data visualization utilizes visual elements such as charts, graphs, and maps to facilitate the observation and comprehension of trends, outliers, and patterns in data. It helps determine which variables to include or discard in the analysis.
This blog on data visualization techniques will provide detailed insights into the techniques and benefits.
What is Data Visualization?
Data visualization is a captivating form of visual art that captures our attention and effectively conveys a message. When we look at a chart, we can easily identify trends and outliers. Visualizing data allows us to quickly internalize information. It's essentially storytelling with a purpose. If you've ever struggled to identify a trend in a large spreadsheet of data, you understand the power of visualization.
Data visualization is a powerful method to explore data and present results effectively. Its primary use is in the pre-processing stage of the data mining process. It supports the data-cleaning process by identifying incorrect and missing values.
Techniques of Data Visualization
Representing visual data requires various techniques that must be followed to achieve this process. Let's explore some of these techniques to make this process simpler and easier.
1. Temporal
Temporal data visualization offers the advantage of familiarity, as we are already accustomed to using such visuals, particularly in educational and professional settings where charts are commonly used for explanations. Linear and one-dimensional data visualizations play a crucial role in temporal data visualization. Examples of temporal data visualizations include linear graphs, polar area diagrams, scatter plots, time series sequences, and timelines.
2. Multidimensional
Multidimensional data visualizations, as their name implies, involve multiple dimensions, typically requiring at least two variables for a 3D data visualization. These visualizations often feature vibrant and striking graphics due to the numerous concurrent layers and datasets. They excel at condensing large amounts of information into key points. Examples of multidimensional data visualizations include histograms, scatter plots, pie charts, Venn diagrams, and stacked bar graphs.
3. Geospatial
Geospatial or spatial data visualizations involve overlaying different data points on familiar maps to connect them to specific geographic locations. Examples of geospatial data visualizations include Cartograms, Heat maps, Flow maps, and Density maps.
4. Network
Users of network data visualization can demonstrate connections between different data sets. Within this network, communication takes place via intricate connections linking one data set to another. Visualizations such as alluvial diagram charts, parallel coordinate plots, node-link diagram charts, word cloud plots, network diagram charts, non-ribbon chord diagram plots, and matrix charts are commonly used to illustrate the relationships between data sets.
5. Hierarchical
When information needs to be organized into clusters, hierarchical data visualizations are very helpful. However, creating these graphs is more complex compared to other forms of visualization. Hierarchical data visualizations can show a company's or organization's data and object hierarchy. Examples of hierarchical data visualizations include ring charts, sunburst diagrams, and tree diagrams.
Wrapping Up
Data visualization solutions are an essential step in data processing techniques. In the new era, data visualization is making its debut. With the introduction of next-generation technologies and the development of apparent frameworks, it is moving from art to science, opening up new opportunities.
Using the above guide, you can use data visualizations for processing your business data or use the help of data visualization consulting services. A leading data visualization company excels at this situation and can help you to implement this approach. There is a plethora of legacy modernization services available to modernize your business applications. To make data-driven decisions, choose top-quality data visualization services to create a data visual model.
0 notes
Text
In terms of directory structure, wolai manages all files or pages in a tree

In comparison, the design of wolai's tree-like thinking is more in line with people's common thinking habits. All content is managed in the directory on the left. The interface is simple, reducing the user's cognitive cost, and making it easier for users to operate quickly.
In addition, both support moving the document position by dragging the mouse, making it easier for users to summarize documents.
2) User groups and needs
From the above analysis of user age and HE Tuber gender distribution, it can be seen that the user groups of the two applications are mainly concentrated in young people and young and middle-aged people aged 19-34, and among them, female users account for a slightly larger proportion.
According to the positioning and functions of the product, the user group characteristics and corresponding possible needs can be analyzed:
Student group: class notes, study notes, knowledge organization, paper writing, manuscript materials, to-do items, information management and sharing, etc.
Professionals: document editing, office collaboration, team management, data organization, task lists, knowledge accumulation, work reports, review summaries, information management and sharing, etc.
Others (such as freelancers, scientific researchers, etc.): personal notes, paper reports, life records, to-do lists, daily planning, insights, information management and sharing, etc.
3) Product demand positioning
In order to solve these actual needs, the functions that the product is required to have, that is, the product's demand positioning is:
Quick and convenient note creation and category management.
Diversified input of information, including text, voice, pictures, videos, attachments, Markdown and other forms.
Complete and concise editing functions.
Retrieve notes and information quickly and accurately.
Collaboration functions such as reading, viewing and co-editing of notes.
Convenient information collection, sharing and reminders.
Multi-terminal real-time synchronization allows users to conveniently manage and view notes on different devices.
Data security is guaranteed, data confidentiality and backup are protected against loss.
It can be exported or shared in a variety of formats to facilitate users to further utilize the note content.
2. Scope layer
Comparison of functional scope.
The functional structures of the two products are shown below:
Ilaiwolai product function structure chart
Yuque product functional structure chart
Comparing the functional structure diagrams of the two products, we can find that both products basically meet the core needs of editing, viewing, management, collection, sharing, collaboration, etc., but they have different focuses on the specific functions to achieve each need.
The following is a comparison of the two products based on core requirements and some other functions:
1) Edit
Wolai provides three main categories of inserted block content:
List of basic blocks: text, titles, lists, code snippets, mathematical formulas, etc.
Advanced Block Lists: Collapsed Titles, Collapsed Lists, Data Tables, Mind Maps, Meetings, Mermaid Drawings, and more.
Media and attachments: pictures, audio and video, website bookmarks, file attachments, and some third-party services (Bilibili Video, Tencent Video, NetEase Cloud Music, etc.).
Some of the above list of advanced blocks require a membership to be used, but other free features are sufficient for most users' daily use. However, there are also cases where it does not support frequently required functions such as format brushing, clearing formats, and adjusting font size, which are commonly used in document editing.
Compared with wolai, Yuque's editing functions are richer. In addition to most of the inserted block content in wolai, it also supports the insertion of Yuque's unique data tables, drawing boards and other content, as well as calendar, check-in, voting and other tools.
In addition, it is richer in supporting the insertion of third-party services. In terms of text editing functions, Yuque also supports basic functions commonly used in document editing, solving some problems in wolai. However, Yuque has included the function of embedding local files, audio and video as a membership function, which is disadvantageous compared to wolai in this regard.
The two products also have different paths to enter the editing page. All content in wolai's personal space is in the tree directory structure on the left. Users only need to click on a specific page or folder to view and view it in the content area. edit.
The difference with Yuque is that after the user enters the specific document page, the document reading/preview page is displayed. If you need to edit, you need to click the edit button on the page to enter the editing page to edit, or on the document list on the home page Click the edit button to enter editing.
Both methods have their own advantages and disadvantages. The advantage of the former is that it is convenient and fast. You can edit and modify it at any time during the reading and browsing process. However, the disadvantage is that if it is used on a mobile terminal, it is very likely that the content will be modified by mistake during the sliding browsing process. . The advantages and disadvantages of the latter are exactly opposite to those of the former.
Generally speaking, the note editing functions of both are relatively complete and rich, and both closely follow the leading foreign note-taking product Notion, and both adopt the disruptive innovation of block applications, which greatly improves the productivity and efficiency of notes. At the same time, it also greatly enriches its application scenarios.
Use of block applications
2) View
Viewing notes can be divided into two steps: searching and reading.
① Search aspect
The free version of wolai provides functions such as searching file titles and filtering editing and creation time. The membership version provides precise search functions. Due to the existence of its knowledge community, Yuque's search results are divided into two dimensions: related to me and public Yuque.
"Relevant to me" refers to the knowledge base and various documents created in personal space.
"Open Talk" refers to various types of content in the knowledge community, and the search results in two dimensions also have filtering items such as content, type, and time.
In addition, Yuque’s free account supports precise searches, not just titles.
② Reading
When the reading object is ordinary content, both provide the outline/title directory of the document, and support folding/expanding the title content to facilitate readers' positioning and viewing. When the reading object is an Office document or PDF file, both wolai member version and Yuque free version provide a file preview function.
The PDF file preview page of Yuque also provides functions such as annotations, thumbnails, and table of contents. Yuque will display recently browsed/edited documents on the start page of the homepage to facilitate users to quickly locate documents, but it does not provide similar functions on the mobile terminal.
In contrast, wolai provides the function of displaying recently accessed documents on the mobile side, but not on the PC side.
In addition, as mentioned above, the viewing and editing of Yuque are independent pages, which provides users with a reading mode, allowing users to have a better experience when browsing documents.
3) Management
In terms of directory structure, wolai manages all files or pages in a tree structure, and can nest individual pages together to achieve unlimited organizational levels. Yuque manages various documents in the form of a knowledge base.
In comparison, the design of wolai's tree-like thinking is more in line with people's common thinking habits. All content is managed in the directory on the left. The interface is simple, reducing the user's cognitive cost, and making it easier for users to operate quickly.
In addition, both support moving the document position by dragging the mouse, making it easier for users to summarize documents.
wolai page tree structure
In terms of file management, both provide regular functions such as rename/delete/move/copy, etc. Wolai also provides file/page embedding functions due to its tree structure.
Yuque provides a knowledge network for viewing documents, thereby understanding the references and associations between documents/knowledge bases, and sorting out the information knowledge network. Wolai also provides a page relationship diagram, which can provide a global overview of the relationship between all pages.
wolai page relationship diagram
In order to facilitate users to trace back, wolai provides functions such as page editing records and page history. Yuque also has the corresponding function of viewing historical versions, but Yuque also provides an additional function to compare the differences between different versions, allowing users to locate the differences more quickly and accurately.
In order to facilitate users' note migration and further utilization of note content, both provide relatively complete import and export functions.
Wolai supports the import of Markdown, Word, Evernote, HTML, plain text and other formats, and supports the export of Markdown, Word, PDF, HTML and other formats. The import formats supported by Yuque are not much different from those of wolai. The export formats vary depending on the document type. The difference is that the document type can support the export of Markdown, Word, PDF, JPG and other formats, the drawing board type only supports the export of JPG, PNG and other image formats, and the table type only supports the export of Excel format.
4) Collection
Wolai's function for collecting notes is relatively simple. It only provides the function of pinning documents or folders to the top. Strictly speaking, it does not belong to the collection function. According to the prompts of the star button, it is more like pinning documents so that users can Quick access to features.
For the collection of external content, wolai member version provides a WeChat clipping function, which can quickly save the content in WeChat to a designated location in the workspace.
Due to the positioning of its own knowledge base, Yuque has a relatively complete collection function. There is a separate collection page on the workbench page to display all collection content. Users can quickly find the corresponding content by entering keyword searches or filtering conditions.
In addition, the collection page also provides the function of grouping collection content to facilitate users to further manage and maintain collection content.
5) Share
Wolai's sharing mainly involves adding files/folders as links to collaborative visitors or sharing them publicly on the Internet.
The form of Yuque is basically similar, but the difference is that after sharing content publicly, users can also set whether to allow public search within Yuque, that is, search and view public knowledge bases or documents in the knowledge community (browse) or other places. Added properties for community applications.
Yuque knowledge base sharing function
6) Collaboration
In terms of collaborative office, wolai provides three types of spaces for team use: group version, team version, and enterprise version f
0 notes
Text
Exploring the Top 30 GitHub Python Projects at the Beginning of 2024
Introduction:
As we step into the year 2024, the Python programming language continues to dominate the world of software development. GitHub, the largest code-hosting platform, is home to a vast array of Python projects that showcase the language's versatility and popularity. In this article, we will delve into the top 30 GitHub Python projects at the beginning of 2024, highlighting their significance, innovation, and impact on the developer community.
TensorFlow:
TensorFlow remains a powerhouse in machine learning and artificial intelligence. Widely used for building and training neural networks, TensorFlow's extensive community and continuous updates solidify its position as an essential Python library.
PyTorch:
PyTorch, another heavyweight in the machine learning arena, provides a dynamic computational graph, making it a favorite among researchers and developers. Its flexibility and ease of use contribute to its popularity.
Django:
Django, a high-level web framework, continues to be a go-to choice for developers building robust and scalable web applications. Its "batteries-included" philosophy, coupled with an active community, ensures efficient web development.
Flask:
For those seeking a lightweight alternative to Django, Flask remains a popular choice. This micro-framework is known for its simplicity and flexibility, making it ideal for small to medium-sized projects.
Requests:
Requests simplifies HTTP requests in Python, streamlining communication with web APIs. Its user-friendly syntax and widespread adoption make it an indispensable tool for developers working with web services.
Pandas:
Pandas is a data manipulation and analysis library that has become the backbone of many data science projects. With powerful data structures and tools for handling structured data, Pandas remains a staple in the Python ecosystem.
NumPy:
NumPy, the fundamental package for scientific computing with Python, provides support for large, multi-dimensional arrays and matrices, along with mathematical functions. It plays a crucial role in data science, machine learning, and numerical computing.
Matplotlib:
Matplotlib is a comprehensive 2D plotting library for creating static, animated, and interactive visualizations in Python. Widely used in scientific computing and data analysis, Matplotlib empowers developers to communicate insights effectively.
Scikit-learn:
Scikit-learn is a versatile machine learning library that simplifies the implementation of various algorithms. With a clean and consistent interface, it caters to both beginners and experienced data scientists.
Beautiful Soup:
Beautiful Soup facilitates web scraping by providing Pythonic idioms for navigating, searching, and modifying a parse tree. Its simplicity and compatibility with different parsers make it a favorite among developers extracting information from websites.
SQL Alchemy:
SQL Alchemy is an SQL toolkit and Object-Relational Mapping (ORM) library for Python. It simplifies database interactions, allowing developers to work with databases using Python objects.
Fast API:
Fast API, a modern, fast web framework for building APIs with Python 3.7+, has gained popularity for its speed and ease of use. It leverages Python type hints for automatic data validation and documentation.
Flask-RESTful:
For those focusing on building RESTful APIs, Flask-RESTful extends Flask to simplify the process. It provides features like request parsing, resource classes, and easy serialization.
Plotly:
Plotly is a powerful graphing library that enables the creation of interactive and visually appealing plots. It supports various chart types and is commonly used in data visualization and analytics projects.
Pygame:
Pygame is a set of Python modules designed for game development. Aspiring game developers and enthusiasts use Pygame to create 2D games, simulations, and multimedia applications.
Tornado:
Tornado is a scalable, non-blocking web server and web application framework. It excels in handling long-lived network connections, making it suitable for real-time web applications.
Gevent:
Gevent is a coroutine-based Python networking library that provides a high-level synchronous API on top of the libev or libuv event loop. It is used to write scalable network servers and clients.
SQLAlchemy-Utils:
SQLAlchemy-Utils adds various utility functions and custom data types to SQLAlchemy. It simplifies common tasks such as JSON-encoded fields, UUID types, and improved Enum support.
Sphinx:
Sphinx is a documentation generator that simplifies the process of creating and maintaining documentation for Python projects. It supports various output formats, including HTML, PDF, and ePub.
Black:
Black is an opinionated code formatter for Python. It enforces a consistent coding style, promoting readability and reducing debates over code formatting in development teams.
Celery:
Celery is a distributed task queue system that handles the execution of tasks asynchronously. It is commonly used for background processing, periodic tasks, and distributed computing.
Poetry:
Poetry is a modern Python packaging and dependency management tool. It simplifies the process of creating and managing Python projects, providing a standardized and user-friendly approach.
Pillow:
Pillow is the friendly fork of the Python Imaging Library (PIL), providing easy-to-use methods for opening, manipulating, and saving various image file formats. It is a valuable tool for image processing tasks.
Pytest:
Pytest is a popular testing framework that simplifies the process of writing and executing unit tests. Its concise syntax and powerful features make it a preferred choice for Python developers.
Typer:
Typer is a library for building CLI applications with Python. It leverages Python type hints for automatic completion and validation, making it easy to create interactive command-line interfaces.
Flake8:
Flake8 is a linting tool that checks code against coding standards and identifies potential errors. It combines popular Python linting tools, including PyFlakes, McCabe, and pycodestyle.
Sphinx-Contrib-Napoleon:
Sphinx-Contrib-Napoleon is a Sphinx extension that supports the Google, NumPy, and reStructuredText docstring formats. It enhances the documentation generation process by providing clear and concise docstrings.
Fast API-Admin:
FastAPI-Admin is an admin dashboard generator for FastAPI applications. It automates the creation of CRUD interfaces for database models, saving developers time and effort in building administrative panels.
Pyinstaller:
Pyinstaller is a packaging tool that converts Python applications into standalone executables. It simplifies the distribution of Python applications, ensuring they can be run on various platforms without requiring Python to be installed.
Pygame Zero:
Pygame Zero is a simplified wrapper around Pygame designed for educational purposes and beginner-friendly game development. It abstracts away some of the complexity of Pygame, allowing newcomers to focus on coding games.
Conclusion:
As we embark on another year in the ever-evolving landscape of Python development, these top 30 GitHub Python projects at the beginning of 2024 showcase the language's adaptability, diversity, and relevance. From machine learning frameworks to web development tools, from data manipulation libraries to game development frameworks, these projects continue to drive innovation and empower developers worldwide. Whether you are a seasoned professional or a newcomer to Python, exploring these projects can provide valuable insights and inspiration for your next coding .
0 notes
Text
Thuldrexa House
(Happy Midwinter, all! Here's a write-up of Ser Lex's childhood home, complete with maps. Use it to bring Thuldrexa House and its occupants into your game, or populate it with your own TTRPG family!)
Situated cliffside of Froia, a literal stone’s throw from the town square, rests the home of the city’s most legendary citizens, Thuldia Moordinboon-Nahir and Drexa Nahir-Moordinboon. Once a modest dwelling at the city’s re-founding, it has been modified twice – once after an earthquake and again after a dragon attack. You wouldn’t know it to look at it, however. As part of the city’s mix of cultural influences during reconstruction, the house is a unique blend of dwarven and tiefling influence, with a solid stonework foundation supporting its elegant dark woodwork.
Thuldrexa House Features
The house has the following features:
Ceilings. The ceilings throughout the house are 10 feet high.
Doors. The house’s outside doors are locked. A character can pick a lock with a successful DC 25 Dexterity check using thieves’ tools. The inside doors are unlocked unless otherwise noted.
Lighting. By night, the interior of the house is in darkness, but there are flameless lamps that can be activated to provide bright or dim light as needed.
Magic Stairs. The steps into the house and the stairs inside are enchanted to move and reshape themselves for full accessibility.
Security. If an outside door or window is smashed or there is some other form of noticeable vandalism, two town guards arrive at the house in 1d4 rounds. Additionally, the hearthstone embedded in the living room fireplace allows the occupants to cast the alarm spell to encompass the entire house without the need for material components. It also alerts Thuldia and Drexa to the status of the house, the conditions of anyone in it, and the number of people coming and going.
House Locations
The grounds around the house are greener than elsewhere in Froia, with both cultivated flower beds and dots of wilder growth throughout the yard. Two pine trees flank the house closer to cliffside, surrounding the house with a lovely woodsy scent, while small clusters of bushes gather at the front corners of the house. A simple stone pathway leads up to the front of the house.

Beyond the solid oak door, the interior of the first floor is open and spacious, with posts leading up to support beams that are covered in druidcrafted flowering vines. To the left, a large table that easily sits six denotes the dining area, situated in front of the kitchen with an open “window” between the two for ease of moving dishes from one area to the other or offering a bar-like counter for gatherings. To the right, a lounge area with plenty of seating for guests, including a loveseat positioned in front of the fireplace where a hearthstone is set into the brick to offer magical protection to their home. Though the decorations on this floor are largely floral, there is a framed world map to the side of the fireplace that charts the paths Thuldia and Drexa traveled on their journeys when they first met.
Past the loveseat is another oak door, this one leading to the back patio deck. From here, you can look down the mountainous slope that the house is perched on to the port section of Froia, and beyond that out to the North Sea. To the left of that oak door, taking up the middle section of the stained glass windowed back wall of the house, are stairs that lead to the second floor, along with a door that leads to the basement stairs.

On the second floor, the stairwell and upstairs hall features framed pictures of Drexa and Thuldia, from their early adventuring days to their post-adventure days, through the various stages of raising their son, Ollex. Clockwise from the left is Thuldia and Drexa’s bedroom, with ample storage for their attire ranging from adventuring gear to formalwear, and various personal items they’ve collected over the years. Then the bathroom, fitted with a tub and sink both enchanted with create/destroy water as needed, as well as facilities to prestidigitate away any waste (but no mirror to be found here or elsewhere in the house). Next, Drexa’s study which is filled with her most precious books from across the world and even other planes, from spellbooks to history books, and a desk where she scribes correspondence to various friends and allies and keeps collections of their replies. Finally, Ollex’s room, currently empty while he’s away from home but kept just the way he left it for when he returns.

The final floor of the house, the training/teleportation area, is below ground. It’s in this space that Thuldia and Drexa spar to keep their physical and magical capabilities sharp, and where young Ollex was trained in how to use axes for self-defense. Thuldia’s cache of weapons is within the main room, as well as various combat-oriented magic items that they don’t want to keep in the more visitor-accessible areas upstairs. This includes Thuldia and Drexa’s first adventuring weapons, an axe and mace respectively. In an adjoining room, added onto the property shortly after Lex’s birth, a teleportation circle linked to the ancestral Nahir homestead in the Spireset allows Drexa’s side of the family to visit them freely and vice versa. Several chests in the room contain various coats and changes of clothes for those journeying to and from Froia’s northern climate to the more temperate Spireset region.
1 note
·
View note
Text
The Complete Guide: Top 10 Best Data Visualisation Tools
Data visualisation is developing as a crucial tool in today's data-driven business world, converting data into images, making it easier for organisations to understand, process, and make important decisions. Data visualisation aids in the creation of actionable insights. There are several data visualisation tools available that are adaptable, simple to use, and enable the user to visualise data in a variety of ways that are appropriate for their business objectives.
According to a new Fortune Business Insights analysis, the data visualisation market is anticipated to be worth $8.85 billion in 2019 and $19.20 billion by 2027, with a compound annual growth rate of 10.2%.
Businesses can drive engaging tales with comprehensive data visualisation tools by embracing the power of data storytelling.

What exactly is data visualisation? The process of graphical depiction of data in visual forms such as graphs, charts, and maps is known as data visualisation. The tools make it simple for users to derive insights from data, aiding them in making data-driven decisions. Data visualisation makes data more accessible and easier to understand by portraying it visually.
Data presented visually is simple to comprehend and analyse. This facilitates the extraction of actionable insights, allowing organisations to apply the findings for efficient real-time decision-making. To allow the visual depiction of data, data visualisation technologies support streaming data, AI integration, collaboration, interactive exploration, and self-service capabilities. Data visualisations vary, but some of the most prevalent are bar graphs and line graphs, pie charts, scatter plots, tree charts, mind maps, timelines, and project evaluation and review techniques, sometimes known as PERT charts.
What Is the Definition of Data Visualisation Tools? Organisations are adopting measurements to understand how essential data is when making critical decisions as data becomes increasingly important for everyday decision-making. Data visualisation is gaining popularity for the same reason. Modern data visualisation tools are sophisticated pieces of software that are used to visualise data. While the features of each tool differ, they all allow the user to input a dataset and edit it graphically. Many applications also have pre-built templates for developing basic visualisations.
Google Charts, Tableau, Datawrapper, Microsoft Power BI, and other top data visualisation tools are available on the market. These tools provide customers with a range of visual styles that are basic, easy to use, and can handle a big number of data.
Finding the Best Data Visualisation Software With the abundance of data analytics and visualisation technologies available on the market, all available tools have something in common. The tool's first advantage is its ease of use. Some have good documentation and tutorials, while others are built in a user-friendly manner. Others, regardless of their other characteristics, fall short in specific areas. The one thing to keep in mind is that the data visualisation software can handle massive amounts of data.
Organisations may also develop a range of bar charts, graphs, and maps with the correct tools. Many data visualisation tools on the market specialise in specific chart or map designs and excel at them.
Read More:- https://us.sganalytics.com/blog/top-10-best-data-visualization-tools-list-2023/
#Data Visualization#Data Visualization Tools#top Data Visualization Software#data analysis and visualization#BI visualization tools#data visualization platforms
0 notes
Text
Forty Two
What do you think of when you see the word Idaho? I bet it’s not “girls’ trip!” but that didn’t stop my three best friends from college joining me on marathon number 42 to Coeur D’Alene, Idaho. Elissa, Christie and Veronica have been my friends for almost 30 years, and it’s been over 14 years since we traveled together. We planned an adventurous time in Idaho, with my marathon being just a segment of a packed itinerary and four days of laughs and fun.
All three of them got up early on Sunday morning to walk to the starting line with me. We stayed at the host hotel and it was just a short distance to the start. It was a marathon participant only starting line, and there were very few runners. All total, under 300 people ran the race.

The fastest pace group sign was 3:45, and I wanted to stick with him or faster because I had four goals for this race, increasing in difficulty. 1. Finish under 4 hours. 2. Qualify for Boston. 3. Win my age group. 4. Get a personal record. My race goals have definitely changed in the past two years. It was just recently that it was a goal to get ten minute miles, and winning an age group seemed impossible. I think it’s mostly due to getting older, but qualifying for Boston is simple now.
Sizing up the crowd I thought I had a good chance to run faster than a lot of women, so I started with that idea in mind. I decided to count how many women passed me and how many I passed along the way. For me, it’s really difficult to estimate how old someone is if they are between 30-50, so I thought I’d just do my best to keep the total of women in my head.
We headed out of the city quickly and began to follow Lake Coeur D’Alene. The race was a route path unlike one I’ve done before. I thought of it as a figure-eight of sorts. We started in the center and ran north, then turned on point and ran directly back to the center. Once there, we ran south and again turned on point and traced our way back to the center. I found this unfortunate because I really limited the amount of scenery we were able to admire. Additionally, despite the beauty of the lake and the surrounding mountains, the race route was along a highway with limited views. It seemed like a missed opportunity. We did get glimpses of the lake, and the trees smelled amazing, but it was also just a lot of exposed asphalt.
The girls were eager to support me in the race, but upon looking at the route, I was concerned that the highway would be closed and accessing the race route would be impossible. We agreed to only two vantage spots, and I could tell they were really disappointed in not seeing me more. I was very frustrated when I got to mile three and realized that the highway was fully open and we were running on the shoulder. The girls could have easily followed me almost the entire way!
In studying the race elevation map, I was concerned about two major hills at miles 5 and 6. I really let this concern get in my head and I felt a lot of doubt in my ability to handle them. I hit the beginning of the first hill and figured I would just run it until I was too slow and then walk. I charged up the base and it wasn’t horrible, so I persevered. I thought it would continue to rise, but at the top I realized that was it! Somehow the elevation chart made the hill out to be much longer and steeper. With a doubtful mind that maybe I was missing something or the worst was to come, I headed to the next hill. Again, it was really manageable and I charged up without too much difficulty. I was so pleased to have conquered the two biggest worries I had in the race.
After the hills, I began to see runners returning on the route from the turnaround. I found this shocking since the turnaround was at mile 9ish and these runners didn’t look especially speedy. Some were really struggling and they didn’t seem enthused to be “winning” the race. I also couldn’t understand how they could have been so fast to have run 5 miles more than me that quickly! Then it occurred to me, there was an earlier start to provide time for those who were concerned on finishing within the 6 hour cut off. These folks had started the race an hour earlier than me! Sure enough, another mile or so later I saw the real winner of the race flying past.
The plan was for the girls to find their way through back roads to mile 9, just before the turnaround, and post up there so they could see me twice. As I got there, I realized that they hadn’t been successful, but then I saw Christie and Veronica shout from their car! They saw me! But where was Elissa?
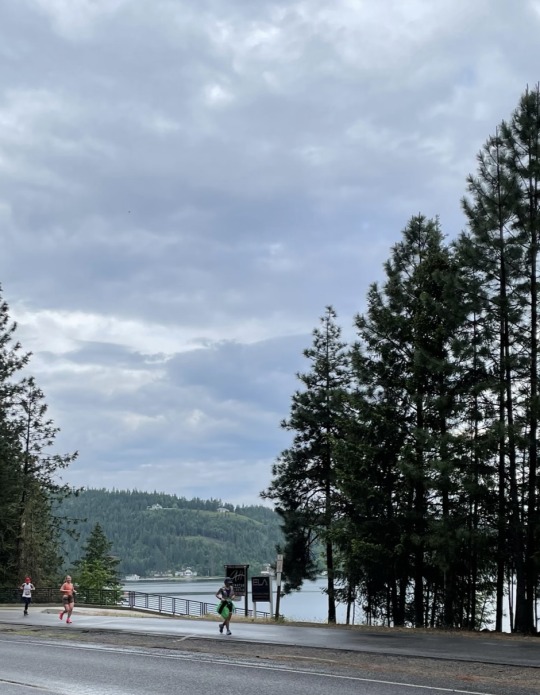
Upon reaching the turnaround, I had not been passed by any women, and I passed on. I had kept count of the ones I saw returning, and figured there were about 9 of them. Shortly after the turnaround I did get passed by a woman my age, who I could hear approaching for several minutes. Something about her gait or her shoes really irritated my ears. Her running was driving me a little crazy (I don’t think it was because I was angry that she passed me). Unfortunately, we were running at practically the same speed. I would try to pass her, but then she would pass me right back. It was a frustrating irritation and for the first time in all of my running, I had a competitor that I was trying to beat! I thought of my friend Nancy Werner, who is such an incredible athlete and a fierce competitor. I decided to channel my inner Nancy and make it a goal to beat this woman in the race!
I got to see Christie and Veronica again as I came from the turnaround. They had a couple signs and they were shouting me name. But again, no Elissa. I couldn’t figure it out. I thought through the scenarios: did she go back to the hotel and need to sleep? Did she get sick or hurt? Was there an emergency at home that she needed to talk to her family about?
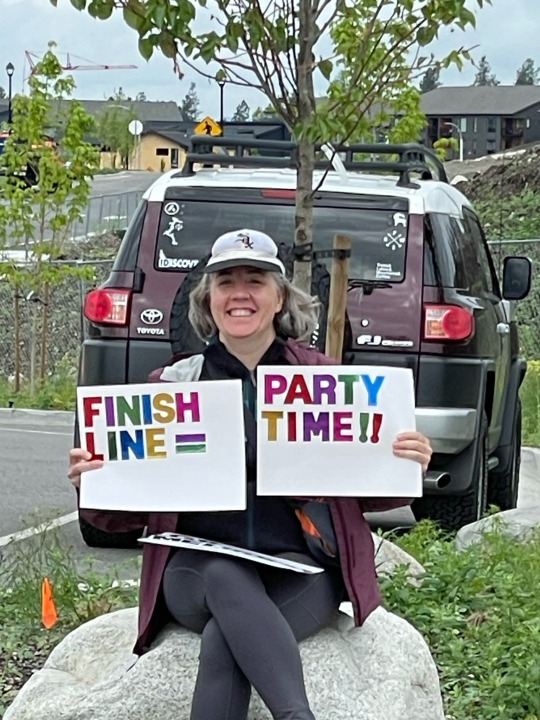
I continued on for a mile or two, going up the back sides of the earlier hills. They were longer and more difficult this direction, and I began to suspect that I had run the first third of the race too fast. I think that the ease of the hills gave me too much confidence and I pushed too hard. I was afraid the next 15 miles were going to be very difficult.
I got a boost by finally seeing all three of the girls along the side of the road. Turns out, they had missed me (because I was running too fast) and Elissa was looking for me at a point I had already passed. They made up for it by being the loudest fans on the race route! They went wild when they saw me, with signs and a cow bell. They shouted my name, and then Christie shouted “she has a blog” which put a huge smile on my face. A runner near me said “you have awesome friends” to which I replied “I sure do!”

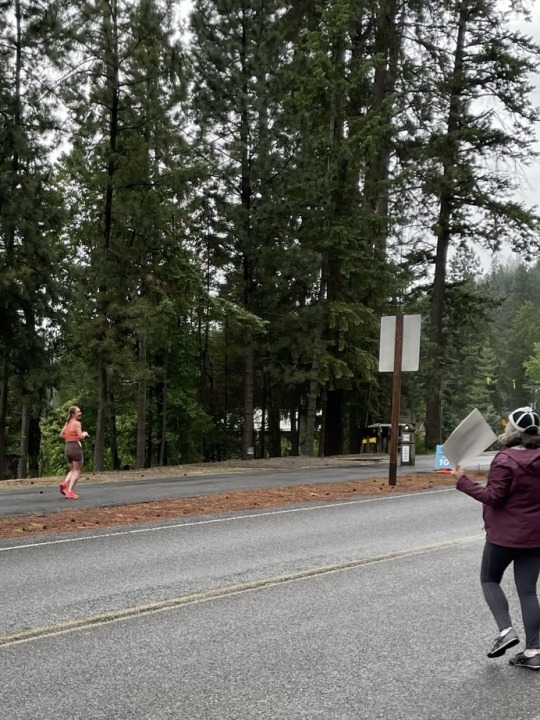
We continued on as the day heated up. The race field was very small, so there were very few people around me (probably why I could hear my competitor’s shoes so distinctly). Also, that means very few spectators. Overall, I think this was the quietest race I’ve ever run. The aid stations were very sparse too. One every four to five miles was too little as it got hot. To make the stations worse, they featured individual small bottles of water, not cups, and the bottles weren’t open! It was not good. Upon approaching a station, you had to stop, get the bottle, and wrestle with the cap. Then drinking out that little spout was challenging. I choked the first time and then elected to walk and drink the rest of the stops.
We came back through downtown Coeur D’Alene, where the race started and where the half marathon was finishing. It was a party for them, but it felt lonely running past and not stopping. At this point we began sharing the route with the half marathon too, and it got crowded. I was feeling really sluggish, knowing that I ran too hard in the first half, and I still had at least 11 miles to go. Additionally, I was so thirsty. I couldn’t remember having water since mile 12.
I began to freak out. This happens sometimes when I don’t know when the water opportunity is going to arrive. I look ahead and if I don’t see it, I start panicking. I was still sweating, which was good, but since I was slowing down, I felt like time was running out for me. And the miles just kept passing without a stop. Finally, I came up on one. It was on the opposite side of the road, where the half marathon was coming from their turn around. I needed that water, but I was told by a volunteer that OUR water stop was coming at the turnaround. I was a bit confused, and I couldn’t figure it out exactly, but I wasn’t worried because the girls were right there to cheer me on!
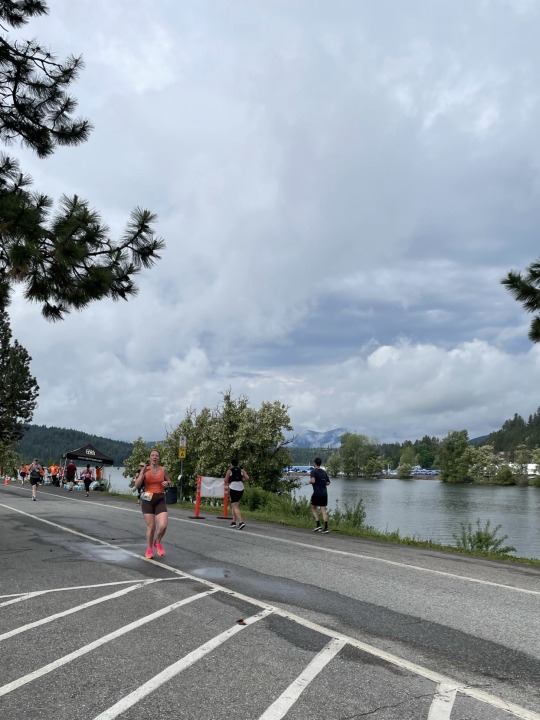
Yay! I get to see them and I get to drink the water bottle that I had given them at the starting line. It was at least half full and I had passed it off to them, telling them to toss it, but I was sure they kept it.
I was a mess, but I was able to eek out “could you give me my water bottle?” They just smiled and were cheering. I said it a bit louder, and Christie seemed to process it, but no one else. I said it again, and Christie got Elissa’s attention and said “do you have her water?” Elissa, looking very forlorn, said “she told me to throw it away so I did!”
Man. That was a blow. But I told them it was ok and I pushed on. I felt terrible for stressing them out, because I could hear the ensuing conversation as I left. I was scanning everywhere for our turnaround or for another aid station when reality dawned on me. First, that volunteer thought I was with the half marathon and that turnaround was eminent. Second, that aid station was running out of water and they didn’t want the oncoming runners drinking it. And third, I was going to have to wait at least four miles for the next water.
This is the point that I begin my hallucinations. I start thinking about what discarded thing on the side of the road I can drink from. I think about what residences or stores may offer me water. I think about turning around to get the water again. Believe me, I’ve been thirsty like this before and I always have these crazy ideas.
As I was losing hope, I found a savior. A family along the course was hosting a party to watch the marathon from their backyard. They had real cups set up with ice cold water. I was almost brough to tears. I drank two cups and thanked them so much. I’m not sure what I could have done without them. Soon after I saw two kids with offering lemonade to the runners. They were on the opposite side, but I made a mental note to take the lemonade on the way back because they looked sad that they weren’t giving any out.
The girls hurried ahead and saw me at mile 21, apologizing profusely for their lack of water. I think they even had a bottle to offer me! But that was old news, and I needed to keep racing, so I just said I was ok and continued on. I was searching for the final turnaround, which felt like it would never come. I kept doing the math for how far we had to run back and I felt like it should be around every turn. On my right were baseball fields full of teams warming up. I thought about my son at his tournament that weekend. I was sad to be missing it and really wanted to make my absence worthwhile by running a good race. Finally without much fanfare, the turnaround appeared and I had a huge wave of relief. The home stretch was in my sights. And my feet began to fly! Turns out, since mile 15, I had been running a gradual uphill. That’s why I was so sluggish and so exhausted!
My legs were back and my spirits were high. I arrived at the lemonade stand ready for an injection of sugar and asked for a glass. The kid said “that will be a dollar…” HAHAHA! I said “oh honey…I don’t have any money!!!” and laughed as I ran away. That’s why they were having such a tough day: no sales.
On the way back through I saw the girls and said “see you at the finish.” I was working to stay ahead of my competitor, and I knew she was slightly behind me from the turn we made. I never ever race anyone, so this was new to me, but from everything I’ve heard anecdotally, you are not supposed to look behind at your competition. It puts you off kilter, and it shows them that you are threatened. I kept my view straight ahead, though I was dying to look. There was one turn that I knew I’d be able to glance to the side and see her, around mile 23. I decided to turn my head, and she was back at least 100 yards…walking! I knew I had the victory!!!
By this point we were incorporated with the half marathon again, and with those who had started the marathon early. We were approaching the finishers’ village, which was just past the resort hotel I was staying in. It was very clogged up and I was keeping my eye out for the first finishers wearing medals which is my sure sign that the finish is close by. I was also having a hard time understanding which direction to run toward the finish because it was poorly marked. I started to panic when I thought about running too far or finishing in the wrong place and having to turn around.
Just then I heard some women cheering my name, but it wasn’t the girls! It was a mother-daughter duo from California with whom we had white water rafted the day before. What perfect timing! The daughter had planned to run the half marathon, so I guess they were just leaving the finishers’ village. It put a huge smile on my face.
My smile quickly faded as I continued to search for signs of the route to the finish line. I felt like I was all alone as there were no runners or spectators along this final segment. I should have been able to see the finish line, but I couldn’t and it felt like I was just running to nowhere. Then I realized that I needed to make a final turn and then another to see the end and I sped up a little through that inspiration.
I came through and looked around, expecting the girls to be along the sidelines. I searched the crowd, and then finally saw them standing near the entrance to the refreshments. They were so excited for me! I was thrilled to be done, and so happy they were there. Within a few moments, my competitor came through the finish. She told me “good job” and I confessed I had been working to beat her! She kind of laughed, and then slinked away.


My time was good enough to beat two of my four goals: under 4 and Boston Qualified. I could not have run a personal best on that course, due to the hill profile. I was happy with my time but a little frustrated that I had trained so hard and the course was just too tough to fly through. The final goal was age group winner, and although I thought I definitely got in the top three, I didn’t figure I did it. Elissa (former journalist) when to investigate and she hurried back with news. I had won my age group! I was stunned. I got tears in my eyes (and so did Veronica). It was so very exciting to be on that podium as the winner, even though I only got a crummy pint glass (not a medal) as my reward.

1 note
·
View note
Text
Free Workflow Design Tool
Creating a flowchart is an excellent way to visualize workflows and communicate them to your team members. Flow charts help reduce confusion and misunderstandings by clearly identifying the steps involved in a process.

There are a number of free workflow design tool options available to help you create and edit your flowcharts. These free tools can make it easier to visualize methods, understand the logic behind a process, and simplify complex concepts.
Piktochart offers a variety of templates and a variety of shapes to choose from, making it easy for anyone to start creating their own diagrams. It is a great tool for mapping out customer journeys, information hierarchies, organizational charts, and more. Its drag-and-drop functionality and HTML5 editor help improve visual communication and collaboration in teams. It’s also compatible with the Atlassian platform.
Grapholite is another popular tool for creating workflow diagrams, UML diagrams, office layouts, and more. Its intuitive interface and intelligent algorithm help users easily connect the different elements of a chart. Its cloud-based solution enables real-time collaboration between teams, and it can be integrated with Google Drive.
youtube
Another option for creating a free flowchart is Lucidchart, an AI-powered tool that automatically formats your chart with intelligent formatting. It helps your chart maintain its arrangement when you move, add or remove elements by adjusting the spacing between the different nodes in the flowchart. It is also a great choice for creating workflow charts, mind maps, and decision trees.
SITES WE SUPPORT
Workflow Management Design – Wix
1 note
·
View note
Text
What did Star Stable not want us to see?

…At least not yet.
(In this post, I present the portal room’s murals in the order they are seen from right to left, as this is the order one will walk past them when going to them either from the steps to the portal or directly from the portal room’s entrance. Concept art from Viktor Porse Schalin’s website.) I suspect Tumblr will mess with the image quality, so here's a link to the high-quality image of the murals.
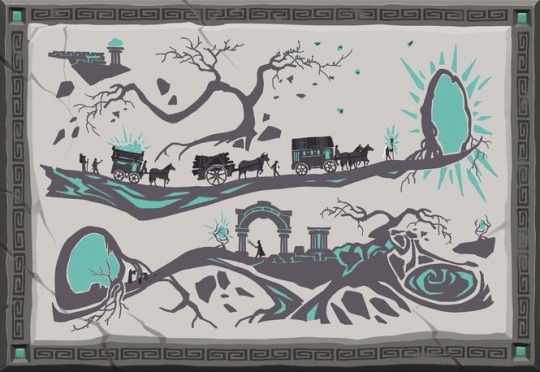
This image, the first of the murals from right to left, is not broken even in the portal room. This image lets us see a few things more clearly, though. A few figures with long, white hair are present—those are the only people seen wielding staffs. The figure leading the caravan has the longest hair and is also wielding the brightest glowing staff. At the back of a caravan is a figure carrying a large backpack and wielding a staff which does not glow.
The white-haired figure in the bottom left seems to be facing smaller objects lying on the ground next to its staff, which is not glowing. It is reaching its arms towards and being watched by a white-haired figure holding a glowing staff, though this staff glows weaker than the one being held by the figure leading the caravan.
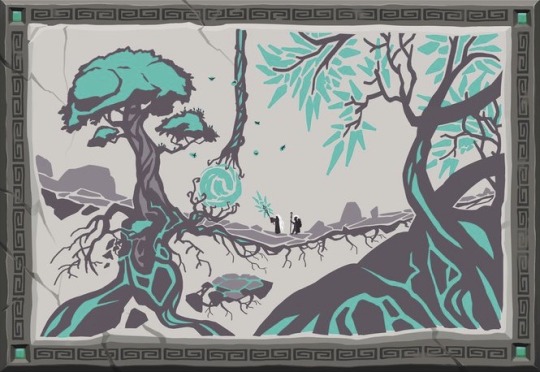
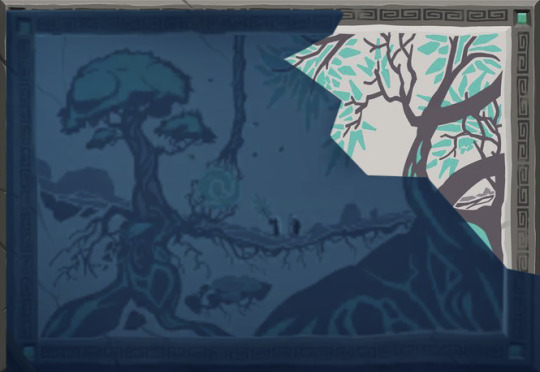
The second image shows two white-haired figures both carrying staffs; one not glowing and one glowing brightly. The figure leading the way here seems to be the same one that led the caravan in the first image. The other figure is carrying a large backpack.
In Fort Maria’s portal room, a corner of this image is broken off. That corner shows the crown of a giant tree. Its leaves resemble the rays of light surrounding the figures’ staffs and some of the goods, a small spherical object being held by a small tree, and one of the portals in the first mural.


The third mural seems to be a map, presumably of Jorvik’s Primeval Trees.
In Fort Maria’s portal room, three large pieces of this mural have broken off. The bottom left piece depicted part of an image of tentacles coming out of what looks like stone and water (waves can ben seen right below the tentacles). The bottom left piece depicted a small tree holding a sun-like spherical object surrounded by rays of light, much like the other small trees in the mural, with a stone path leading up to it. The top piece depicted three things: the top of a tree bearing heavy resemblance to the Wildwoods’ Sentinel Tree; a heavy meteor shower; and something that looks like a portal situated next to a hill with trees growing on it. The trees could be either spruce, fir, or pine.

Image courtesy of Jorvikipedia.
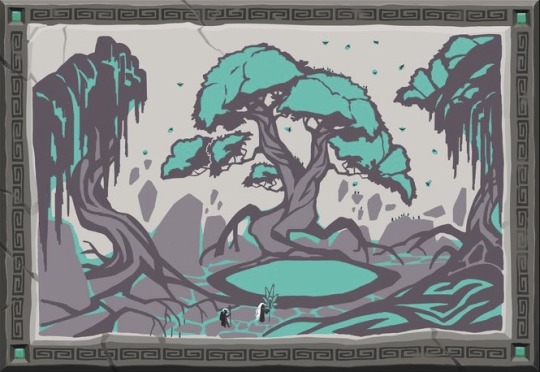

The final mural depicts three large trees.
In Fort Maria’s portal room, this mural is by far the most damaged: the centre third of the mural has been completely broken off. The missing part of the mural provides a clear depiction of the third, central tree, which bears a resemblance to the smaller tree in the second image. Below the tree is a large, circular glowing area—perhaps a portal. Across the glowing area from the tree stand two white-haired figures. The one with the longer hair holds a brightly glowing staff and stands in front, facing the tree. The other figure is carrying a large backpack and holding a staff which does not glow, and is looking slightly away from the figure in front and the tree. These appear to once again be the same two figures that appeared in the first and second murals.
With all of this in mind I am still confident the intended order to initially see the murals in is right to left (which is also supported by the increasing amount of things and weight of the things missing from each mural when read right to left). However, I think the story of the murals is to be read and understood in the following order:
4. The two figures, a leader and their follower, depicted discovering a great source of power—a Primeval Tree.
2. The leader and their follower journeying along the Weald Weave, the paths between the Primeval Trees, and charting it out.
3. The map of the Primeval Trees and the Weald Weave that was subsequently made.
1. The pathways have been deemed safe and are now an important mode of traversal and transport. Large-scale exploitation, if you will.
Now, one might assume these murals depict the Vala, and that could very well be the case. It’s just… I don’t remember ever hearing about the Vala coven’s large-scale transportation of goods through the Weald Weave, which they treasure and guard very dearly. Therefore, I raise a different theory. One I think the people of Tumblr will like very much.
The leader and the follower might be Jon Jarl and Gunnar Thrymson.
Or it might not. Even if it’s not Vala, maybe it’s early Druid settlers?
Either way… I can’t make that part with the goods transportation fit in with the Vala.
Things I can’t quite figure out:
- In-story, why are the murals broken? Why some more than others?
- Purely from a game developer “they shouldn’t see this yet” perspective, the meteors have to hold significance—look at how deliberately they were cut out. Why? In what way?
- In the first image (right to left), who are the two people on the bottom pathway? They’re facing each other, and the figure on the left is even reaching its arms out towards the other figure. Take a look at their surroundings as well: the portal and the stone structure make the place they’re in strongly resemble Fort Maria’s portal room.
#sso#z talks#ssoblr#star stable online#star stable#sso theory#it’s half past midnight I uhhhh am gonna sleep now#started doing this at like 10:30#haven’t written one of these in a while. feels good man feels good
75 notes
·
View notes