#c graph programs
Explore tagged Tumblr posts
Visit Tumblr Blog
Explore Tumblr blogs with no restrictions, modern design and the best experience.
Last Seen Tumblr Blogs


Fun Fact
When “GIF” was named word of the year in 2012, Oxford Dictionaries U.S.A. credited Tumblr for pushing the word.
Text
Got jumpscared by my own full legal name showing up in my email notifications bc I forgot I emailed my code to myself today just in case my VM ends up stopping working again (I got nervous & didn't wanna lose my progress lol)
Goldfish level memory retention
& the funny thing is that the email itself is just. This

Full Legal Name code • hi
#speculation nation#title 'code' email is just 'hi'. with the .c file attached of course#honestly i had a very productive day in lab today. i got the core structure of the program down and made sure it all worked#testing it with One of the sorting algorithms. and it worked!!#the lab is to code functions for different kinds of sorts. like bubble sort selection sort and uhh. some other shit idr rn#and have the functions take timestamps from before and after they run the sorts to calculate the elapsed time#and we have to run this for array sizes of like. 10 50 500 etc etc up to like 50000 or smth? if i remember right.#and then once all that's done we take the output and graph the time elapsed for each type of sort/search per array sizes#so today at lab i made the random array generator function. a swap function. the execution function. bubble sort. and main.#main calls the execution function passing in the array sizes. execution(10); execution(50); etc#execution defines the array of that size. then calls the random number generator to populate the array. then passes it to the sort functions#tested with my one bubble sort function. which finished in like 0.00003 seconds or smth for array size 10#BUT taking the time stamps was tricky. there are a lot of ways to do that. and time(); in c is in full seconds#i ended up asking the TA if he had a recommendation for what to use bc theres a LOT of time functions out there#and full seconds isnt precise enough for this purpose. & he recommended clock()!!#records number of clock ticks which is NOT the same as seconds. but when u divide it by uh. forgetting it rn but it's a constant#that will turn it into actual seconds. clock tics per sec?? smth like that.#so anyways very productive 👍 i just need to set main up to call execution function for all the different array sizes#and then write all the functions for the different sorts/searches. but i have the core structure down with the bubble sort function#(specifically with the time stamps and the print function after) that i will copy-paste for all the other functions#and then inside them i put the basic code. none of it's complicated. all can be found on the internet easy.#SO!!!!! honestly i think itd take me less than an hour to finish. tho plotting out that graph is going to be annoying#something like 6 sizes per 5 sort/search functions. painstakingly copy pasting each one into excel or smth lol#but yea im content with how much ive gotten done. yippee!!!!#now i just need to finish my web programming lab before sunday night. blehhhhh
2 notes
·
View notes
Note
Can you do one about the Sea of Thieves water?

OK
so . there was a biiig long talk about this at siggraph one year!! you can watch that here if you'd like . in the time between me getting this ask and me fully recreating the water, acerola also released a great video about it . the biiig underlying thing they do and the reason why it looks so good is they are making a Really Detailed Ocean Mesh in realtime using something called an FFT (fast fourier transform) to simulate hundreds of thousands of waves, based on a paper by TESSENDORF
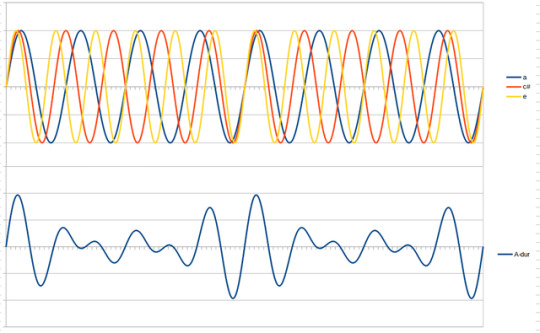
WHAT IS AN FFT - we'll get to that. first we have to talk about the DFT - the discreet fourier transform. let's say you have a SOUND. it is a c chord - a C, an E, and a G, being played at the same time. all sounds are waves!!! so when you play multiple sounds at the same time, those waves combine!!! like here: the top is all 3 notes playing together, so they form the waveform at the bottom!!
now if someone handed you the bottom wave, could you figure out each individual note that was being played? how about if someone handed you a wave of One Hundred Notes. you would think it would be very hard. and well, it would be, if not for the Discreet Fourier Transform.
essentially, there is a way to take a bunch of points on a waveform comprised of a bunch of different waves, add them all together, do some messed up stuff with imaginary numbers, that will spit back out at you what individual waves are present. i made a little test program at the start of all this: the left are the waves i am putting into my Big Waveform, the top right is what that ends up looking like, and all the little rainbow points on it are being sampled to spit out the graph at the bottom right: it shows which frequency bands the DFT is finding (here it is animated)

this has enormous use cases in anything that deals with audio and image processing, and also,
THE OCEAN
tessendorf is basically like, hey, People Who Are Good At The Ocean say that a buuuunch of sine waves do a pretty good job of approximating what it looks like. and by a bunch they mean like, hundreds of thousands to millions. oh no.... if only there was a way we could easily deal with millions of sine waves..........
well GREAT news. not only can you do the DFT in one direction, but you can also do it in REVERSE. if you were to be given the frequency graph of a noise for example, you could use an INVERSE DFT to calculate what the combined wave graph looks like at any given time. so if you were to have say, the frequency graph of an oceaaaan, for example, you could calculate what the Ocean wave looks like at any given time. and lucky for us, it works in two dimensions. and thats the foundation of the simulation !!!!!
BUT WAIT
as incredible as the DFT is, it doesn't scale very well. the more times you have to do it, the slower it gets, exponentially, and we are working with potentially millions of sine waves here
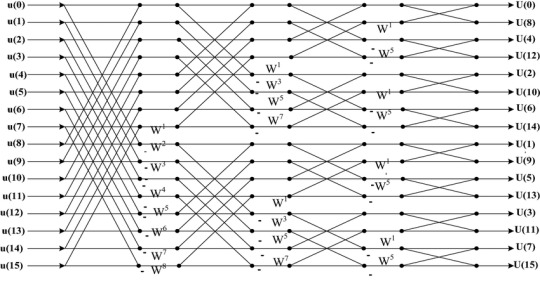
THE FAST FOURIER TRANSFORM here we are . the fast fourier transform is a way of doing the discreet fourier transform, except, well, fast. i am Not going to explain the intricacies of it because its very complex, but if you want to learn more there are a ton of good 30 minute long videos on youtube about it . but essentially, due to the nature of sine waves repeating, you can borrow values as you go, and make the calculation Much faster (from exponential growth to logarithmic growth which is much much slower, and scales very well at higher numbers). it's, complicated, but the important part is it's so much faster and the diagram kind of looks like the shadow the hedgehog story plot
so if we use the inverse FFT on a graph of a rough estimate of what frequency of waves in the ocean (called a spectrum, basically tells us things like how many small waves, how many big waves, how different waves follow the wind direction. sea of thieves uses one called the phillips spectrum but there are better ones out there!!) now we have our waves !!!!!!! we can also use another inverse FFT to get the normals of the waves, and horizontal displacement of the waves (sharpening peaks and broadening valleys) through some derivatives . yayy calculus
OK MATH IS OVER. WE HAVE OUR WAVES!!! they are solid pink and look like pepto bismol. WHAT NOW

i cheated a bit here they look better than not being shaded because i am using the normals to reflect a CUBEMAP to make it look shiny. i think sea of thieves does this too but they didnt mention it in their talk. they did mention a FEW THINGS THEY DID THOUGH
FIRST OFF - SUBSURFACE SCATTERING. this is where the sun pokes through since water is translucent. SSS IS REALLY EXPENSIVE !!!!!! so they just faked it. do you remember the wave sharpening displacement i mentioned earlier? they just take the value where the waves are being sharpened and this will pretty naturally show off the areas that should have subsurface scattering (the sides of waves). they make it shine through any time you are looking towards the sun. they also add a bit of specular ! sss here is that nice blue color, and specular is the shiny bits coming off the sun. the rest of the lighting is the cubemap i mentioned earlier, i dont know if thats what they use but it looks nice !!!!!

then the other big thing that they do is the FOAM !! sorry i lied. there's more math. last one. you remember the wave sharpening displacement i Just mentioned. well they used that to find something called the JACOBIAN and well im not even going to begin to try and explain what it means but functionally what it does, is when the jacobian is NEGATIVE it means waves are clipping into eachother. and that means we should draw some foam!!! we can also blur and fade out the foam texture over time and continuously write to it to give it some movement, and bias this value a bit to make more or less foam. they do both of these!!!

YAYYYYY !! OK !! THAT'S SEA OF THIEVES WATER!!!!! THANKS FOR WAITING ALL THIS TIME. you can see my journey here if you would like to i have tagged it all oceanquest2023
thank you everyone for joining me :) i had fun
1K notes
·
View notes
Note
hi so I want to be an electrical engineer, do you mind if I ask if you have any advice?

Low quality picture of a crow (?)
Of course!! My asks and dms are always open
If you want advice on anything specific lmk! Any questions at all!! But some general tips
-Don't let your math skills get rusty. There is a lot of math. Also invest in a good graphing calculator
-Learn to use a CAD and/or circuit simulator program like ltspice or altium(there are plenty of free ones out there I just cant remember any altium alternatives rn) and get some practice with them, they'll come in clutch
-If you plan on doing pure EE(I'm combined computer/electrical), get familiar with matlab and the like, it's probably the most "coding" you'll need. If you want to do combined computer/electrical, get familiar with basic coding. Most people recommend python for this. I cannot provide recommendations because my first programming language as a kid was C and thus my expectations are way out of whack
-V=IR is your most bestest friend. Save me ohm's law and nodal analysis
-To directly quote one of my lab manuals from an advanced EE practical lab: do not lick the circuits
16 notes
·
View notes
Text
I’m trying something new here, which is to write off the cuff, with little editing, and press the “post” button without much thought. I’m doing so because this is the first spare moment I’ve had to respond to
Bassoe’s response to my review of C.M. Kosemen’s soon-to-be published book All Tomorrows, and I don't want to let this interesting conversation wither on the vine.
If you had trouble following that last sentence, it’s enough that you know this: we’re talking about the evolutionary future of humanity.
The Machine-God Scenario
Bassoe talks about “machine-gods...obsessed with tending to the well-being of an inferior species” where “the only remaining selection pressure is desire to reproduce.”
Another selective pressure would be to make ourselves adorable to the machine-gods. Perhaps the gods have a template for what they consider to be human, in which case we'll only be able to evolve in ways that don't deviate from that template. I'm reminded of a Stephen Baxter story (Mayflower II) in which humans on a generation ship turn into sub-sapient animals, but they still press buttons on the control panel because that behavior is rewarded by the ship's AI.
The Super-Tech Scenario
But I agree that even without a super-tech future where all our material needs are met, the availability of contraception means that there's a selective advantage to people who don't use contraception. There are many ways for evolution to make that happen. An instinctive desire for babies or an instinctive aversion to contraception are two such ways. I remember a Zach Weinersmith cartoon where he jokes about future humans with horns on their penises that poke holes in condoms, but of course any such physical adaptation won't be able to keep up with technological innovation. We will have to *want* babies.
Another option is (ala Kurt Vonnegut's Galapagos) that future humans aren't smart enough to use contraception.
The Artificial Womb Scenario
In this case, I think the most selected-for humans are the ones that are most efficiently produced by the artificial wombs. Maybe it's easier to pump out limbless grubs, which are fitted with cyborg arms (see John C. Wright's Myrmidons in his Count to the Eschaton Sequence). The form they take will depend on the parameters of the machines' programming. (see also Vanga-Vangog's The Endpoint)
The Collapse Scenario
I think this scenario is unlikely. If "life, uh, finds a way," then intelligence finds even more ways. When one resource runs out, we find another. The mere fact that you don’t know what the next resource is just means we haven’t found it yet.
But say for the sake of argument that there's a hard limit to technological progress (ala Vernor Vinge's A Deepness in the Sky) or science really is like mining, and it takes infinitely increasing resources to make the next marginal gain in technology. In both cases, you'd expect the graph of human advancement to look like a population when it hits carrying capacity. Exponential growth (we're doing that now) followed by a cycle of die-offs and re-growths, converging to a horizontal mean.
With no ability to innovate, natural selection would take over from technological progress. Once we’ve eaten all the meat and potatoes, there will be strong selection for people who can digest grass. I would expect humans in this case to diversify until our descendants occupy nearly every niche, absorbing most of the matter and energy available on Earth (at least). Whether these people are intelligent or not...probably not. @simon-roy seems to be hinting in this direction with his masterful comic series Men of Earth.
But I don't actually think collapse is likely. I bet that our population (and technological advancement) will not hit an asymptote, but will instead as progress according to a power law, as with the bacteria in Lenski's Long-Term Evolution Experiment.
The Mogul Scenario
Bessoe asks about a future in which “our cultural norms stick around indefinitely, those who generate more profit reproduce,” which I very much doubt.
In 20th century America, the more money you made, the fewer children you had. Now, it seems there's a saddle-shaped distribution, with the very poorest and the very richest women having the most children per woman. This is sure to change again, and faster than evolution can keep up. Perhaps you could say that if contraception pushes us to evolve an instinctive desire to have more children, and rich or powerful people will be in positions to gratify these instincts, then whatever traits make someone rich and powerful will be selected for.
Maybe, but now's a good time to go back to the Reich Lab's "Pervasive findings of directional selection," summarized here by the illustrious Razib Khan.
In comparing ancient to modern DNA, the Reich Lab found evidence for selective pressure in humans in Europe since the end of the Ice Age: increased intelligence, increased height, decreased organ fat, increased walking speed, decreased susceptibility to schizophrenia, increased immunity to many diseases, and, funnily, increased tendency to home-ownership and university education.
Obviously people weren't going to college in the Chalkolithic, but whatever traits make someone likely to go to college now have been selected for since the arrival of agriculture in Europe. You can paint a plausible picture of the sort of people who were most reproductively successful in the past six thousand years, and there is even some evidence for selection in the range of 1-2 thousand years. Aside from obvious things like immunity to smallpox and Bubonic plague, Europeans have gotten paler and blonder, and more of us are able to digest lactose than in Roman times.
But the 21st century is very different from the 1st, which in turn was very different from the pre-agricultural -70th. Maybe you can say that being smart, strong, and disease resistant have always been good, and being tall and baby-faced gets you some sexual selection (almost everyone seems to have evolved shorter jaws and lost their robust brow-ridges in parallel). So we can imagine future humans who just all look gorgeous.
read on (and see the pictures)
23 notes
·
View notes
Text
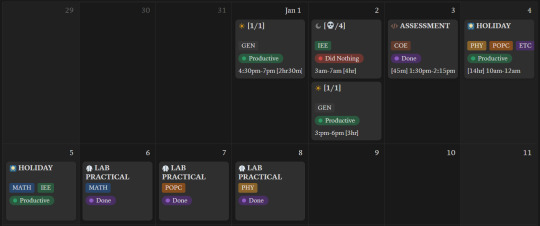


LAB PREP + PRACTICALS WEEK [1st Jan - 9th Jan]
a quick summary!
happy belated new YEARRRR (we're six weeks into the new year time is so slippery and for what T_T)
I finished like 10 pens writing assignments and record books this week and didn't study at all so I failed an html mock assessment thing lol but its cool
the events of each lab: math: it was python, but they taught us jack-shit so I ended up memorizing the programs 2 hours before the lab, and passed with flying colours 👍 there was no viva thank god c lang: they gave us 10 programs to study and I'd actually pre-prepared for this because our professor tricked us into thinking it was a week before. I spent like 20 hours straight learning these programs a week ago and it didn't even happen T_T it went fking amazing though, and so did viva!! I got full marks!! :D physics: studied the experiment write-ups the night before and kind of forgot some of it because the experiment I ended up getting had some heavy content - there were so many tables and so many graphs T_T - I persevered though and breezed through the actual experiment conduction because I'd been teaching it to my lab-mates the past week! I thought my viva went disastrously BUT I passed with a 0.4 deduction only!!
my uni's tea is the best tea 👍
18 notes
·
View notes
Text
I need to be so clear here.
My distain for people who use ChatGPT to do their schoolwork is not because I think they’re stupid, it’s because it is so supremely lazy to do that, that I know you didn’t pay attention to any of the class.
I have been a c-average student my entire school career including college. And I have fought for my life to get that c-average because it turns out that ADHD really can severe learning disability.
But the thing is. The thing is that when I put in the bare minimum effort to understand the material, and managed to exhaustedly churn out the “kuzco’s poison, the poison made especially for kuzco” version of it, I got fucking c’s and b’s on it. I’m talking paraphrasing what my textbook said and putting it down. I’m talking I once wrote a 10 page paper debating the negatives of net neutrality (something I vehemently didn’t agree with) with a PATHETIC poll of sources, desperately rambling to fill space, and as many graphs as I could muster, and I got a B on it.
And see, I can understand using something LIKE ChatGPT which you could enter info into to receive a summary of it for studying, or a grammar checking program, or even something meant to take your words and format them more nicely.
I even understand cheating methods! Because at least then, you are having to copy things down or format a cheat sheet, or search thru course material to find your answer, and that’s a valid way to learn in my opinion. I did much better in school both at learning things and at taking my tests when I was allowed to format 1 notecard of information to use on the test. It was an extra chance to study in a way that actually worked for me.
I know that school is stressful and overwhelming, but the idea of so thoroughly not paying attention to your classes that you can’t bullshit out a writing assignment is so incredibly pathetic and lazy to me.
This isn’t a disability accommodation or whatever. This is paying someone else to do your homework so you can play on your phone during class.
#chatgpt#like even setting aside that the thing is wrong a LOT.#this is stupid and pathetic. bullshit a paper like god intended
7 notes
·
View notes
Text
I’ve been thinking about this for a little while — something I’d want to do if I had the time and money would be to design a Motorola 68000-powered tiny (10” or smaller) laptop. Modern CMOS 68K implementations are very power-efficient and decently well-suited to handheld and portable devices (see: TI-92 series), and if combined with a crisp, modern monochrome OLED display, could get you days of continuous usage without needing a recharge! Add a few megabytes of RAM, some peripherals (IDE/CF controller, ISA or S-100 slots, DMA controller, SPI bus, RS-232 port, SD or CF slot, PS/2 port for a mouse, text mode + hires monochrome video card, etc…), and you have a nice, flexible system that can be rarely charged, doesn’t require ventilation, and can be just thick enough to fit the widest port or slot on it.
The main issue would be software support: nearly all existing operating systems that ran on a 68K were either intended for very specific hardware (Classic Mac OS, AmigaOS) or required more than a flat 68000 (NetBSD, Linux, or any other UNIX requiring MMU paging). So, it would probably end up being a custom DOS with some multitasking and priv level capability, or perhaps CP/M-68K (but I don’t know how much software was ever written for that — also, it provides a “bare minimum” hardware abstraction of a text-mode console and disk drive). A custom DOS, with a nice, standard C library capable of running compiled software, would probably be the way to go.
The software question perhaps raises another, harder question: What would I use this for? Programming? Then I’d want a text editor, maybe vi(m) or something like that. OK. Vim just needs termcap/(n)curses or whatever to draw the text, and not much else. That’s doable! You’d just need to provide text-mode VT100 emulation and termcap/curses should “just work” without too much issue. I like writing C, so I’d need a compiler. Now, I’m assuming this simplistic operating system would be entirely written in a combination of assembly language (to talk to hardware and handle specific tasks such as switching processes and privilege management and whatnot) and C (to handle most of the logic and ABI). I could probably cross-compile GCC and be good to go, aside from handling library paths and executable formats that don’t comply with POSIX (I have no intention of making yet another UNIX-like system). Hopefully, most other command-line software (that I actually use) will follow suit without too much trouble. I don’t know how much work it is to get Python or Lua to a new platform (though NetBSD on the 68K already supports both), but Python (or Lua) support would bring a lot of flexibility to the platform. Despite me being a Python hater, I must admit it’s quite an attractive addition.
What about graphics? All the software I’ve mentioned so far is text-mode only, yet historical 68K-based systems like the Mac and Amiga had beautiful graphics! Implementing X11 would be a massive pain in the ass, considering how much it relies on UNIXy features like sockets (not to mention the memory usage), and I really don’t want Wayland to have anything to do with this. I guess I’d have to roll my own graphics stack and window manager to support a WIMP interface. I could copy Apple’s homework there: they also made a monochrome graphics interface for a M68K configured with a handful of MiB of RAM. I could probably get a simple compositing window manager (perhaps make it tiling for a modern vibe ;3). Overall, outside of very simple and custom applications, functionality with real software would be problematic. Is that a big problem? Maybe I want an underpowered notebook I can put ideas and simple scripts down on, then flesh them out more fully later on. An operating system allowing more direct access to the hardware, plus direct framebuffer access, could yield some pretty cool graphing/basic design utility.
I’d need a way to communicate with the outside world. An RS-232 UART interface, similar to the HP-48 calculator (or the TI-92’s GraphLink, only less proprietary) would help for providing a remote machine language monitor in the early stages, and a real link to a more powerful (and networked) machine later on. I think real networking would defeat the purpose of the machine — to provide a way to remove yourself from modern technology and hardware, while retaining portability, reliability, and efficiency of modern semiconductor manufacturing techniques. Giving it a CF or SD slot could provide a nice way to move files around between it and a computer, maybe providing software patches. A floppy drive would be amazing: it would provide a way to store code and text, and would be just about the right storage size for what I want to do. Unfortunately, there’s not really a good way to maintain the size of the laptop while sticking a 3.5” (or worse, 5.25”) floppy drive in the middle of it. To my knowledge, 3.5” floppy drives never got thin enough to properly fit with all the other expansion slots, socketed components, and user-modifiable parts I’d want. A completely solid-state design would likely be the best option.
Anyway, uhh… I hope this made some semblance of sense and I don’t sound insane for going on a rant about building a modern computer with a 1979 CPU.
5 notes
·
View notes
Text
So High School ft. Adam Cole | Chapter 4

The days and nights passed, as they always did. Kyle and Janie’s visit brought some much needed positivity in the household, despite the days leading up to Austin’s surgery. He wouldn’t admit it out loud, but he was nervous. Maybe not as nervous as when he had his concussion and was checking in with the brain doctor three times a week, but nervous nonetheless. The surgery wouldn’t take more than an hour. He could start physiotherapy three weeks later, which was a blessing because he was becoming a bit stir crazy not being able to go to the gym. But anytime he had to be put under, he got nervous.
“D’you want to watch anything before bed?” Violet asked as she emerged from their ensuite, switching off the light.
“No, I’m good,” Austin shook his head. “I want to get a good night’s sleep before the surgery. Well, at least try to.”
As Violet got into bed, she got as close as she could to him before giving him a few quick, light kisses. “I’ll make sure I’m the last person you see before you go under and the first person you see when you wake up.”
Austin smiled. “I’m gonna wake up high thinking you did the surgery and that’ll scare me shitless.”
Violet snorted and they both began giggling, lightening up the mood. “God knows med school wasn’t my calling,” she quipped.
“I think you did pretty good regardless.”
“I have you, don’t I?”
Austin smiled. He loved her so fucking much. “C’mere,” he whispered, wanting her close again so he could kiss her one, two, three times, each time longer than the last. “I love you.”
Violet kissed him again, and again, and again – hands wandering, tongues making a mess. It wasn’t long before her hand made it under the waistband of Austin’s boxers. “Let me show you how much I love you.”
***
On Tuesday after school, as Violet was making her way to the bus stop, she saw Austin waiting too, but noticed his demeanour was completely different than how she knew it. He was angry. Not just angry – pissed. She made it just in time to get on the bus, and they took their usual seats, Austin letting her get into the window seat before sitting beside her. “Is everything okay?” she asked, worried.
“No, everything is not okay,” he grumbled.
“What’s wrong?”
He sighed. “Stupid math.”
“What happened?”
“I failed my last test on polynomial graphs,” he revealed. “My teacher says if I don’t get at least a 70 on the next test my mark is gonna dip below a C, and I can’t – my parents have this stipulation that all my grades have to be above a C or else they don’t let me go to wrestling shows in Philly.”
After their conversation at Francesco’s after the dreadful party, she knew and understood how important that was to Austin. “I can help,” she offered.
Austin was still in his own world, though. Still spiralling a bit. “Not to mention that if my overall average isn’t high enough, Manheim Community Centre won’t hire me in the spring and summer to do swimming lessons as part of their student hiring program, and I really need that job—”
“—Austin.”
He snapped out of it. “What?”
“I can help you,” Violet repeated. “When’s your test?”
“Friday.”
“That means we have three days to study,” she said assertively. “We’ll study at your house every day after school until the test, until you’re confident you can get that mark.”
Austin was flabbergasted. None of his other friends had volunteered their time or energy to help him. Violet was the only one who was going to willingly take time out of her own schedule and homework – which was more academically challenging than his, no doubt – to help him, all so he could get a C. “You’d do that for me?”
“We’re friends, aren’t we?” she quipped back. “Besides, I know now how much wrestling means to you. You shouldn’t not go see shows just because of a math mark. I mean, I understand why your parents have that stipulation – mine do too – but math shouldn’t get in the way of it.”
Austin nodded. There was a moment of silence between them as he realized the magnitude of Violet’s generosity. “What’s your parents’ stipulation?” he asked.
“Straight As are a non-negotiable. That and at least two extra-curriculars. That’s why I’m so involved in student government and the school newspaper,” she revealed. “Plus, I do this language program at home – you know how like, kids will go to Greek school or Hebrew school on the weekends? Well mine is online and it’s basically German school. That way I can speak to my grandparents. Oh, and I play tennis.”
Austin felt his head spin at the thought of everything she had to do on top of all her regular school work. Jugging all that with expectations of getting into an Ivy League like UPenn or a university like Georgetown? He’d be shitting himself. “Does it ever get hard for you…you know, balancing everything?”
Violet bit her bottom lip and averted her eyes. “I mean, yeah, sometimes,” she mumbled out, as if she didn’t want to. She knew she had to be honest with him because he was only ever honest with her. “It can be a lot, like when things start to add up over the week, especially when I want to have a social life, you know? Like at the end of the day I’m just a teenage girl. I want to be out with my friends and at the same parties they are.”
Austin nodded. “Yeah, I get it.”
“I think it’s harder because I’m an only child,” she continued. He noticed that she was picking at her signature red nail polish. “They just have high hopes for me. I get it, I really do. I just want a bit of a break sometimes. The world won’t end if I get a B on a French vocabulary test, you know?”
Austin gave her a smile. “I know,” he nodded. “The world won’t end if I get below a C in math, either.”
He raised his hand and pushed hers apart playfully, making sure she stopped picking at her nails. She looked at him finally, giving him a smile, stopping her nervous habit. Her hands were as soft as Austin remembered them.
When they arrived at his usual bus stop, they got off together and he led the way to his house, which was only a short walk down the road. As they approached the small yellow bungalow, Austin got nervous. Having seen even just the outside and front foyer of Violet’s house, the difference was night at day. He was pretty sure three of his houses could fit in her house. When he looked over at her, she was smiling. “Your house is beautiful,” she said, with such genuine earnestness that he knew she meant it. “I love the yellow.”
“My grandma’s gonna be home,” he didn’t know what else to say. He didn’t know why he was so nervous.
“That’s cool. I’m a grandma whisperer too,” she winked.
When they walked in, Violet could hear the sound of a TV being on. She slipped off her Uggs and followed Austin around the entrance wall that was covered in family photos. Photos from family vacations to the beach, Washington D.C., and some other places Violet couldn’t quite make out. “Nana, I’m home,” Austin called out.
Violet saw his grandma on the couch watching TV, and once she noticed a girl in a very formal Catholic school uniform was with her grandson, a highly bemused look adorned her face. “Hi sweetie,” his grandma greeted. “How was school today?”
“It was alright. Same old, same old.”
“And who is this?”
Austin knew he wouldn’t have to do any introductions. If the late night phone call with his mom was any indication, Violet could hold her own. He didn’t know many people who were as self-assured as she was. “Hello, it’s very nice to meet you,” Violet began, approaching the couch with her hand extended so grandma wouldn’t have to get up. “I’m Violet Schwarzkopf, one of Austin’s friends.”
“Nice to meet you. I’m Austin’s grandmother Judy,” she said. “That uniform doesn’t look like you go to Lancaster West.”
“Oh, no ma’am,” Violet shook her head, smiling a little. She broke out the ma’am – Austin had to hold back his own laugher. “I actually go to St. Anne’s Academy, down the street from Lancaster West. I’m just here to help Austin with some Algebra 2 homework for his test on Friday. I promise we’ll be out of your way and won’t be too loud.”
Nana smiled. Austin smiled at her smiling. Clearly Violet was making a great first impression. “That’s quite alright, dear. Anything to help Austin get the grades he needs to do the things he wants,” she gave her grandson a knowing look. “You’ll be fine to go in the kitchen then…the TV won’t be too loud in there.”
“Do you need anything while you’re in there? A glass of water? Some snacks?” Violet asked.
“Do you know how to make a gin martini?” Judy quipped. Everybody laughed. “I’ll be fine. You two go ahead and study.”
Austin led Violet through to the kitchen, a small U-shaped space with old wood cabinets and a big window overlooking part of the yard. There was a round table against the wall with no cabinets. Violet sat at the table while Austin went into the fridge. “Want anything?” he asked.
“Where have you guys gone on family trips?” she completely ignored his question, looking instead at some more of the family photos on the wall above the table.
Austin glanced over from behind the fridge door. “Um, before my parents divorced, we used to drive down to Myrtle Beach every summer and spend a couple of weeks there,” he said. “My dad took my brother and I to D.C. a few summers ago, and my mom took us to New York the summer after that.”
“That’s so cool,” Violet smiled. “D.C.’s pretty awesome, isn’t it? I love the Georgetown neighbourhood.”
“What about your family?”
“We’re pretty big skiers, so a lot of our trips revolve around skiing. Usually during Christmas Break we head somewhere like Whistler or Mont Tremblant or Telluride. Then in the summers its always about two weeks in Toronto so my mom can see her family, then we fly to Berlin so my dad can see his family. After that we spend time in different places like Italy or Spain or Portugal.”
The second the words finished coming out of her mouth, Violet regretted ever saying them out loud. These were rich people things that rich people did. Not everybody skied. Not everybody summered in Europe. Not everybody had the advantages that her family had, and she needed to learn once and for all that not everybody had the same life experiences she had. To say these things out loud like they were nothing, with such nonchalance as if everybody did them – who did she think she was?
“That sounds really cool,” Austin finally said, closing the fridge.
“Sorry.”
“Why are you apologizing?”
“I know that just made me sound like a stuck up brat.”
“No it didn’t,” he assured her, handing her a bottle of blue Gatorade. “I asked you a question and you answered it.”
“Yeah, but—”
“—But nothing,” he interrupted. “I know your family is richer than mine, Violet. That’s not a secret.”
Her stomach churned. “I just don’t want it to be something that comes between us,” she admitted out loud, in a voice that was low and vulnerable.
“Vi…” Austin cooed, pulling up a chair to sit, getting as close to her as he could without it being inappropriate. “If it was something that could, it would have already. It won’t. It’s not going to. I promise. Do you?”
She was barely breathing from being so close to him. What was this? What was she feeling? “I promise,” she nodded.
“Good,” he smiled at her, and she could see his dimples and the crinkle of his eyes. “Now can you help me with Algebra 2?”
They took out the textbooks and got down to business, going over concepts and equations. She looked over his test to see exactly where he went wrong. Violet even made up equations for him to practice on the spot, which freaked him out. Slowly but surely, though, he was getting it. Violet was definitely a much better and clearer explainer than his teacher at Lancaster West. She made sure he followed things step by step, and would check each time to make sure he was doing it right. It helped that she smelled good and was so pretty.
Wait, what?
Before he knew it, he heard his mom walking through the door. His younger brother was louder than she was, stomping through the house loudly and saying hi to Judy before his footsteps could be heard walking towards the kitchen. When he saw Austin sitting at the table with Violet, he stopped dead in his tracks. He looked like a deer caught in the headlights. “Whoa.”
His brother still thought girls had cooties. Austin rolled his eyes at his reaction. “Hello to you too, Brent.”
“Austin?” he heard his mom call.
“I’m in the kitchen studying!” he called back, knowing that would get a reaction out of her.
“Studying?” his mother was clearly confused. A few moments later, she appeared right behind Brent. She tried not to let the shock and confusion overcome her face, but it was no use. Her son was studying? And there was a girl over? “Oh, hello!” she greeted warmly as she saw Violet.
Violet immediately got up from her seat. “Hello Ms. Jenkins. It’s nice to finally meet you. I’m Violet Schwarzkopf – we spoke on the phone a couple of weeks ago,” she extended her hand.
“I remember. It’s nice to finally meet you as well. Call me Cathy,” she shook her hand before looking over at her son. “Special occasion?”
“Violet’s helping me with Algebra 2. I have another test on Friday.”
“I hope that’s alright,” Violet interjected.
“Anything to get Austin studying,” Cathy quipped. “Are you staying for dinner, Violet?”
“Oh no no no, no thank you. I wouldn’t want to intrude like that. Plus, on the days my dad has to stay in Philadelphia to lecture, my mom gets lonely and would want me home for dinner.”
Cathy made a mental note to ask about that sometime later. Maybe she’d ask Austin. “Well, the car is still warm, so I will at least drive you. Where do you live?”
“In The Berries.”
Cranberry Street, Blueberry Street, Blackberry Street, and Mulberry Street – Cathy knew the area well. Who would have thought her son would have a friend who lived in The Berries? Violet got ready quickly – Austin too, since he was adamant on coming – and they drive through the streets of Manheim before reaching her house. Violet made polite conversation and mentioned she’d be back the rest of the week to tutor to help Austin pass his test. Cathy was impressed with the size of the house when she pulled into the driveway, waiting until Violet was inside before backing out.
As she put the car in drive, she looked at her son. “What?” he asked.
“Oh, Austin.”
___
The following Monday, Violet couldn’t get to the bus stop after school quickly enough. Austin told her Friday that he thought the test had gone well, and she was eager to see if he got his mark back. She ran as fast as her Uggs would take her, now carrying a heavier load with the introduction of her winter jacket, too. When she finally arrived, she was almost out of breath. “Did you get it back yet?” she huffed.
Austin had the greatest poker face known to man. She didn’t even notice that he had something in his hand to show her. He flashed whatever he was holding in front of her. Violet say a big red ‘75%’ on the top right corner.
She screamed. Subconsciously, she did what she did with all her friends whenever they aced something: she extended her arms up in jubilation, then out, pulling him in for a hug. A giant smile took over his face as he reciprocated, bringing her close and squeezing her so hard he lifted her up off the sidewalk. “I couldn’t have done it without you,” he said once he set her down. “I’m totally serious. I’d be failing without you.”
“I didn’t write that test, you did!” she spun it back to him.
“My parents are gonna be so happy, you have no idea.”
“I bet. Is there a wrestling show coming up that this saves?”
He looked at her. He couldn’t believe she was hanging on to that the way she was. It meant the world to him. “Yeah. Yeah, absolutely,” he stuttered out. “Listen. I have a US History test coming up. I could really use your help again. You just explain everything so easy. Can you come over Friday night so we can have a big study session? I can still bring you home by curfew.”
Friday night. Her parents would be away at a Christmas dinner for the UPenn faculty in Philadelphia for the night, so she’d be home alone Friday night and much of Saturday since they’d be spending the day in the city. She would have to ask their permission, but she didn’t see why they would say no, especially if it was tutoring. “I’ll ask my parents, but I should be good.”
Austin smiled from ear to ear, his breath catching in his throat. “Great.”
#adam cole#adam cole imagine#adam cole fic#adam cole fan fic#adam cole fanfic#aew#aew imagine#aew fic#aew fan fic#aew fanfic#wwe#wwe imagine#wwe fic#wwe fan fic#wwe fanfic#so high school series
7 notes
·
View notes
Text
A small programing project i did for fun a few months ago
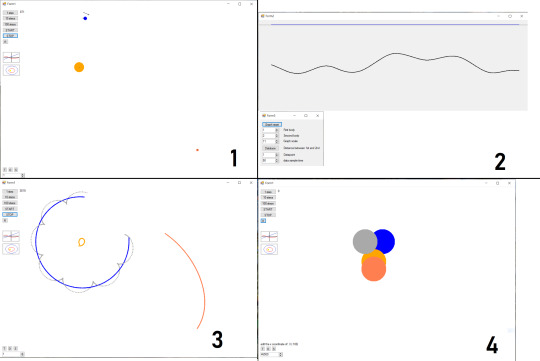
I made an n-body gravity simulation program, in C# via Windows forms, and uh, here it is. (@brightgreendandelions, you said to share these here)
The first thing it does is simulate the motion of a few balls under gravity and moves them accordingly(pic 1)
It can make the distance or force between 2 objects or the speed of an object into a graph(pic 2)
It can draw the trajectories of objects(pic 3)
And you can edit the positions, speeds, sizes and masses of the objects.(pic 4)(have a dong please)
I'm now working on a 3D version of the same thing, with added pizzazz and sparcles and whatever.
56 notes
·
View notes
Text
The Medicare Casino
by Thomas Eddlem | Jan 13, 2025
Is Medicare a good program, financially speaking, for ordinary working people?
Medicare Part A (the part that’s funded by payroll taxes) spent $394.6 billion in 2024 for the approximately sixty million of the over 65-years-of-age Americans on Medicare Part A (about 11.8% of the total recipients of the sixty-eight million people on Medicare are under 65 years old and generally not part of Medicare Part A). This means Medicare Part A paid out an average of $6,577 for each of its sixty million recipients in 2024.
It’s important to stress that this analysis is designed to evaluate Medicare Part A only, as it is the only part of Medicare the federal government claims is funded directly by worker payroll taxes. Medicare parts B and D are not assessed with this essay (nor is Part C, Medicare Advantage, other than the proportion in which Part A is assessed), as these have been openly welfare programs from the start, and are almost exclusively funded by general government revenues and other sources of revenue. Also, I have posted the spreadsheets used for this article and Python code used to make the two graphs on my blog.
The average American worker retiring in December 2023 paid in more than $42,000 of Medicare (HI) payroll taxes toward the Medicare Part A from the time they first entered the workforce around 1978. If they had instead invested that $42,000 into a Standard & Poors 500 index fund as they earned those wages taxed, less a 0.10% management fee (SPYDER charges 0.09%), they would have accumulated a private fund they personally owned worth more than $447,000. This means they could safely pull out 7%, or more than $31,000 annually, from the fund to buy insurance.
These numbers raise the question: Why can Medicare Part A not be privatized? Average working people could pool their health care money privately and pay for more than four times as much health care as Medicare, and still die with more than $470,000 dollars in the bank. (Double that for two-income married couples!)
$447,000 buys a lot of hospital insurance, especially when invested at interest.
3 notes
·
View notes
Text
Mastering Data Structures: A Comprehensive Course for Beginners
Data structures are one of the foundational concepts in computer science and software development. Mastering data structures is essential for anyone looking to pursue a career in programming, software engineering, or computer science. This article will explore the importance of a Data Structure Course, what it covers, and how it can help you excel in coding challenges and interviews.
1. What Is a Data Structure Course?
A Data Structure Course teaches students about the various ways data can be organized, stored, and manipulated efficiently. These structures are crucial for solving complex problems and optimizing the performance of applications. The course generally covers theoretical concepts along with practical applications using programming languages like C++, Java, or Python.
By the end of the course, students will gain proficiency in selecting the right data structure for different problem types, improving their problem-solving abilities.
2. Why Take a Data Structure Course?
Learning data structures is vital for both beginners and experienced developers. Here are some key reasons to enroll in a Data Structure Course:
a) Essential for Coding Interviews
Companies like Google, Amazon, and Facebook focus heavily on data structures in their coding interviews. A solid understanding of data structures is essential to pass these interviews successfully. Employers assess your problem-solving skills, and your knowledge of data structures can set you apart from other candidates.
b) Improves Problem-Solving Skills
With the right data structure knowledge, you can solve real-world problems more efficiently. A well-designed data structure leads to faster algorithms, which is critical when handling large datasets or working on performance-sensitive applications.
c) Boosts Programming Competency
A good grasp of data structures makes coding more intuitive. Whether you are developing an app, building a website, or working on software tools, understanding how to work with different data structures will help you write clean and efficient code.
3. Key Topics Covered in a Data Structure Course
A Data Structure Course typically spans a range of topics designed to teach students how to use and implement different structures. Below are some key topics you will encounter:
a) Arrays and Linked Lists
Arrays are one of the most basic data structures. A Data Structure Course will teach you how to use arrays for storing and accessing data in contiguous memory locations. Linked lists, on the other hand, involve nodes that hold data and pointers to the next node. Students will learn the differences, advantages, and disadvantages of both structures.
b) Stacks and Queues
Stacks and queues are fundamental data structures used to store and retrieve data in a specific order. A Data Structure Course will cover the LIFO (Last In, First Out) principle for stacks and FIFO (First In, First Out) for queues, explaining their use in various algorithms and applications like web browsers and task scheduling.
c) Trees and Graphs
Trees and graphs are hierarchical structures used in organizing data. A Data Structure Course teaches how trees, such as binary trees, binary search trees (BST), and AVL trees, are used in organizing hierarchical data. Graphs are important for representing relationships between entities, such as in social networks, and are used in algorithms like Dijkstra's and BFS/DFS.
d) Hashing
Hashing is a technique used to convert a given key into an index in an array. A Data Structure Course will cover hash tables, hash maps, and collision resolution techniques, which are crucial for fast data retrieval and manipulation.
e) Sorting and Searching Algorithms
Sorting and searching are essential operations for working with data. A Data Structure Course provides a detailed study of algorithms like quicksort, merge sort, and binary search. Understanding these algorithms and how they interact with data structures can help you optimize solutions to various problems.
4. Practical Benefits of Enrolling in a Data Structure Course
a) Hands-on Experience
A Data Structure Course typically includes plenty of coding exercises, allowing students to implement data structures and algorithms from scratch. This hands-on experience is invaluable when applying concepts to real-world problems.
b) Critical Thinking and Efficiency
Data structures are all about optimizing efficiency. By learning the most effective ways to store and manipulate data, students improve their critical thinking skills, which are essential in programming. Selecting the right data structure for a problem can drastically reduce time and space complexity.
c) Better Understanding of Memory Management
Understanding how data is stored and accessed in memory is crucial for writing efficient code. A Data Structure Course will help you gain insights into memory management, pointers, and references, which are important concepts, especially in languages like C and C++.
5. Best Programming Languages for Data Structure Courses
While many programming languages can be used to teach data structures, some are particularly well-suited due to their memory management capabilities and ease of implementation. Some popular programming languages used in Data Structure Courses include:
C++: Offers low-level memory management and is perfect for teaching data structures.
Java: Widely used for teaching object-oriented principles and offers a rich set of libraries for implementing data structures.
Python: Known for its simplicity and ease of use, Python is great for beginners, though it may not offer the same level of control over memory as C++.
6. How to Choose the Right Data Structure Course?
Selecting the right Data Structure Course depends on several factors such as your learning goals, background, and preferred learning style. Consider the following when choosing:
a) Course Content and Curriculum
Make sure the course covers the topics you are interested in and aligns with your learning objectives. A comprehensive Data Structure Course should provide a balance between theory and practical coding exercises.
b) Instructor Expertise
Look for courses taught by experienced instructors who have a solid background in computer science and software development.
c) Course Reviews and Ratings
Reviews and ratings from other students can provide valuable insights into the course’s quality and how well it prepares you for real-world applications.
7. Conclusion: Unlock Your Coding Potential with a Data Structure Course
In conclusion, a Data Structure Course is an essential investment for anyone serious about pursuing a career in software development or computer science. It equips you with the tools and skills to optimize your code, solve problems more efficiently, and excel in technical interviews. Whether you're a beginner or looking to strengthen your existing knowledge, a well-structured course can help you unlock your full coding potential.
By mastering data structures, you are not only preparing for interviews but also becoming a better programmer who can tackle complex challenges with ease.
3 notes
·
View notes
Note
Heya! I had a few questions, if you're willing to answer, about game development. I know you've used Unity for some of your projects in the past (rest in peace), and you've mentioned learning to work with Godot and Unreal recently.
For someone with a background in programming and software dev, but not game dev, would you say that either one is easier to learn than the other? Going from nothing but text-based RPGs to a proper engine has been a bit intimidating (reminiscent of moving from MSPaint to Photoshop), and I was wondering if you had any input on which one was better to learn initially.
Thanks a ton if you take the time to answer, I love your art, and I hope that the act of creation continues to bring you a lot of happiness in the future
hey! i'm still pretty new to both, but I could offer some impressions. first off, I feel like unreal and godot are tailored for some pretty different experiences. unreal has a focus on 3d, and there's a lot of built in tools for work like that, but it's a very huge and complex engine, and the build of your game will probably be huge regardless simply due to the overhead. godot on the other hand is pretty lightweight and can easily build for many OSes, which I enjoy. unreal has a pretty heavy focus on using their "blueprint graphs", which I feel like was pretty easy to learn, but for someone like me who also has a background in programming, you might want to just get into code, unreal also allows that, you can write your scripts in C++, but honestly nothing I've done in it has required me to do that yet, so I don't have impressions on that front. as for godot, unfortunately i've encountered a lot of bugs and issues using it, but i do feel more comfortable in it having a background in programming. it allows both its built in "gdscript" and c#, I've only used gdscript in it so far because a lot of people recommended it. i feel like its built in code editor its pretty convenient, it live updates to show errors, has auto-completion, & built in documentation. as for what's easier to learn, i feel like they have pretty similar learning curves, I'm just behind on learning godot because I do that on my free time, and have been using unreal engine for my day job.
16 notes
·
View notes
Text

code art variation - gradient graphs
A gabriel graph is a special category of graph in graph theory where an edge can only be formed between two nodes if the circle formed by those two nodes contains no other nodes in the graph. A random geometric graph is a graph where an edge can only be formed between two nodes if they are less than a certain distance away from each other.
“Gradient Graphs” is an original generative code art algorithm; each run of the code produces a random visual output. The “Gradient Graphs” program generates random gabriel graphs and random geometric graphs, where each graph has a random number of nodes and each node has a random position and color. Nodes are connected by lines and circles that have a gradient from one point color to the other.
Users can interact with the program to remove the nodes, edge lines, or edge circles, choosing how they would like the graph to be displayed.
“Gradient Graphs” was made with JavaScript and p5.js.
This code and its output are licensed under the Creative Commons Attribution-NonCommercial-NoDerivatives 4.0 International (CC BY-NC-ND 4.0) License.
Copyright (C) 2022-2024 brittni and the polar bear LLC. Some rights reserved.
#code art#algorithmic art#generative art#genart#creative coding#digital art#black art#artists on tumblr#graph theory#gradient graphs#made with javascript
5 notes
·
View notes
Text
Biddy Math
When a Biddy nears death and eventually dies, Alder takes those years back. (There is no sign in 1x3, 1x10, 2x1, or 2x8 that this strain is redistributed to the other Biddies when one of their own is injured or dies. They only take on stress that is directly inflicted upon Alder.)
Therefore, the bare minimum requirement for the Biddy program is that if one Biddy dies, Alder will not die just by taking on those years. Assuming an equal sharing of Alder's life force (not necessarily a safe one to make, given that the Marshal's setup is so different), then this means that Alder doubles her physical years when a Biddy dies. Therefore, the number of biddies is defined by what is half of life expectancy, plus some number of buffer years so that Alder isn't on death's door just from losing one Biddy.
Delicious numbers, analysis, and graphs under the cut. Click through to see exactly which years Alder probably increased the number of Biddies over time! Now with bonus "how much is Alder drinking" potshots!
To decide some things, we can bypass life expectancy at younger ages, because those numbers are the product of mortality rates, which include causes of death other than old age. Because in the Biddy process, people proceed directly to old age, we can look at life expectancy for people who already survived to that old age.
x = Alder's total age n = Total number of people sharing life force (number of biddies plus 1 for Alder herself) Alder's physical age = A = x/n L = life expectancy (most probable age of death) s = safety buffer L-s = Age at which a person is expected to still live for another s years L-s = The age Alder will become if a Biddy dies = 2A = 2x/n
For Life Expectancy numbers, I looked at the Human Mortality Database. Here is the full citation:
HMD. Human Mortality Database. Max Planck Institute for Demographic Research (Germany), University of California, Berkeley (USA), and French Institute for Demographic Studies (France). Available at www.mortality.org. See also the methods protocol: Wilmoth, J. R., Andreev, K., Jdanov, D., Glei, D. A., Riffe, T., Boe, C., Bubenheim, M., Philipov, D., Shkolnikov, V., Vachon, P., Winant, C., & Barbieri, M. (2021). Methods protocol for the human mortality database (v6). Available online (needs log in to mortality.org).
For most all of the datasets I looked at, "Expected to live 5 more years" correlated to a ~10% mortality rate (that 1 in 10 people of that age died that year). So a 5 year safety buffer seems reasonable.
So, for example, I look at the US females dataset. I go to 2019 (the year the show started, and also to avoid the influence of the pandemic). In the dataset, the age at which they are expected to live 5 more years is 89. This is our (L-s) term. So, the physical age that Alder is safe to be at in 2019 is at most 89/2 = 44.5. (Lyne was 40 in 2019.)
If we assume that Alder was 18 years old when she signed the Salem Accords in 1692 (in order to codify conscription age to match hers), then in 2019 she is 345 years old. When we divide 345 by 44.5, to see how many total parties need to share those years equally, we get 7.625, which rounds up to 8. And well well well, that makes for Alder and 7 Biddies. Eliot did his math!
Something Eliot didn't quite do his math on, though, is his claim in After the Storm 1x3 that Biddies only tend to last 5-6 years. In 2019, Tally (somewhere between 18 and 19 years old) picking up 44.5 years upon getting Biddy'd means that she was physically…somewhere around 63 years old! In the US, 63 year ladies could expect to live another 23 years, to age 86! In order to get back down to the "less than 6 years to live as a Biddy" range, we would have to assume that the stress of military combat and also Alder's alcoholic liver would lop off another 17 years from their natural life expectancy. No I am not going to research how muchFine, let's find out how much Alder is drinking in order to destroy 20 year old candidates in 5-6 years.
Found an online calculator that cites this study:
Westman J, Wahlbeck K, Laursen TM, Gissler M, Nordentoft M, Hällgren J, Arffman M, Ösby U. Mortality and life expectancy of people with alcohol use disorder in Denmark, Finland and Sweden.; Acta Psychiatrica Scandinavica; April 2015
For a person to start drinking at age 63 and shorten their lifespan from 86 to 69 years, Alder is pounding at least 9 doses a day (but that would also only be enough to kill one Biddy! do we need to multiply that by seven...). Per NIAAA, a dose is 0.6 ounces of pure alcohol, which averages 5 ounces of wine and um only 1.5 ounces (a shot glass) or less of liquors like whiskey.

Alder famously ends up downing both of these glasses in this scene.

Sarah. Sarah. How many fucking doses is that, Sarah!? ("the height of two fingers against a regular sized glass is about 2 fl oz", so these glasses are probably "neat" pours, and she took 4 ounces in the Petra scene, and 2 ounces above. But we also know from Tally that "she loves her wine" and probably has it daily during at least breakfast with Anacostia, if not also at all other scheduled meals.)
...Okay, crack tangent over. Biddy candidate age speculation! Well, we started this whole thing with the assumption that when Alder takes back her years from a Biddy, she basically becomes Biddy age, with 5 years ahead of her (matching the expected years of service that Eliot quoted, eh). Which means that, really, Biddy candidates following that pattern should just be Alder's physical age? Whomst 44 year old Biddy candidates lmao. And even if we include that extra 10 year buffer for Alder's alcoholic liver combat stress, the standard Biddy candidate (looking forward to only 5-6 years of service) would just be whatever is 10 years younger than Alder's physical age. In 2019 that would be at most 34 years old, not anything near conscript age.
Here's another analysis angle, because why not: If we assume that Alder is actually frozen in time and only the Biddies are ageing for her, then 7 biddies are ageing 1.143 years for every year. So they need to actually have 6 years left in them to live 5 years of real time. With that conservative 5 year estimate, the Biddy that died in 1x3 (in 2019) became a Biddy around 2014.
Going back to our mortality tables, in 2014, the age at which a US woman would have 6 years left is 87. If we just lop those 10 years of stress, 77. The age at which they would have 16 years left is 71, which demonstrates how causes of death not of old age like alcoholism come into play a lot more the younger we look. Or there's also a survival bias at play. But it would be real awkward if someone had a genetic/health issue where they would naturally die in their late 60s/early 70s, so they keeled over right after getting Biddy'd. I'm sure the candidate screening process is mostly about avoiding that. Still, in 2014 less than 2% of 71 year olds died, so.
Working backwards to lop off the 44.5 years of Alder's life they're carrying, then the recruitment candidates for that Biddy could have been anywhere from 26-31 years old (with the 10 extra stress years). If we don't, then back to the 40-47 year old range. So yes, Anacostia could have maybe been a viable Biddy candidate, at least on age alone?
The way these are all probabilities means that the stars might align to maximize the longer lifespan of an individual against the age at which they were recruited. If they were playing it real safe and going younger, then a Biddy could serve for 10 years before succumbing to old age. See again how Tally could have had multiple decades ahead of her as a Biddy. That doesn't seem to be the norm, if Eliot is saying that 5-6 is the expectation, but maybe Biddy lifespan increased over the years as life expectancy for the elderly rose.
Here's where it gets…tricky. The Human Mortality Database is very fastidious with their data, and it turns out that most nations didn't keep/take very good records before 1950. The US data set doesn't begin until 1933, which means that I need to look elsewhere for the 200 years before that. The UK and Scotland are obvious choices, given the surname Alder. UK data begins in 1922 when they began merging the various realms of the Isles, which is why the Scotland data actually ends in 1930, when it got folded in. After that, it was mostly finding any European data at all that exists before the 1920s. I picked England+Wales and France, as both made it into the mid-1800s. And finally, the earliest dataset HMD has is Sweden, which somehow went back to 1751. As with the US dataset, I grabbed the oldest age for every year at which the remaining life expectancy was at least 5 years.

This is where I ran into some issues. You can see in the graph above that the Scotland, England, and Sweden data all show a rise in the life expectancy 60 years before the US, France, and the UK do. This is likely due to sampling bias in the older data, but I still have to decide what to do for this analysis. From the graph, you can see that I just averaged the England and France data to split the difference, and it looks like a plausible trend to the US data. Besides, the amplitude of the difference is only a 5-10 year spread, which gets divided out to a couple of years difference per Biddy, which is then well within natural spreads of lifespan. When I perform the calculations to get Alder's physical age from these estimations, it remains quite stable between the 40-45 range.
At any rate, I strongly suspect that Eliot may have looked at the same datasets as I did, because the earliest data point is, as said before, Sweden in 1751. In 1751, Alder would be 77 years old. And what is the life expectancy with a 5 year buffer for 1751? 77.
It's hard to imagine that Alder would have let herself become 77 years old as an active combatant, particularly as we know she looked like her 40-something self crossing the Delaware and when she created the Mycelium after pushing the British back, which according to 1x8, took place around 1735, when she would have been 61. If she had just one Biddy that year, with an even life force split she would have been physically 30.5.
If we go back to that Sweden dataset, the calculated death age for people between 18 and 40 is fairly stable between 60-65 until the 1800s, is that way in France until the late 1800s, and those numbers are likely a lot lower in a much less established region like the Americas. Alder herself would have seen that in the people around her, so it would make sense for her to take on the Biddy program fairly in advance of that. I wouldn't be surprised if she set up contingencies in her 40s, in her 50s at the latest.
(An alternative theory, given the wonkiness of some lore claiming that the Biddy working was shared in exchanged for the Cession in the 1830s when Alder was already over 130 years old, is that Alder used other means to prolong her life before getting Biddies, such as whatever made her be linked to Fort Salem's fauna and flora, not to mention the fact that when she lost all of her Biddies she turned to wood, not dust. Those seem to be separate workings from the Biddy program, and given that alder trees typically live between 60 to 80 years, some reaching 100 years, then the need to switch over to Biddies around then makes sense.)
But finally, what you're all actually here for: a graph of Alder's physical age and when she would have to increase the number of Biddies over time, as influenced by changing elderly life expectancy over time. (Note that if she indeed did not get Biddies until the 1830s, then she went from zero to 4 Biddies at once.)

7 notes
·
View notes
Text
Why Tableau is Essential in Data Science: Transforming Raw Data into Insights

Data science is all about turning raw data into valuable insights. But numbers and statistics alone don’t tell the full story—they need to be visualized to make sense. That’s where Tableau comes in.
Tableau is a powerful tool that helps data scientists, analysts, and businesses see and understand data better. It simplifies complex datasets, making them interactive and easy to interpret. But with so many tools available, why is Tableau a must-have for data science? Let’s explore.
1. The Importance of Data Visualization in Data Science
Imagine you’re working with millions of data points from customer purchases, social media interactions, or financial transactions. Analyzing raw numbers manually would be overwhelming.
That’s why visualization is crucial in data science:
Identifies trends and patterns – Instead of sifting through spreadsheets, you can quickly spot trends in a visual format.
Makes complex data understandable – Graphs, heatmaps, and dashboards simplify the interpretation of large datasets.
Enhances decision-making – Stakeholders can easily grasp insights and make data-driven decisions faster.
Saves time and effort – Instead of writing lengthy reports, an interactive dashboard tells the story in seconds.
Without tools like Tableau, data science would be limited to experts who can code and run statistical models. With Tableau, insights become accessible to everyone—from data scientists to business executives.
2. Why Tableau Stands Out in Data Science
A. User-Friendly and Requires No Coding
One of the biggest advantages of Tableau is its drag-and-drop interface. Unlike Python or R, which require programming skills, Tableau allows users to create visualizations without writing a single line of code.
Even if you’re a beginner, you can:
✅ Upload data from multiple sources
✅ Create interactive dashboards in minutes
✅ Share insights with teams easily
This no-code approach makes Tableau ideal for both technical and non-technical professionals in data science.
B. Handles Large Datasets Efficiently
Data scientists often work with massive datasets—whether it’s financial transactions, customer behavior, or healthcare records. Traditional tools like Excel struggle with large volumes of data.
Tableau, on the other hand:
Can process millions of rows without slowing down
Optimizes performance using advanced data engine technology
Supports real-time data streaming for up-to-date analysis
This makes it a go-to tool for businesses that need fast, data-driven insights.
C. Connects with Multiple Data Sources
A major challenge in data science is bringing together data from different platforms. Tableau seamlessly integrates with a variety of sources, including:
Databases: MySQL, PostgreSQL, Microsoft SQL Server
Cloud platforms: AWS, Google BigQuery, Snowflake
Spreadsheets and APIs: Excel, Google Sheets, web-based data sources
This flexibility allows data scientists to combine datasets from multiple sources without needing complex SQL queries or scripts.
D. Real-Time Data Analysis
Industries like finance, healthcare, and e-commerce rely on real-time data to make quick decisions. Tableau’s live data connection allows users to:
Track stock market trends as they happen
Monitor website traffic and customer interactions in real time
Detect fraudulent transactions instantly
Instead of waiting for reports to be generated manually, Tableau delivers insights as events unfold.
E. Advanced Analytics Without Complexity
While Tableau is known for its visualizations, it also supports advanced analytics. You can:
Forecast trends based on historical data
Perform clustering and segmentation to identify patterns
Integrate with Python and R for machine learning and predictive modeling
This means data scientists can combine deep analytics with intuitive visualization, making Tableau a versatile tool.
3. How Tableau Helps Data Scientists in Real Life
Tableau has been adopted by the majority of industries to make data science more impactful and accessible. This is applied in the following real-life scenarios:
A. Analytics for Health Care
Tableau is deployed by hospitals and research institutions for the following purposes:
Monitor patient recovery rates and predict outbreaks of diseases
Analyze hospital occupancy and resource allocation
Identify trends in patient demographics and treatment results
B. Finance and Banking
Banks and investment firms rely on Tableau for the following purposes:
✅ Detect fraud by analyzing transaction patterns
✅ Track stock market fluctuations and make informed investment decisions
✅ Assess credit risk and loan performance
C. Marketing and Customer Insights
Companies use Tableau to:
✅ Track customer buying behavior and personalize recommendations
✅ Analyze social media engagement and campaign effectiveness
✅ Optimize ad spend by identifying high-performing channels
D. Retail and Supply Chain Management
Retailers leverage Tableau to:
✅ Forecast product demand and adjust inventory levels
✅ Identify regional sales trends and adjust marketing strategies
✅ Optimize supply chain logistics and reduce delivery delays
These applications show why Tableau is a must-have for data-driven decision-making.
4. Tableau vs. Other Data Visualization Tools
There are many visualization tools available, but Tableau consistently ranks as one of the best. Here’s why:
Tableau vs. Excel – Excel struggles with big data and lacks interactivity; Tableau handles large datasets effortlessly.
Tableau vs. Power BI – Power BI is great for Microsoft users, but Tableau offers more flexibility across different data sources.
Tableau vs. Python (Matplotlib, Seaborn) – Python libraries require coding skills, while Tableau simplifies visualization for all users.
This makes Tableau the go-to tool for both beginners and experienced professionals in data science.
5. Conclusion
Tableau has become an essential tool in data science because it simplifies data visualization, handles large datasets, and integrates seamlessly with various data sources. It enables professionals to analyze, interpret, and present data interactively, making insights accessible to everyone—from data scientists to business leaders.
If you’re looking to build a strong foundation in data science, learning Tableau is a smart career move. Many data science courses now include Tableau as a key skill, as companies increasingly demand professionals who can transform raw data into meaningful insights.
In a world where data is the driving force behind decision-making, Tableau ensures that the insights you uncover are not just accurate—but also clear, impactful, and easy to act upon.
#data science course#top data science course online#top data science institute online#artificial intelligence course#deepseek#tableau
3 notes
·
View notes
Text
Intel VTune Profiler For Data Parallel Python Applications

Intel VTune Profiler tutorial
This brief tutorial will show you how to use Intel VTune Profiler to profile the performance of a Python application using the NumPy and Numba example applications.
Analysing Performance in Applications and Systems
For HPC, cloud, IoT, media, storage, and other applications, Intel VTune Profiler optimises system performance, application performance, and system configuration.
Optimise the performance of the entire application not just the accelerated part using the CPU, GPU, and FPGA.
Profile SYCL, C, C++, C#, Fortran, OpenCL code, Python, Google Go, Java,.NET, Assembly, or any combination of languages can be multilingual.
Application or System: Obtain detailed results mapped to source code or coarse-grained system data for a longer time period.
Power: Maximise efficiency without resorting to thermal or power-related throttling.
VTune platform profiler
It has following Features.
Optimisation of Algorithms
Find your code’s “hot spots,” or the sections that take the longest.
Use Flame Graph to see hot code routes and the amount of time spent in each function and with its callees.
Bottlenecks in Microarchitecture and Memory
Use microarchitecture exploration analysis to pinpoint the major hardware problems affecting your application’s performance.
Identify memory-access-related concerns, such as cache misses and difficulty with high bandwidth.
Inductors and XPUs
Improve data transfers and GPU offload schema for SYCL, OpenCL, Microsoft DirectX, or OpenMP offload code. Determine which GPU kernels take the longest to optimise further.
Examine GPU-bound programs for inefficient kernel algorithms or microarchitectural restrictions that may be causing performance problems.
Examine FPGA utilisation and the interactions between CPU and FPGA.
Technical summary: Determine the most time-consuming operations that are executing on the neural processing unit (NPU) and learn how much data is exchanged between the NPU and DDR memory.
In parallelism
Check the threading efficiency of the code. Determine which threading problems are affecting performance.
Examine compute-intensive or throughput HPC programs to determine how well they utilise memory, vectorisation, and the CPU.
Interface and Platform
Find the points in I/O-intensive applications where performance is stalled. Examine the hardware’s ability to handle I/O traffic produced by integrated accelerators or external PCIe devices.
Use System Overview to get a detailed overview of short-term workloads.
Multiple Nodes
Describe the performance characteristics of workloads involving OpenMP and large-scale message passing interfaces (MPI).
Determine any scalability problems and receive suggestions for a thorough investigation.
Intel VTune Profiler
To improve Python performance while using Intel systems, install and utilise the Intel Distribution for Python and Data Parallel Extensions for Python with your applications.
Configure your Python-using VTune Profiler setup.
To find performance issues and areas for improvement, profile three distinct Python application implementations. The pairwise distance calculation algorithm commonly used in machine learning and data analytics will be demonstrated in this article using the NumPy example.
The following packages are used by the three distinct implementations.
Numpy Optimised for Intel
NumPy’s Data Parallel Extension
Extensions for Numba on GPU with Data Parallelism
Python’s NumPy and Data Parallel Extension
By providing optimised heterogeneous computing, Intel Distribution for Python and Intel Data Parallel Extension for Python offer a fantastic and straightforward approach to develop high-performance machine learning (ML) and scientific applications.
Added to the Python Intel Distribution is:
Scalability on PCs, powerful servers, and laptops utilising every CPU core available.
Assistance with the most recent Intel CPU instruction sets.
Accelerating core numerical and machine learning packages with libraries such as the Intel oneAPI Math Kernel Library (oneMKL) and Intel oneAPI Data Analytics Library (oneDAL) allows for near-native performance.
Tools for optimising Python code into instructions with more productivity.
Important Python bindings to help your Python project integrate Intel native tools more easily.
Three core packages make up the Data Parallel Extensions for Python:
The NumPy Data Parallel Extensions (dpnp)
Data Parallel Extensions for Numba, aka numba_dpex
Tensor data structure support, device selection, data allocation on devices, and user-defined data parallel extensions for Python are all provided by the dpctl (Data Parallel Control library).
It is best to obtain insights with comprehensive source code level analysis into compute and memory bottlenecks in order to promptly identify and resolve unanticipated performance difficulties in Machine Learning (ML), Artificial Intelligence ( AI), and other scientific workloads. This may be done with Python-based ML and AI programs as well as C/C++ code using Intel VTune Profiler. The methods for profiling these kinds of Python apps are the main topic of this paper.
Using highly optimised Intel Optimised Numpy and Data Parallel Extension for Python libraries, developers can replace the source lines causing performance loss with the help of Intel VTune Profiler, a sophisticated tool.
Setting up and Installing
1. Install Intel Distribution for Python
2. Create a Python Virtual Environment
python -m venv pyenv
pyenv\Scripts\activate
3. Install Python packages
pip install numpy
pip install dpnp
pip install numba
pip install numba-dpex
pip install pyitt
Make Use of Reference Configuration
The hardware and software components used for the reference example code we use are:
Software Components:
dpnp 0.14.0+189.gfcddad2474
mkl-fft 1.3.8
mkl-random 1.2.4
mkl-service 2.4.0
mkl-umath 0.1.1
numba 0.59.0
numba-dpex 0.21.4
numpy 1.26.4
pyitt 1.1.0
Operating System:
Linux, Ubuntu 22.04.3 LTS
CPU:
Intel Xeon Platinum 8480+
GPU:
Intel Data Center GPU Max 1550
The Example Application for NumPy
Intel will demonstrate how to use Intel VTune Profiler and its Intel Instrumentation and Tracing Technology (ITT) API to optimise a NumPy application step-by-step. The pairwise distance application, a well-liked approach in fields including biology, high performance computing (HPC), machine learning, and geographic data analytics, will be used in this article.
Summary
The three stages of optimisation that we will discuss in this post are summarised as follows:
Step 1: Examining the Intel Optimised Numpy Pairwise Distance Implementation: Here, we’ll attempt to comprehend the obstacles affecting the NumPy implementation’s performance.
Step 2: Profiling Data Parallel Extension for Pairwise Distance NumPy Implementation: We intend to examine the implementation and see whether there is a performance disparity.
Step 3: Profiling Data Parallel Extension for Pairwise Distance Implementation on Numba GPU: Analysing the numba-dpex implementation’s GPU performance
Boost Your Python NumPy Application
Intel has shown how to quickly discover compute and memory bottlenecks in a Python application using Intel VTune Profiler.
Intel VTune Profiler aids in identifying bottlenecks’ root causes and strategies for enhancing application performance.
It can assist in mapping the main bottleneck jobs to the source code/assembly level and displaying the related CPU/GPU time.
Even more comprehensive, developer-friendly profiling results can be obtained by using the Instrumentation and Tracing API (ITT APIs).
Read more on govindhtech.com
#Intel#IntelVTuneProfiler#Python#CPU#GPU#FPGA#Intelsystems#machinelearning#oneMKL#news#technews#technology#technologynews#technologytrends#govindhtech
2 notes
·
View notes