#candlesticks patterns
Explore tagged Tumblr posts
Visit Tumblr Blog
Explore Tumblr blogs with no restrictions, modern design and the best experience.
Last Seen Tumblr Blogs


Fun Fact
Tumblr Inc. is funded by 13 investors.
Text
Ghidul complet pentru înțelegerea formațiunilor de lumânări japoneze în trading
Așa cum am promis episodul trecut videoclipul de azi va fi despre formațiunile de lumânări japoneze.Rămâneți până la finalul videoclipului pentru că arăt exemple de formațiuni de lumânări și explic interpretarea graficelor în funcție de ele.
youtube
View On WordPress
#Acțiuni#administrare capital#brokeri#candlesticks patterns#clasele de active#Cătălin D. Iamandi#Cătălin Daniel Iamandi#dezvoltare personala#dividende#domeniu financiar#educatie financiara#ETF#Financial Education#Financial Success#finante personale#Fonduri mutuale#formațiuni de lumânări#independență financiară#investiții#investiții în acțiuni#investiții în ETF#Investing#investitor#motivatie#R-type Evolution#risc-randament#România#română#subtirare#surse suplimentare venit
1 note
·
View note
Text


Spoonflower shop update! These designs are newly available to buy, as are a bunch of others, plus some new colour & scale variations... Take a look? spoonflower.com/profiles/rowanclair
#illustration#surface pattern design#victorian wallpaper#rose#candlesticks#chess#dragonfruit#snails#bees
49 notes
·
View notes
Text
Bullish Marubozu: An Important Signal for Uptrend
Among candlestick patterns in market analysis, the Bullish Marubozu candlestick is a bullish indicator that is simple to understand and very effective. Unlike other candlesticks, which may show shadows or wicks, the Bullish Marubozu is unique in its simplicity��it has no shadows.
What Is the Bullish Marubozu?
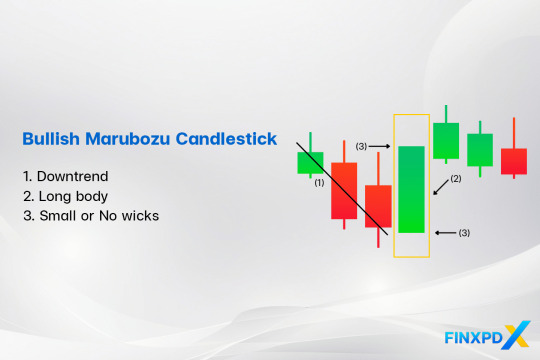
The Bullish Marubozu candlestick is a bullish candlestick pattern that shows strong buying pressure throughout the trading session. It has a long white or green body with no shadows or wicks, meaning the price opened at its lowest and closed at its highest point.
The name “White Marubozu” is another name for a Bullish Marubozu candlestick that combines its appearance and Japanese origins. “White” refers to the bullish candle color, and “Marubozu,” meaning “bald” in Japanese, describes its lack of wicks.
Characteristics of the Bullish Marubozu Candlestick
Bullish Marubozu: Features a long, solid green body with little to no wicks.
Full Bullish Marubozu: No wicks at all, showing the strongest bullish control throughout the session.
Open Bullish Marubozu: No lower wick but a small upper wick, indicating a strong upward move with slight selling pressure at the end.
Close Bullish Marubozu: A small lower wick but no upper wick, reflecting strong buying with a slightly higher open.
Read more: FinxpdX
Download PDF: 35 Powerful Candlestick Patterns
#investing#finance#investment#financial#stocks#forex#forextrading#forex market#candlestick#candlestick patterns#Marubozu#bullish#forex indicators
4 notes
·
View notes
Text
The Japanese Candlestick Charting Technique
The Japanese candlestick charting technique second edition book was written by Steve Nison. He wrote the book to understand the candlestick patterns and analyze the market.
Steve Nison structures the book from basics to advanced strategies
This Second Edition book contains:
More about intraday markets
More focus on active trading for swing, and day traders
New tactics for getting maximum use from intraday charts
New Western techniques in combination with candles
A greater focus on capital preservation.
4 notes
·
View notes
Text
Candlestick Charting: A Tale of Tradition and Innovation from Japan
Candlestick charting's rich origins in Japan reveal timeless insights into market sentiment. Embrace the past's wisdom as we navigate today's markets, confident that understanding emotions will illuminate brighter trading paths! 🚀📈 #FinancialWisdom
Candlestick charting, a vital tool for traders globally, originated in 18th-century Japan amid a feudal society and a thriving rice market. Developed by legendary trader Munehisa Homma, it visualised price movements using candlesticks, revealing market psychology and predicting trends. Steve Nison’s introduction of candlestick charting to the West in the 1980s revolutionised technical analysis.…

View On WordPress
#Bullish and Bearish Patterns#Candlestick Patterns#Feudal Japan#Financial Education#Japan#Market Psychology#Modern Trading#Price Action#Risk management#Technical Analysis
4 notes
·
View notes
Text
Types of Candlestick Patterns Explained Simply

Types of Candlestick Patterns: A Beginner-Friendly Guide
Have you ever looked at a stock chart and felt like it was speaking a foreign language? Those little red and green bars—known as candlesticks—aren’t just random shapes. They tell stories. Stories of fear, greed, hesitation, and opportunity. If you've ever wished to understand those stories, you're in the right place.
In this article, we’re going to explore the types of candlestick patterns in a way that’s easy to grasp, even if you're brand new to trading. Think of candlestick patterns like emojis—small symbols packed with emotional context. Just as means happiness, a Hammer candlestick might signal a bullish reversal.
Explore types of candlestick patterns in simple terms. A complete guide to all types of candlestick patterns for beginners and curious traders.
Introduction to Candlestick Patterns
Candlestick patterns are visual tools used in stock trading to predict potential price movements. Each candlestick shows four key details: the opening price, closing price, highest price, and lowest price for a specific time frame.
These patterns originated in 18th-century Japan—yes, that far back!—when rice traders used them to predict future prices.
Why Candlestick Patterns Matter
Understanding candlestick patterns is like learning to read body language. While price tells you what happened, candlesticks hint at why. Are traders getting scared? Is there confidence building up? Candlestick patterns provide these answers through easy-to-spot formations.
Single Candlestick Patterns
Let’s begin with the simplest types. These involve only one candlestick and are often the first step for beginners.
The Hammer & Hanging Man
These two look nearly identical but mean very different things.
Hammer: Appears at the bottom of a downtrend. Think of it as the market “hammering out” a bottom. It has a small body and a long lower shadow.
Hanging Man: Shows up after an uptrend. Same shape as the hammer but signals a potential drop in price.
Tip: The color of the body isn’t as important as the position and size of the shadow.
Doji – The Market's Pause Button
The Doji is like a moment of hesitation. The opening and closing prices are nearly the same, forming a tiny body.
Types of Doji:
Neutral Doji: Price goes up and down, but ends unchanged.
Long-legged Doji: Large wicks on both sides, signaling major indecision.
Gravestone Doji: Looks like an upside-down “T” and suggests bearish pressure.
Dragonfly Doji: Resembles a “T” and may signal bullish strength.
Spinning Top – Indecision Alert
A Spinning Top has a small body and long upper and lower shadows. It signals that buyers and sellers fought hard but neither won.
It usually shows up during a trend and indicates a possible reversal or slowdown.
Marubozu – Full of Confidence
This candlestick has no shadows—just a solid body.
Bullish Marubozu: Opens at the low and closes at the high. Total buyer control.
Bearish Marubozu: Opens at the high and closes at the low. Total seller control.
Think of it like someone shouting, “I’m all in!” without hesitation.
Engulfing Patterns – Power Shifts
These are two-candlestick patterns that reflect changing momentum.
Bullish Engulfing: A small red candle followed by a large green one that "engulfs" it. Suggests a reversal to the upside.
Bearish Engulfing: Opposite of the above, often indicating a drop ahead.
Morning Star & Evening Star
These are three-candle patterns that often signal major turning points.
Morning Star: Appears after a downtrend. A long red candle, then a small one (any color), followed by a strong green candle. Signals a bullish reversal.
Evening Star: The bearish cousin. Appears after an uptrend.
Three White Soldiers & Three Black Crows
These are sequences of three strong candles.
Three White Soldiers: Three long green candles in a row. Very bullish.
Three Black Crows: Three long red candles. Very bearish.
These patterns indicate strong sentiment, either positive or negative.
Harami – Inside Moves
The Harami pattern looks like a small candle hiding inside a larger one.
Bullish Harami: Small green candle inside a large red one. Signals a possible reversal upward.
Bearish Harami: Small red inside a green. Signals a potential downturn.
Piercing Line & Dark Cloud Cover
These two-candle patterns are also all about reversal signals.
Piercing Line: A red candle followed by a green one that opens lower but closes past the midpoint of the previous red. Bullish sign.
Dark Cloud Cover: The opposite. Bearish sentiment taking over.
Tweezer Tops and Bottoms
Tweezer Top: Two or more candles with identical highs. Suggests price resistance and a possible drop.
Tweezer Bottom: Identical lows over two or more candles. Suggests price support and possible rise.
Think of tweezers picking the top or bottom out of a price trend.
How to Read Candlestick Patterns Together
One candle alone doesn't tell the full story. It's like reading just one sentence of a novel. To truly understand the plot, you need context. Combine patterns with:
Volume
Trend direction
Support and resistance levels
Tips for Using Candlestick Patterns Effectively
Don’t trade patterns in isolation. Always confirm with other indicators.
Practice makes perfect. Use demo accounts to test your pattern-reading skills.
Stay patient. Candlestick patterns are signals, not guarantees.
Conclusion
Candlestick patterns are like the facial expressions of the stock market. They give you hints, nudges, and sometimes loud warnings about what might happen next. Whether you’re just curious or planning to dive deeper into trading, understanding these patterns will help you navigate the charts with confidence.
Remember, while this article covers all types of candlestick patterns, experience and context make all the difference in using them effectively.
FAQs
What are candlestick patterns in simple terms? Candlestick patterns are visual tools on price charts that show how a stock's price moves during a certain period, helping predict future movements.
How many types of candlestick patterns are there? There are over 30 commonly used candlestick patterns, including single, double, and triple candlestick formations.
Are candlestick patterns reliable for trading? They can be helpful indicators but should always be used with other tools like volume and trend analysis for accuracy.
What is the most bullish candlestick pattern? The “Morning Star” and “Three White Soldiers” are among the most bullish, often indicating a strong reversal to the upside.
Can I use candlestick patterns in all markets? Yes! These patterns work in stocks, forex, commodities, and crypto markets, thanks to their universal price action behavior.
#types of candlestick patterns#all types of candlestick patterns#types of candlesticks#types of candlesticks and their meaning
0 notes
Text
Top 8 Must-Know Chart Patterns in Technical Analysis | NTA®
Discover the 8 essential chart patterns every trader should master. Enhance your trading strategy with insights into market trends and price action analysis.
0 notes
Text
Best Forex Signal Providers of 2025
Are you a rookie trader unfamiliar with currency market characteristics and unable to identify opportunities? If so, we can help. Forex signals can identify timely chances. This site discusses the top forex signal providers worldwide and thei qualities. It will help you choose the perfect one for your needs.
Read Full Blog - Click Here
8 Best Forex Signal Providers of 2025
Different sites claim to be top forex signal providers. When choosing a signal service, traders must be vigilant.
Numerous telegrams and social media groups offer free forex signals. These platforms may be unreliable and have negative effects. Fear not. This list of good forex signal providers aims to help you. Check it out.
1. ForexSignals.com 2. Autochartist 3. 1000 pip Builder 4. MQL5 5. eToro 6. Learn2 Trade 7. Carlos and Company 8. IG Trading Signals
0 notes
Text
#What is Pinbar Candlestick Pattern#How to Trade Using Pinbar Candlestick Pattern#Pros and Cons of Pinbar Candlestick Pattern
0 notes
Text
youtube
⚡ Comprendre tous les patterns de bougies japonaises en 5 minutes Vous voulez lire les marchés comme un pro ? Apprenez à interpréter les bougies japonaises, un outil essentiel en analyse technique.
📌 Dans cette vidéo, vous apprendrez : ✅ Comment intuitivement cmprendre les patterns de retournement et de continuation les plus connus ✅ Comment les repérer facilement sur vos graphiques sans les connaître ✅ Comment utiliser les time frames pour améliorer vos entrées
Une formation express pour mieux trader, dès aujourd’hui !
#stock market#indicateurs trading#bougies japonaises#signaux trading#day trading#swing trading#crypto trading#tendance haussière#tendance baissière#astuces trading#price action trading#stratégie de trading#trading efficace#retournement bourse#price action#méthode trading visuelle#chandeliers japonais#patterns trading#analyse technique#apprendre trading#signaux de bougies#bougies japonaises trading#bougie engulfing#hammer#candlestick patterns#Youtube
1 note
·
View note
Text
youtube
Ultimate Candlestick Patterns Trading Course
#Candlestick#Candlestick Patterns#trade#daytrader#daytrading#technical analysis#money#anti capitalism#capitalism#wall street#wall#wall street journal#investment#stocks#stock market#penny#Stereophile#penny stocks#investor#lamborghini#millionaire lifestyle#millionaire#billionaire#greed#luxury#rich#poor#learn#Youtube
0 notes
Text
Unlocking the Power of TradingView: The Best Charting Platform for Traders
A sleek and modern TradingView dashboard displaying real-time charts, candlestick patterns, and powerful technical indicators like RSI and MACD. Are you looking for a powerful, easy-to-use charting tool to enhance your trading? Whether you’re a beginner or an experienced trader, TradingView is one of the best platforms for technical analysis, market insights, and strategy building. And here’s…
#Affiliate Marketing#Automated trading#Candlestick patterns#Crypto trading#Day trading#Forex trading#Investing#MACD#Market analysis#Online trading#passive income#RSI#Stock market#Swing trading#Technical analysis#Trading alerts#Trading bots#Trading platform#Trading signals#Trading strategies#Trading tools#TradingView#TradingView charts#TradingView indicators#TradingView plans#TradingView pricing#TradingView review
0 notes
Text
Candlestick Patterns
Master candlestick patterns with FuturesElite to improve your trading strategies. Learn to identify key signals for better market analysis and decision-making. Enhance your trading skills and maximize profits with expert insights today!
0 notes
Text
How Many Candlestick Patterns Are There

How Many Candlestick Patterns Are There? A Friendly Guide to Understanding the Basics
Understanding the world of trading can feel like learning a new language. And if you’ve ever seen a candlestick chart, you might’ve wondered, “What am I even looking at?” Don’t worry—you're not alone! Whether you're someone just getting into trading or simply curious about how it all works, this article will walk you through the mysterious world of candlestick patterns. We’ll break it down in a way that makes sense, no financial dictionary required.
Imagine candlestick patterns like traffic signals on the road of trading—they give hints about what might happen next. Some say, “Hey, the market might go up!” Others hint, “Watch out, things could go south.” So, how many candlestick patterns are there? Great question—let’s find out.
Learn how many candlestick patterns are there, different types of candlestick patterns, and what is candlestick patterns in simple language for beginners.
Introduction to Candlestick Patterns
Let’s start at the beginning. If you’ve ever seen a stock or cryptocurrency chart, you’ve probably noticed those little red and green rectangles—they're called candlesticks. They're not just colorful bars; they tell a story about price movement.
What is Candlestick Patterns?
Candlestick patterns are specific formations of these candles on a chart. Think of them as facial expressions of the market. Just like a smile can tell you someone’s happy, a certain pattern in candles can suggest whether the market is feeling bullish (going up) or bearish (going down).
Each candlestick gives four main pieces of information:
Open Price
Close Price
High Price
Low Price
Why Are Candlestick Patterns Important?
Imagine driving with your eyes closed. Sounds scary, right? That’s what trading without understanding patterns is like. Candlestick patterns act like headlights—they help traders see where the road might lead. While they don't guarantee success, they give valuable clues that many traders use to make decisions.
How Many Candlestick Patterns Are There?
Here’s the big question: how many candlestick patterns are there? Well, in total, there are more than 50 recognized patterns, but most traders focus on about 30 key ones. These patterns are grouped into:
Single Candlestick Patterns
Double Candlestick Patterns
Triple Candlestick Patterns
Each category offers insight into different possible future movements of the market.
Types of Candlestick Patterns
To make things easier, let’s break them down:
Single Candlestick Patterns
These involve just one candlestick. They're quick and simple.
Double Candlestick Patterns
These involve two candles and often signal a trend reversal.
Triple Candlestick Patterns
These use three candles to tell a more complete story about what the market might do next.
Let’s dig deeper into each one.
Single Candlestick Patterns
These are the building blocks of chart reading. They’re easy to spot and understand.
Doji
A Doji looks like a cross. It happens when the open and close prices are almost the same. It shows market indecision—like the market saying, “I’m not sure which way to go.”
Hammer
A Hammer looks like—you guessed it—a hammer! It has a small body with a long lower wick. It usually shows up at the bottom of a downtrend, signaling a potential reversal upward.
Inverted Hammer
Similar to the Hammer, but flipped upside down. It also signals a possible trend reversal, but needs confirmation from the next candles.
Double Candlestick Patterns
These patterns give a stronger message since they involve two candles working together.
Bullish Engulfing
This happens when a small red candle is followed by a big green candle that completely “engulfs” it. It signals a potential move upward.
Bearish Engulfing
The opposite of bullish. A small green candle is followed by a larger red one. This can signal a downward move ahead.
Tweezer Tops and Bottoms
These are two candles with matching highs (tops) or lows (bottoms). They can suggest that a trend is losing strength.
Triple Candlestick Patterns
When three candles join forces, the pattern becomes even stronger and more reliable.
Morning Star
This is a bullish reversal pattern made of three candles: a bearish candle, a small-bodied candle (which can be a Doji), and a bullish candle. It's like a sunrise—things are looking up!
Evening Star
The opposite of Morning Star. It begins with a bullish candle, followed by a small one, and ends with a bearish candle. It's a sign the sun is setting on an uptrend.
Three White Soldiers
This pattern consists of three strong green candles in a row. It’s a very bullish sign, showing continued buying pressure.
Three Black Crows
You guessed it—this one's bearish. It’s made of three long red candles in a row, suggesting strong selling pressure.
Common Mistakes When Reading Patterns
Let’s face it, we all mess up sometimes. Here are some pitfalls to avoid:
Relying on patterns alone: Always use other tools too.
Ignoring the bigger trend: A bullish pattern in a strong downtrend may not hold up.
Overtrading: Just because you see a pattern doesn’t mean you must act on it.
Tips for Learning Candlestick Patterns
Learning candlestick patterns is like learning to read emotions. Start small:
Practice with paper trading.
Use flashcards to memorize patterns.
Review historical charts to see how patterns played out.
Keep a trading journal to track your learning.
Conclusion
So, how many candlestick patterns are there? There are over 50—but don’t panic! You really only need to master about 30 core patterns to start making smarter decisions. Whether you’re an aspiring trader or just a curious learner, understanding these patterns is like having a window into the market’s soul.
Remember, candlestick patterns are tools—not magic tricks. Use them wisely, and always double-check with other indicators and research.
FAQs
How many candlestick patterns are there?
There are over 50 recognized candlestick patterns, but traders mostly use 30 key ones regularly.
What is candlestick patterns in simple terms?
They are visual representations of price movements in a chart. Each pattern gives clues about where the market might go next.
Are candlestick patterns accurate?
They can be helpful, but no pattern is 100% accurate. They're best used with other tools and indicators.
Can beginners learn candlestick patterns easily?
Absolutely! With practice, even beginners can understand and use them to make better trading choices.
What's the difference between bullish and bearish patterns?
Bullish patterns suggest prices may rise, while bearish patterns indicate a possible decline in prices.
#how many candlestick patterns are there#what is candlestick patterns#how to read candlestick pattern#types of candlestick patterns
1 note
·
View note
Text
Bear Trap to Identify a Before It’s Too Late
Finance can be unpredictable and deceptive. Such situations make market prediction difficult even for the finest analysts.
Some of the most prevalent market tricks are bear traps. Such traps cause even experienced traders to make mistakes.
Without the correct understanding, bear traps are challenging. Thus, this essay will explain bear traps and how to avoid them. READ FULL BLOG - ClICK HERE
What is a Bear Trap?
A bear trap occurs when an asset's price breaches support. Sell positions are opened by traders expecting more decrease. Prices decrease instead of growing, and traders' decisions are erroneous. Forex, stock, indices, cryptocurrency, and equity markets often have bear traps. Both inexperienced and professional traders fell for these market traps.
How Bear Traps Work
When an asset price breaches support, sellers are in control, according to technical analysis. Prices will fall more if they breakthrough downward. Traders often sell now. Since signs favor negative movements, it's fine. Financial markets deceive traders that way. Probabilities drive technical analysis. A price drop is likely, but not certain. If market conditions change suddenly, prices may climb, catching investors in bear traps.
What Causes Bear Traps
Highly Volatile Market
Oversold Conditions
Less Liquidity
Change in Sentiments
Major Market Players' Activities
How to Avoid Bear Traps
Don’t trade on every breakout
Watch broader market aspects
Use technical Analysis Indicators
Consider Hedging
Always use Stop Loss

End
Traders of financial assets frequently fall victim to market traps. It may negatively impact your overall mentality, strategy, risk, and profit. Even with the greatest tactics, it can be challenging to spot bear traps. You can, however, take the appropriate safety measures to refrain from trading in such market conditions. Create a thorough plan, arrange a thorough market analysis, and practice sound risk management. A solid understanding might also help you avoid these pitfalls. Incorporate ongoing education to ensure a seamless trading experience. For that, Market Investopedia can be useful. Learn about market traps from our knowledgeable staff in a real-world setting. Attend our unique webinars on the intricate dynamics of the financial markets by getting in touch.
0 notes